
Abstract
Purpose
Fatigue is a major symptom of ABI. Greater fatigue is associated with cognitive impairment. Our aim was to systematically review, describe and analyse the literature on the extent of this relationship.
Methods
Five databases were searched from inception. Studies were included where: participants had a defined clinical diagnosis of ABI which included TBI, stroke or subarachnoid haemorrhage; a fatigue measure was included; at least one objective cognitive measure was used. Three reviewers individually identified studies and determined quality using the Quality Assessment Tool for Observational Cohort and Cross-sectional Studies.
Results
Sixteen of the 412 identified studies, investigating the relationship between cognitive dysfunction and fatigue, comprising a total of 1,745 participants, were included. Quality ranged from fair to good. Meta-analysis found fatigue was significantly associated with an overall pattern of cognitive slowing on tasks of sustained attention. A narrative synthesis found weak associations with fatigue and information processing, attention, memory and executive function.
Conclusion
Analysis found sustained attentional performance had stronger associations with fatigue after ABI. Whereas, weak associations were found between fatigue and information processing, attention and to some extent memory and executive function. More focused research on specific cognitive domains is needed to understand the mechanisms of fatigue.
Implications for Rehabilitation
Cognitive dysfunction is associated with higher fatigue levels after stroke, traumatic brain injury or subarachnoid haemorrhage.
Management of cognitive dysfunction may improve fatigue and participation in meaningful activities after stroke, traumatic brain injury or subarachnoid haemorrhage.
Intervention strategies that reduce cognitive load during everyday activities (e.g., grading the burden on attentional resources), may potentially be effective in managing post-ABI fatigue.
Agreement on core measures could facilitate integration of findings into clinical practice.
Introduction
Acquired Brain Injury is an injury to the brain that is not hereditary, congenital, degenerative, or induced by birth trauma [Citation1]. It is over-arching clinical term which includes Stroke, Traumatic Brain Injury (TBI), and Subarachnoid Haemorrhage (SAH), with the incidence of Stroke and TBI alone accounting for 13.7 [Citation2] and 69 million [Citation3] respectively each year worldwide [Citation1–Citation3]. These groupings (Stoke, SAH, TBI) will be collectively referred to as ABI within this review. Advances in medical management mean that more people are surviving and living longer with the consequences of ABI [Citation4,Citation5]. The number of people experiencing ABI at a younger age is also increasing. ABI is considered a long-term health condition [Citation5] with cognitive, physical, and psychological deficits affecting family, social and vocational roles.
Fatigue is reported by ABI survivors as a highly problematic and persisting experience with many rating it as their most severe symptom amongst post-ABI sequelae [Citation6–8]. Fatigue can be characterised in a number of ways, including physical, mental and social dimensions, resulting in an associated range of measurement strategies [Citation6,Citation9–12]. The complexity of this mechanism, presentation and measurement has led to inconsistency in reporting of fatigue trials in the literature, making it difficult to synthesise evidence. The mental or cognitive manifestations of fatigue are conceptualised by Chadhuri and Behan [Citation13] as a difficulty with initiating or sustaining attentional tasks, which is experienced without any peripheral motor impairment. Including cognitive fatigue is important, as individuals after an ABI often report a state of mental fatigue over physical fatigue, especially around performing a cognitive task which requires sustained effort [Citation14,Citation15]. An emerging approach, known as the “coping hypothesis,” states fatigue results from the compensatory effort required by individuals with an ABI to meet the demands of everyday life tasks in the presence of cognitive deficits, namely impaired attention and information processing abilities [Citation14,Citation16].
Cognitive dysfunction post ABI is also suggested to significantly overlap with and exacerbate any changes in physical, behavioural, or emotional status, and possibly fatigue [Citation6,Citation17–20]. However, whilst there have been extensive investigations into physical functioning and fatigue [Citation9,Citation21,Citation22], the nature of the relationship between cognitive impairment and fatigue after ABI has received limited attention. Cognitive impairments are common and troublesome sequelae post ABI with almost 70% of survivors demonstrating at least some cognitive impairment on neuropsychological assessment [Citation23,Citation24]. Existing research details deficits in core domains such as attention and information processing speed [Citation25], in line with revised definitions of post stroke vascular cognitive impairment [Citation26]. Given the negative impact of fatigue on participation, an investigation into the possible underlying mechanisms mediating mental fatigue after ABI has clinical implications [Citation5,Citation27,Citation28].
A systematic review in 2016, investigated the relationship between severity of fatigue, as assessed by questionnaire measures and broad cognitive abilities, after stroke [Citation23]. There was some evidence to indicate associations, however studies which focused on the presence or impact of fatigue were not reviewed as inclusion was restricted to those that captured severity of fatigue. Similarly, no review has examined the extent of the relationship of domain-specific cognitive changes with fatigue across acquired brain injury. Thus, the aim of this systematic review and meta-analysis was to establish the presence and extent of any associations of cognitive impairment and domain specific cognitive impairment to fatigue measures post ABI. The study design and quality of each study will be first described, and then followed by a meta-analysis and narrative summary of the reviewed literature.
Methods
This review was conducted in compliance with the Preferred Reporting Items for Systematic Reviews (PRISMA) guidelines [Citation29]. The protocol was registered with the International Prospective Register of Systematic Reviews (PROSPERO) in October 2019 (Registration no: CRD42019156038). A team of reviewers (ADi, JC, HG and HD) developed a pre-defined search strategy.
Types of participants
Adults aged 18 years and over (no upper age limit) who had a defined clinical diagnosis of ABI which includes TBI (moderate, severe), Stroke (all pathological subtypes), minor stroke, and Subarachnoid Haemorrhage where symptoms persisted over a 24-h period were included.
Studies with ABI participants with clinical symptoms typically lasting less than 24 h, and where diagnosis required less than 30 min of loss of consciousness, memory loss of less than 24 h, and GCS of 13–15 were excluded. ABI studies with cohorts with a clinical diagnosis of Transient Ischaemic Attack (TIA), Mild Traumatic Brain Injury or concussion were therefore excluded.
Differentiating between the mixed populations and sub-types of ABIs within each study required scrutiny of the individual study groups. Therefore, studies with mixed ABI study populations were initially included if the terms were detailed within the title and abstract of the papers. Following full assessment, papers were then included if at least 75% of participants had a defined clinical diagnosis of ABI which includes TBI (moderate, severe), Stroke or Subarachnoid Haemorrhage. If these participants comprised less than 75% of the study sample, studies were only included if they reported or provided separate data.
Types of studies and information sources
A comprehensive search strategy was developed with the terms Acquired Brain Injury, Stroke, fatigue, and cognitive impairment and their associated synonyms and terms (Supplementary Appendix 1 for the full search strategy). The search was limited to English language and human studies. Studies were included if a relationship between a cognitive impairment and fatigue was investigated. Any aspect of fatigue was included if it assessed concepts relating to fatigue, such as exhaustion, lack of energy or tiredness. Standardised and non-standardised fatigue measures were included. Studies were included if they reported at least one quantitative outcome measure of cognition. We specified objective outcome measures of cognitive impairment, as subjective measures are known to be related to behavioural responses and mood and might therefore bias the relationship under investigation [Citation30]. To aid interpretation, cognitive assessments and fatigue measures were categorised in accordance to how they have been described in each study.
Randomised control trials, cohort studies, case-control and cross-sectional studies were considered for this review. Systematic reviews, single case studies, reviews and editorials, paediatric studies, dissertations, and articles with no primary data were excluded.
For the purpose of summarising the literature comprehensively, no distinction was made between study setting and timing of assessment of cognitive impairment or fatigue (). The following databases were searched from the date of inception to 21 March 2022: PsycINFO, PubMed, CINAHL, OT Seeker, and Web of Science.
Table 1. Demographic characteristics, clinical variables in ABI, study participants (n = 1,745), and risk of bias.
Data extraction, charting process and quality assessment
Data were extracted using a pre-defined abstraction form adapted for this review by one of the reviewers (ADi) and then verified by the second and third reviewers (HG, JC). Three reviewers independently screened the title and abstracts against the inclusion criteria (ADi, HG, and JC). Full text articles were obtained for all titles/abstracts that met the inclusion criteria and/or where there was any uncertainty. Three reviewers read the full reports and decided whether they met the inclusion criteria. Any disagreements were resolved by a fourth independent reviewer (HD). Next, the reference lists of all identified studies were hand searched to identify further potentially relevant studies. Data were presented as per PRISMA guidelines, with a PRISMA flow chart used to present the progression of study selection against the inclusion/exclusion criteria (). Extracted information included: Population demographics and ABI characteristics (), measures of cognitive impairment () and for fatigue (). Contact was made with authors of primary studies or reviews where further information was required. We hand searched the reference lists of the eligible studies and any papers identified were reviewed against the inclusion criteria.
Figure 1. Preferred reporting item for systematic review and meta – analysis flow chart study selection.
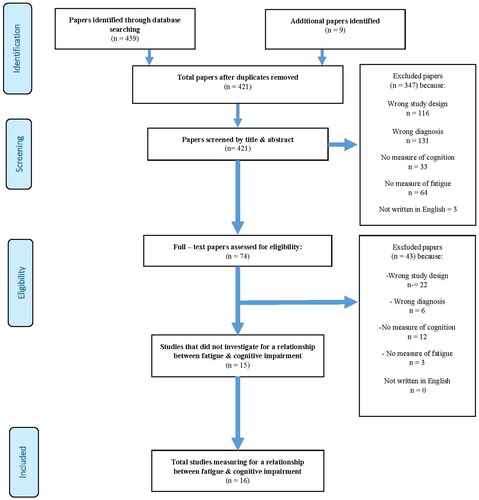
Table 2. Study details and overall findings.
Table 3. Fatigue scales and dimensions assessed.
Three assessors (ADi, JC, and HG) independently assessed for risk of bias using the quality assessment tool for observational and cross-sectional studies [Citation33]. This tool consists of 14 items that examine the key concepts of each study’s internal validity and scientific contribution including, reliability, implementation and timeframe of outcome measures and assessment strategies used. Confounding variables, selection and attrition bias were also under review. The tool provided a rating for low, fair or high risk of bias and informed the interpretation of our results ().
Strategy for data synthesis
Due to the heterogeneity of measurement approaches and ABI populations, a mixed method approach was used to analyse the data: A narrative synthesis detailed the characteristics and findings of all studies (see also Analysis of subgroups).
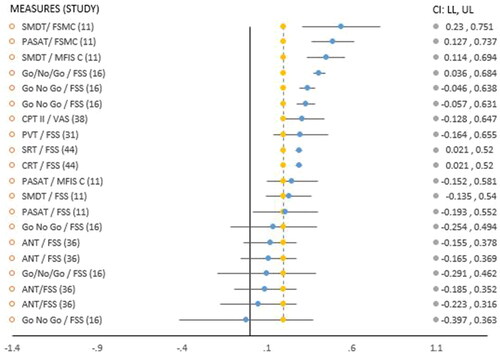
Meta-analysis was performed on studies that investigated the relationship between mean reaction times (RTs) and fatigue, if data were available within individual studies and in the appropriate format (Pearson’s r). A bespoke Exploratory Software for Confidence Intervals for analysis of Pearson r correlations was used [Citation34]. As observed RTs differences are often vulnerable to trade-offs between speed and accuracy [Citation35,Citation36], only RTs (i.e., scores based on speed of RT) were included in meta-analysis (). Also, mean RTs were the most consistent data available and in the appropriate format (correlations, r) to complete this analysis.
Figure 2. Forest plot displaying reaction time scores in Pearson’s r and relationship between cognitive measures/fatigue scales.
Analysis of subgroups or subsets
Due to the heterogeneity of ABI populations, it was not possible to explicitly pre-define subgroups in advance. Instead, subgroup analyses were performed where sufficient data on specific cognitive domains, assessments used, and study design were available. For this, the number of associations made in each study were counted. In longitudinal studies with multiple data time points, associations made were counted at each time point. We also determined whether studies were adequately powered. To detect a medium effect of association an α = 0.05 (2 tailed), and power of 0.9 was used. Therefore, studies with a sample <144 participants were deemed underpowered [Citation37,Citation38] and not included in this stage of the analysis [Citation39]. Associations that were found to be positive within subgroups were described in percentage. Three main sections are presented: (1) Study designs and study quality; (2) Overview and meta-analysis of associations between cognitive impairment and fatigue; (3) Detailed breakdown of domain specific cognitive impairment, the assessments used and their relationship to fatigue measures.
Results
Study designs and study quality
Overall, 16 studies met the inclusion criteria. The ABI populations varied and included four studies with a Traumatic Brain Injury sample [Citation15,Citation16,Citation31,Citation38], ten with a stroke sample [Citation11,Citation12,Citation32,Citation36,Citation37,Citation40–44], and two studies in a Subarachnoid Haemorrhage sample [Citation10,Citation45]. Two further studies had mixed sample populations [Citation46,Citation47], however, did not meet the inclusion criteria: one had the wrong study design [Citation46] with no separate data available, the other did not investigate for a relationship [Citation47] and could not be included at this point. With regards to study design, eleven studies employed a cross-sectional design with the remaining five studies being longitudinal cohort designs.
Study quality
The study quality ranged from fair to low risk of bias. Justification, power description, or variance and effect estimates was not provided in 89% of studies. Overall, exposure measures were valid and reliable, with the exception of one study using a non-standardised fatigue measure used [Citation32]. Measures were not clearly defined in certain studies [Citation10,Citation12,Citation38,Citation42,Citation43]. There was a total of 1,745 (M973/F772) participants across these studies: TBI 112 (M36/F76); Stroke 1,479 (M889/F590); SAH 154 (M48/F106). Seven studies had fewer than 50 participants [Citation11,Citation15,Citation16,Citation31,Citation37,Citation38,Citation43], the larger sample sizes tended to come from stroke studies with 8/10 studies having between 53-325 participants ().
Overview of measures
There were a total of 59 measures of cognition used including objective, subjective and reaction time assessments (). These measures included cognitive screening measures, neuropsychological assessment and reaction time (RT) based assessments. In all, 51 assessments were paper based subtests from detailed neuropsychological batteries of assessment.
In total, there were eight measures used to explore fatigue levels, and these were grouped into either unified style scales or multi-dimensional scales to aid analysis (). A unified scale, often referred to as Likert self-rating scale was often used to capture the experience of momentary fatigue or fatigue over a given period. The Fatigue Severity Scale (FSS) was the most frequently used unified scale. The FSS “clinical cut off” score varied across the studies from ≥4 [Citation10,Citation31,Citation36,Citation37,Citation41,Citation44,Citation45], ≥4.6 [Citation11] and ≥5 [Citation42]. One study did not indicate this score [Citation16].
A multi-dimensional (MD) fatigue scale aims to capture various aspects that describe the experience of fatigue such as mental, cognitive, physical, and social aspects.
Overview and meta-analysis of associations between cognitive impairment and fatigue
In total, 221 associations were investigated between cognitive impairment and fatigue across 16 studies (). Eleven studies found a 30% rate of positive association (67/221 comparisons analysed) between a cognitive impairment and fatigue across ABI populations [Citation10–12,Citation15,Citation16,Citation31,Citation36,Citation40,Citation43–45]. The remaining five studies did not find an association across 40 comparisons [Citation32,Citation37,Citation38,Citation41,Citation42], two of these studies [Citation37,Citation38] were underpowered ( and ). In terms of domain specific investigations, the highest rate of positive association was with the domain of information processing with 48% of all specific associations reported found to be significant. The domain of attention had a 40% rate of positive association with fatigue levels, memory had 16% and executive functioning had 14% ().
Table 4. Summary of domain specific comparisons made, associations found, rate of positivity (%).
A unified fatigue scale was used in 14 studies [Citation10,Citation11,Citation15,Citation16,Citation31,Citation32,Citation36–38,Citation41–45] and had an overall 24% rate of positive association with a cognitive impairment (). Notably, the two studies [Citation11,Citation42] that used higher FSS cut off scores did not find an association. All three studies that used the cognitive dimension of a Multi-Dimensional scale found positive associations with a cognitive domain impairment [Citation11,Citation12,Citation40], an overall 56% rate of positive association ().
In terms of measuring cognition and fatigue, the majority of studies used standardised cognitive screening and/or neuropsychological batteries to determine cognitive changes, though more complex experimental tasks aimed at picking up more subtle changes were also used by some.
Cognitive screening measures & fatigue
Global dementia screens were utilised across five studies to investigate for a relationship [Citation32,Citation37,Citation40,Citation42,Citation44], with two finding positive associations [Citation40,Citation44]. Delva et al. [Citation40] formed a positive association with fatigue using the Montreal Cognitive Assessment (MoCA) and a multi-dimensional fatigue measure (MFI-20, mental dimension) at 3 times points (6 months: OR 3.23; CI 1.12–5.80; p = 0.03; 9 months: OR 2.77; CI 1.12–6.88; p = 0.03; 12 months OR, 5.95: CI 2.18 − 16.28; p = 0.005). Goh & Stewart [Citation44] formed a positive association with the MOCA and the FSS, alongside two reaction time based assessments (SRT, CRT). Holmberg et al. [Citation32] did not find an association with the MOCA and a Likert scale, 3 months post stroke. The other two studies [Citation37,Citation42] failed to make an association with fatigue using another global dementia screen, the Mini-Mental State Examination (MMSE). Of these, one study was underpowered [Citation37].
Domain-specific standardised neuropsychological assessment batteries & fatigue
A total of 9 studies utilised detailed neuropsychological batteries targeting specific cognitive domains when investigating a relationship across lengthy testing procedures [Citation10–12,Citation38,Citation41–45]. Of these, six studies found a 23% rate of positive association (). Three studies did not find an association [Citation38,Citation41,Citation42]. One study [Citation41] reported that the failure to make an association could be due to participants having relatively minimal cognitive deficits. One study was underpowered [Citation38]. Two studies [Citation12,Citation45] used the sum score across a battery of cognitive assessments to investigate a relationship with fatigue levels, and 3/3 associations were established.
Nine studies that considered fatigue during testing procedures [Citation10,Citation11,Citation15,Citation16,Citation31,Citation36,Citation40,Citation44,Citation45] found a positive association with cognitive impairment. Of the remaining seven studies [Citation12,Citation32,Citation37,Citation38,Citation41–43] that did not consider a break (not explicitly mentioned), a relationship was not found in five studies [Citation32,Citation37,Citation38,Citation41,Citation42]. Fatigue levels were examined pre or post-testing of the cognitive task trial within six studies [Citation10,Citation11,Citation15,Citation16,Citation31,Citation38]. Of these, five studies found an association with a cognitive impairment [Citation10,Citation11,Citation15,Citation16,Citation31] and the FSS [Citation10,Citation15], the Visual Analogue Scale (VAS) [Citation16], the Fatigue Scale for Motor and Cognitive Functions (FSMC) [Citation11] and Modified Fatigue Impact Scale (MFIS) [Citation11]
Complex task approaches and reaction time based assessments
Analytical approaches based on mean Reaction Times (RTs) was used to investigate a relationship with fatigue in seven studies [Citation11,Citation15,Citation16,Citation31,Citation36,Citation38,Citation44]. This approach required participants to sustain attention on challenging reaction time based assessments (RT). Shorter RTs suggest faster information processing speed [Citation38]. Longer RTs were an indication of difficulty with sustaining attention [Citation16,Citation31], mental fatigue [Citation36] or mental effort [Citation15]. In all, six studies [Citation11,Citation15,Citation16,Citation31,Citation36,Citation44] found a 39% positive association (). The one study that did not find a relationship was underpowered [Citation38].
Meta-analysis
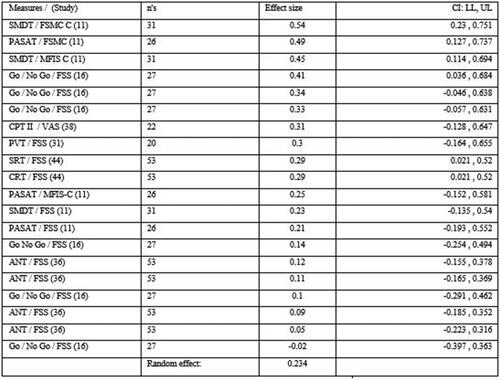
Only the studies employing RT based measures had sufficient comparable data to conduct a meta-analysis on the correlations found between fatigue levels and processing speed performance on cognitive tasks. The meta-analysis found a significant but low overall effect size (r = 0.234) between higher fatigue levels and mean RTs [Citation11,Citation16, Citation31, Citation36,Citation38,Citation44] ( and ].
Figure 3. Meta-analysis effect size in Pearson’s r.
Figure 2 &3, Abbreviations of cognitive assessments: SMDT: Symbol Digit Modalities Test; PASAT: Paced Auditory Serial Addition Test; CPT II: Continuous Performance Test II; PVT: Psychomotor Vigilance Task; SRT: simple reaction time; CRT: choice reaction time; ANT: Attention Network Test. Abbreviations of fatigue measures: FSMC – C: Fatigue Scale of Motor and Cognition – cognitive subscale; MFIS – C: Modified Fatigue Impact Scale, cognitive subscale; VAS: Visual Analog Scale; FSS: Fatigue Severity Scale. : Positive threshold target (yellow vertical line), 0.2.
This evidence was of moderate quality (, Risk of bias). There was insufficient reporting of results in one study [Citation15], correlation values were not shown and described as “low.” Another study [Citation36] used a mixed models approach when making comparisons. Therefore, these results [Citation15,Citation36] could not be included in meta-analysis. Duration of the specific assessment lasted more than 10 min in most studies [Citation11,Citation15,Citation16,Citation31,Citation36,Citation38,Citation44]. Although certain studies did not detail the duration of each session, this can be inferred from the testing procedures used [Citation11,Citation15,Citation44].
One study [Citation44] found a significant relationship between baseline fatigue (FSS) and increased RTs (SRT r = 0.29, p = 0.03, CRT r = 0.29, p = 0.03), and reports the findings may be due to a manifestation of cognitive deficits particularly information processing, and vigilance/attention: correlation coefficients were reported as fair in strength. Another study [Citation11] did not find a significant correlation with baseline FSS scores and RT measures: SDMT (0.23, p < 0.0); PASAT (0.21, p < 0.01) but did when cognitive subscales of two multidimensional fatigue scales were applied: MFIS-C (SMDT: r = 0.45, p < 0.05) and FSMC-C (SMDT: r = 0.54, p < 0.01; PASAT: r = 0.49, p < 0.05). FSS clinical cut-offs values were higher at >4.6 in this study in comparison to another study [Citation44] who did find an association using a cut off of >4. One study [Citation16] that completed two RT sessions on the Go/No Go with TBI participants (2 × 30 min sessions, T1 & T2) also found baseline fatigue (FSS) was significantly correlated with deterioration in RTs during the second session only (r = 0.41, p ≤ 0.5). Accuracy was associated with fatigue (FSS) in the first session only, but stayed steady during the second half. These findings may be an indication of fatigability with time on task accounting for effects seen during T2, however significant associations were also reported with higher mental effort and increased RTs across both sessions.
Another study [Citation15] reported “low” correlations between higher levels of momentary subjective and mental effort (VAS) to perform tasks, even during relatively simple tasks (Go/No Go) in comparison to healthy controls, and described as resulting in higher sensations of fatigue. As mentioned, data was not shown in the study [Citation15].
Complexity of task was heightened in two studies [Citation36,Citation38]. The first study [Citation38] did not find a relationship across 4 reaction time conditions on the CPT II (r= <0.31, p ≥ 0.16) and fatigue (VAS-f). There was a significant relationship between RT scores and “sleepiness” (VAS-s) before and after testing (r = 0.55, p < 0.01) with a noted progressive slowing in RT over time in the TBI group, compared to healthy controls possibly due to “accumulated fatigue” while sustaining [attentional] tasks. We explored the consequence of adding this trial to the analysis; the overall effect remained positive (r = 0.236).
The other study [Citation36] did not find a significant association between FSS and mean RT across (r=0.09, p=0.48) or within varying complex conditions (incongruent flanker: r = 0.05, p=0.67, congruent flanker: r=0.11, p=0.47, neutral flanker: r=0.12, p=0.37). However, results from linear mixed models identified significant associations between FSS score and RT with an observed decrement in sustained performance over time, however this format of analysis could not be included in meta-analysis. The final study [Citation31], identified an overall pattern of cognitive slowing across the attention task (The PVT), with delayed RTs seen from the onset (between 1 and 2 min) in comparison to healthy controls. However, statistical significance was not reached (r < 0.30, p > 0.14), the authors explain that this is likely due to the large heterogeneity between participants. On a much smaller homogenous sample (n = 3), the authors did observe a significant relationship with fatigue (FSS), speed of information processing and attention deficits (PVT). Values were not provided in a suitable format (in r) to include in meta-analysis [Citation31].
Domain specific cognitive impairment, assessments used and their relation to fatigue measures: overall findings
Information processing
The relationship between the domain of information processing and fatigue was investigated across five studies [Citation10,Citation11,Citation41,Citation43,Citation44]. Four studies established a 48% rate of positive association with fatigue [Citation10,Citation11,Citation43,Citation44] (). All five studies were adequately powered. There were nine different cognitive assessments used when completing the investigations. Six cognitive assessments were paper based, with four assessments (TMT A, Digit span, D2 and symbol substitution) finding 8/19 positive associations [Citation10,Citation43], and all were formed with unified fatigue scales: the FSS (4) and POMS-f (4). Two assessments were reaction time based assessments (SRT, SMDT), with both assessments finding 3/4 positive associations [Citation11,Citation44] using a variety of fatigue scales – the FSS (1), the MFIS (1) and the FSMC (1).
Attention
The domain of attention was the most frequently investigated domain across ten studies [Citation10,Citation12,Citation15,Citation16,Citation31,Citation36,Citation38,Citation41,Citation44,Citation45]. Eight studies found a 40% rate of positive association with fatigue [Citation10,Citation12,Citation15,Citation16,Citation31,Citation36,Citation44,Citation45] (). One study that did not find an association were underpowered [Citation38]. In all, 13 different cognitive assessments were used to investigate various domain specific aspects of attention including sustained, divided, and selective attention. Seven cognitive assessments were paper based tasks, with 3 assessments (TEA, D2, Digit span) finding 9/18 associations [Citation10,Citation12]. Two fatigue measures were used in these instances, the FAI (5) [Citation12], and the FSS (4) [Citation10]. Seven assessments were reaction time (RT) based assessments, with three (RT) assessments (Go No Go, CRT, ANT) finding 24/64 positive associations with fatigue levels [Citation15,Citation16,Citation36,Citation44]. Two unified fatigue measures were used when forming these associations: the VAS (10) [Citation15], and the FSS (14) [Citation16,Citation36,Citation44]. As noted (see Meta-analysis), the PVT also found positive associations with fatigue levels [Citation31].
Memory
The relationship between the domain of memory and fatigue levels was explored across seven studies [Citation10–12,Citation38,Citation42,Citation43,Citation45]. Four studies found 16% rate of association with fatigue [Citation10–12,Citation43], (). One study that did not find an association was underpowered [Citation38]. In all, 19 paper based assessments and one reaction time based assessment of memory were used to assess either short-term or long-term memory. Two studies found weak associations (3) when using unified fatigue scales (1/13 with FSS; 2/12 with POMS-f) [Citation10,Citation12]. Two studies found the remaining six associations using the cognitive dimensions from three multi-dimensional fatigue scales were applied – the MFIS-C (2), FSMC (3), and FAI (1) [Citation11,Citation12].
Executive function
The domain of executive function was assessed in six studies [Citation10–12,Citation42,Citation43,Citation45]. Three studies [Citation10–12] found a 14% rate of positivity (). All studies that did not find an association were adequately powered [Citation42,Citation43,Citation45]. Eight different paper based cognitive measures were used. One study found weak associations (2) with a Word Fluency Task and the FSS fatigue scale [Citation10]. Two studies used three cognitive assessments (Word list generation, Stroop, Category and Letter Fluency task) and two multi-dimensional fatigue scales to find three positive associations – the MFIS-C (1), and the FAI (2) [Citation11,Citation12].
Language was investigated in one study with 2/4 positive associations found with a multi-dimensional fatigue measure (FAI) [Citation12] (). There was no association with reasoning [Citation43], or visuoconstruction [Citation10] and fatigue levels, nor a subjective cognitive assessment and fatigue [Citation10]. Two studies utilised the sum score across a battery of assessments to find the three remaining associations with fatigue [Citation12,Citation45].
Discussion
To the researchers’ knowledge, this is the first systematic review that explored the complex relationship between cognitive impairment and fatigue after Acquired Brain Injury (ABI). We found overall that the association between cognitive impairment and fatigue across the included ABI populations was weak (67/221). However, in-depth analysis of domain specific cognitive impairment revealed more robust relationships with fatigue levels. The domains of information processing and attention were the most frequently investigated cognitive domains and consistently associated with fatigue post-ABI, reaching statistical significance. Furthermore, studies that challenged attentional resources (i.e., via Reaction time based assessments) were positively associated with fatigue (7/7 studies), some results were dependent on the method of data analysis performed [Citation36,Citation38] and population sample assessed [Citation31].
Our results showed an overall weak association between a cognitive impairment and fatigue. This review contributes new insights that may explain why we managed to find a relationship in comparison to other studies who found none [Citation23,Citation48]. First, the broad scope of this review lends itself to extensive investigations of this literature (as opposed to stroke alone [Citation23,Citation48]) and underlines the plethora of measures and methodologies used across the included ABI studies. Next, our results provide insights on the use of two domain general screens, the MMSE and the MOCA: while the lack of association with the MMSE [Citation37,Citation42] aligns with previous study findings [Citation23,Citation48], we found associations with fatigue and the MOCA in two studies [Citation40,Citation44]. Delva et al. [Citation40] formed an association with fatigue using the MOCA and a multi-dimensional fatigue measure (MFI-20, mental dimension) however, wide confidence intervals were applied to make these associations. Goh & Stewart [Citation44] formed a positive association with the MOCA and the FSS, alongside two RT assessments (SRT, CRT). The authors [Citation44] explained that the MOCA may be a more sensitive assessment to investigate this relationship, as executive function and attention are included in this screen and not the MMSE. Although, one study [Citation32] noted that lack of association in their research was due to the use of the MOCA, a global dementia screen known to be insensitive in detecting cognitive change after stroke, which aligns with previous studies [Citation23,Citation49]. Indeed, the measurement strategy used [Citation44] could have placed demands on other cognitive processes, such as sustained performance, given the use of two RT testing measures [Citation44]. It is therefore unclear if the associations formed in these studies [Citation40,Citation44] were due to the measures used, a domain specific function required to complete the test or indeed the measurement strategy.
In addition, while there is sufficient evidence for the use of domain specific cognitive batteries of assessment when investigating this relationship (32/141), the observed associations are also weak overall. This may be due to two possible reasons: (1) the subtests have been used interchangeably to assess several cognitive domains across some studies. For example, the D2 was used to find associations with fatigue and sustained attention in one study [Citation12], and with speed of information processing and concentration performance in another [Citation10] (2) While the research has shown how batteries of assessment offer valid standalone subtests that reliably detect cognitive dysfunction within core domains, arguably each subtest involves several cognitive processes alongside the domain under review. For example, the TMT was utilised in studies to assess speed of information processing [Citation10,Citation43], selective attention, scanning, sequencing, motor speed [Citation38], and executive function (obtained by using both TMT forms A & B) [Citation10,Citation42]. These findings are also unclear and likely account for the weak associations overall (See for further examples and results). 3) The approaches used may well exacerbate fatigue for participants. The experience of fatigue may be triggered by the lengthy duration of the testing procedure, rather than a dysfunction in a cognitive domain per se. For example, five [Citation32,Citation37,Citation38,Citation41,Citation42] of the seven studies that did not consider a break (that is, not explicitly stated), did not find an association. Conversely, all nine studies that made attempts to minimise fatiguing situations (such as offering alternative testing days [Citation44], split sessions [Citation16]), found positive associations (9/9 studies). The findings indicate that attentional load (i.e., sustained attentional performance) may be relating to fatigue not fatigue elicited through the testing method [Citation10,Citation11,Citation15,Citation16,Citation31,Citation36,Citation40,Citation44,Citation45].
An in-depth analysis of cognitive domain investigations revealed positive associations with information processing and attention, and to some extent memory and executive function and higher fatigue levels after an ABI. The domains of information processing and attention were most frequently investigated and consistently associated with fatigue. A possible theoretical explanation is that information processing and attention are core domains within a hierarchy of cognition and any changes to these may affect appropriate functioning of higher-level cognitive abilities, such as executive function, and possibly new learning [Citation19,Citation36]. This theory supports the observed interaction between increasing RTs and higher fatigue levels as participants failed to benefit from any learning effect as they progressed through the task, a finding previously noted in one study [Citation36]. An array of techniques are emerging to objectively measure the cognitive manifestations of fatigue within the literature, with typical measurements of deterioration of performance during sustained activity. RT testing (finding 28/71 positive comparisons) may have exposed subtle cognitive deficits that give rise to the manifestations of fatigue, namely information processing and attention. The results from meta-analysis found fatigue was significantly associated with an overall pattern of slowing in RT over time and this was irrespective of complexity of the task. The findings indicate that sustaining an optimal performance on a task of attention over a prolonged period (>10 min) requires greater mental effort [Citation15,Citation16] which may come at a cost of feeling increasingly fatigued. These findings support the theoretical framework of the “coping hypothesis” [Citation50], where the experience of fatigue could be from the constant compensatory effort required by individuals with an ABI to maintain performance on tasks in the absence of internal attentional resources, resulting in a response perceived as mental fatigue. However, the complex aetiology involved in each domain, for example the domain of attention, were not entirely accounted for in studies, so results are not entirely conclusive. Further targeted research is needed to establish the strength of associations between cognitive changes after ABI and fatigue.
Half of the studies that used the FSS did not find an association with cognitive impairment. As the FSS has no validated “cut-off” score to define clinically significant fatigue [Citation41], the variability of this could account for the results. As seen, studies that used a higher FSS clinical cut off score [Citation11,Citation42] did not find an association in comparison to others who used a lower (<4) cut off point [Citation10,Citation44,Citation45]. One study [Citation11], using a higher FSS cut off score did not find an association with fatigue but did using two MD fatigue scales (FSMC, FMIS-C). The use of multi-dimensional scales in studies may have minimised confounders known to be associated with response rates (e.g., difficulty with recall) and assisted with the sub-domains under review (e.g., cognitive aspects), increasing the rate of positive association. One study [Citation38] found an association between a cognitive impairment and “sleepiness” (VAS-s) describing the observations as “accumulated fatigue.” These results [Citation10,Citation11,Citation42,Citation44] highlight the lack of a universally accepted definition and measurement of fatigue.
This present review has limitations. The broad scope was both a strength and a limitation. First, all categories of ABI were included where rehabilitation was usually provided. This however, does not include other forms of ABI including mild TBI, a sub-group shown to experience severe fatigue post-ABI [Citation51]. Second, all types of studies were included, irrespective of analysis performed. The heterogeneity of assessment used and analysis methods across these studies, meant that a meta–analysis was limited to reaction time based assessments (RT speed) only. This study was operationalised to address the complex question of the relationship between cognitive impairment and fatigue. However, this methodology may favour a reporting bias, as for example certain eligible studies could not be included in the meta-analyses due to the data not being in a suitable format [Citation31,Citation36]. Results from the included studies (Stroke, TBI and SAH) and meta-analyses in this review should be interpreted with this in mind. Indeed, the findings in this review may favour significant outcomes, as in certain instances the associations formed are not only non-specific, the findings overall are weak. It must also be noted that not all confounding factors of fatigue such as diurnal changes and comorbidities were documented in all studies, factors known to be associated to the experience of fatigue. In addition, primary data was not provided in two studies, Radman et al. [Citation12] and Azouvi et al. [Citation15], contact was made however no response has been received to date. While most studies found an association, results should be interpreted with caution, as a number of studies have a fair risk of bias ().
Conclusion
Overall this review provides positive, though relatively weak, evidence for a relationship within the core domains of information processing and attention – and, to some extent, memory and executive function, and higher fatigue levels after ABI. To identify more robust relationships, we suggest the use of purer measures targeting domain specific functions could reveal stronger associations. Evidently it appears that sustained attentional tasks demand greater mental effort for optimal performance, but this comes with a cost of feeling very fatigued.
Appendix_1.docx
Download MS Word (14.7 KB)Disclosure statement
The views expressed are those of the authors and not necessarily those of the NHS, the NIHR or the Department of Health. No potential conflict of interest was reported by the author(s).
Additional information
Funding
References
- Brain Association of America Website. [cited 2022 Nov 4]. Available from: https://www.biausa.org/brain-injury/about-brain-injury/basics/overview#:∼:text=An%20acquired%20brain%20injury%20(ABI,that%20has%20occurred%20after%20birth.
- Johnson CO, Nguyen M, Roth G, et al. Global, regional, and national burden of stroke, 1990–2016: a systematic analysis for the global burden of disease study 2016. Lancet Neurol. 2019;18(5):439–458.
- Dewan MC, Rattani A, Gupta S, et al. Estimating the global incidence of traumatic brain injury. J Neurosurg. 2019;130(4):1080–1097.
- Shapiro CM, Mollayeva T, Mollayeva S, et al. A systematic review of fatigue in patients with traumatic brain injury: the course, predictors and consequences. Arch Phys Med Rehab. 2014;95(10):e73.
- Ezekiel L, Collett J, Mayo N, et al. Factors associated with participation in life situations for adults with stroke: a systematic review. Arch Phys Med Rehabil. 2019;100(5):945–955.
- DeLuca J. Fatigue as a window to the brain. Cambridge, Mass: MIT Press; 2005.
- Hinkle JL, Becker KJ, Kim JS, et al. Poststroke fatigue: emerging evidence and approaches to management. A scientific statement for healthcare professionals from the American Heart Association. Stroke. 2017;48(7):159–170.
- Boerboom W, Heijenbrok-Kal M, Khajeh L, et al. Differences in cognitive and emotional outcomes between patients with perimesencephalic and aneurysmal subarachnoid haemorrhage. J Rehabil Med. 2014;46(1):28–32.
- Kuppuswamy A, Clark EV, Turner IF, et al. Post-stroke fatigue: a deficit in corticomotor excitability? Brain. 2015;138(Pt 1):136–148.
- Boerboom W, Van Zandvoort MJ, van Kooten F, et al. Long-term fatigue after perimesencephalic subarachnoid haemorrhage in relation to cognitive functioning, mood and comorbidity. Disabil Rehabil. 2017;39(9):928–933.
- Hubacher M, Calabrese P, Bassetti C, et al. Assessment of post-stroke fatigue: the fatigue scale for motor and cognitive functions. Eur Neurol. 2012;67(6):377–384.
- Radman N, Staub F, Aboulafia-Brakha T, et al. Poststroke fatigue following minor infarcts: a prospective study. Neurology. 2012;79(14):1422–1427.
- Chaudhuri A, Behan PO. Fatigue in neurological conditions. Lancet. 2004;363(9413):978–988.
- Ashman TA, Cantor JB, Gordon WA, et al. Objective measurement of fatigue following traumatic brain injury. J Head Trauma Rehabil. 2008;23(1):33–40.
- Azouvi P, Couillet J, Leclercq M, et al. Divided attention and mental effort after severe traumatic brain injury. Neuropsychologia. 2004;42(9):1260–1268.
- Belmont A, Agar N, Azouvi P. Subjective fatigue, mental effort, and attention deficits after severe traumatic brain injury. Neurorehabil Neural Repair. 2009;23(9):939–944.
- Wu S, Mead G, Macleod M, et al. Model of understanding fatigue after stroke. Stroke. 2015;46(3):893–898.
- Staub F, Bogousslavsky J. Fatigue after stroke: a major but neglected issue. Cerebrovasc Dis. 2001;12(2):75–81.
- Kutlubaev MA, Duncan FH, Mead GE. Biological correlates of post‐stroke fatigue: a systematic review. Acta Neurol Scand. 2012;125(4):219–227.
- Johansson B, Rönnbäck L. Mental fatigue and cognitive impairment after an almost neurological recovered stroke. ISRN Psychiatry. 2012;2012:1–7.
- Colle F, Bonan I, Gellez Leman MC, et al. Fatigue after stroke. Ann Readapt Med Phys. 2006;49(6):272–276.
- Lewis SJ, Barugh AJ, Greig CA, et al. Is fatigue after stroke associated with physical deconditioning? A cross-sectional study in ambulatory stroke survivors. Arch Phys Med Rehabil. 2011;92(2):295–298.
- Lagogianni C, Thomas S, Lincoln N. Examining the relationship between fatigue and cognition after stroke: a systematic review. Neuropsychol Rehabil. 2018;28(1):57–116.
- Eilertsen G, Ormstad H, Kirkevold M. Experiences of poststroke fatigue: qualitative meta-synthesis. J Adv Nurs. 2013;69(3):514–525.
- Demeyere N, Riddoch MJ, Slavkova ED, et al. Domain-specific versus generalized cognitive screening in acute stroke. J Neurol. 2016;263(2):306–315.
- Duncan F, Wu S, Mead GE. Frequency and natural history of fatigue after stroke: a systematic review of longitudinal studies. J Psychosom Res. 2012;73(1):18–27.
- Van Markus-Doornbosch F, van der Holst M, de Kloet AJ, et al. Fatigue, participation and quality of life in adolescents and young adults with acquired brain injury in an outpatient rehabilitation cohort. Dev Neurorehabil. 2020;23(5):328–335.
- De Vries EA, Boerboom W, Van den Berg-Emons R, et al. Fatigue is associated with reduced participation and health-related quality of life five years after perimesencephalic subarachnoid haemorrhage: a multicentre Cross-Sectional study. JRM. 2022;54:jrm00271.
- Moher D, Shamseer L, Clarke M, PRISMA-P Group, et al. Preferred reporting items for systematic reviews and meta-analyses: the PRISMA statement. Syst Rev. 2015;4(1):1–181.
- Payne TW, Schnapp MA. The relationship between negative affect and reported cognitive failures. Depress Res Treat. 2014;2014:396195.
- Sinclair KL, Ponsford JL, Rajaratnam SM, et al. Sustained attention following traumatic brain injury: use of the psychomotor vigilance task. J Clin Exp Neuropsychol. 2013;35(2):210–224.
- Holmberg J, Jondell B, Abzhandadze T, et al. Very early cognitive screening and self-reported feeling of fatigue three months after stroke. Front Hum Neurosci. 2021;15:742105.
- NHBLI. Quality assessment tool for observational cohort and cross – sectional studies [cited 2020 Aug 21]. Available from: https://www.nhlbi.nih.gov/health-pro/guidelines/indevelop/cardiovascular-risk-reduction/tools/cohort.
- ESCI web. Exploratory software for confidence intervals [cited 2021 Jul 23]. Available from: https://www.esci.thenewstatistics.com/.
- Shalev N, Humphreys G, Demeyere N. Assessing the temporal aspects of attention and its correlates in aging and chronic stroke patients. Neuropsychologia. 2016;92:59–68.
- Ulrichsen KM, Alnaes D, Kolskår KK, et al. Dissecting the cognitive phenotype of post‐stroke fatigue using computerized assessment and computational modelling of sustained attention. Eur J Neurosci. 2020;52(7):3828–3845.
- Park JY, Chun MH, Kang SH, et al. Functional outcome in poststroke patients with or without fatigue. Am J Phys Med Rehabil. 2009;88(7):554–558.
- Beaulieu-Bonneau S, Ouellet MC. Fatigue in the first year after traumatic brain injury: course, relationship with injury severity, and correlates. Neuropsychol Rehabil. 2017;27(7):983–1001.
- Faul F, Erdfelder E, Lang A-G, et al. G*power 3: a flexible statistical power analysis program for the social, behavioral, and biomedical sciences. Behav Res Methods. 2007;39(2):175–191.
- Delva M, Lytvynenko N, Delva I. Factors associated with post-stroke fatigue during the second half year after stroke. Georgian Med News. 2017;272:59–64.
- Drummond A, Hawkins L, Sprigg N, et al. The Nottingham Fatigue After Stroke (NotFAST) study: factors associated with severity of fatigue in stroke patients without depression. Clin Rehabil. 2017;31(10):1406–1415.
- Morsund ÅH, Ellekjaer H, Gramstad A, et al. The development of cognitive and emotional impairment after a minor stroke: a longitudinal study. Acta Neurol Scand. 2019;140(4):281–289.
- Pihlaja R, Uimonen J, Mustanoja S, et al. Post-stroke fatigue is associated with impaired processing speed and memory functions in first-ever stroke patients. J Psychosom Res. 2014;77(5):380–384.
- Goh HT, Stewart JC. Poststroke fatigue is related to motor and cognitive performance: a secondary analysis. J Neurol Phys Ther. 2019;43(4):233–239.
- Passier PECA, Post MWM, Van Zandvoort MJE, et al. Predicting fatigue 1 year after aneurysmal subarachnoid hemorrhage. J Neurol. 2011;258(6):1091–1097.
- Morsund ÅH, Ellekjær H, Gramstad A, et al. Cognitive and emotional impairment after minor stroke and non-ST-elevation myocardial infarction (NSTEMI): a prevalence study. Stroke Res Treat. 2019;2019:2527384.
- Claros-Salinas D, Bratzke D, Greitemann G, et al. Fatigue-related diurnal variations of cognitive performance in multiple sclerosis and stroke patients. J Neurol Sci. 2010;295(1–2):75–81.
- Ponchel A, Bombois S, Bordet R, et al. Factors associated with poststroke fatigue: a systematic review. Stroke Res Treat. 2015;2015:1–11.
- Demeyere N, Riddoch MJ, Slavkova ED, et al. The oxford cognitive screen (OCS): validation of a stroke-specific short cognitive screening tool. Psychol Assess. 2015;27(3):883–894.
- Van Zomeren A, Van den Burg W. Residual complaints of patients two years after severe head injury. J Neurol Neurosurg Psychiatry. 1985;48(1):21–28.
- Allonsius F, van Markus-Doornbosch F, de Kloet A, et al. Fatigue in young patients with acquired brain injury in the rehabilitation setting: categorizing and interpreting fatigue severity levels. Dev Neurorehabil. 2022;25(8):542–553.