
Abstract
Purpose
To investigate the responsiveness and minimal clinically important difference (MCID) of the Functional Independence Measure (FIM) from a clinician’s perspective in hip-fractured elderly undergoing inpatient rehabilitation.
Materials and methods
Data of 701 hip-fractured elderly admitted to our rehabilitation institute were retrospectively collected. Ten a priori hypotheses were formulated.
Results
The effect size of the FIM scores after treatment were large (total = 1.38, motor = 1.78). Moderate correlations were found between the change total score of FIM and Barthel Index (BI, rs = 0.51), Functional Ambulation Categories (FAC, rs = 0.52) and a checklist regarding participants’ independence in transfers (rs = 0.59). The area under the receiving operating characteristics were 0.82, 0.81, and 0.85 when BI, FAC and checklist were used as anchors, respectively. Based on these findings, the FIM showed high responsiveness (9/10 hypotheses met). Triangulation of findings showed that MCIDs of 22 and 21 points were the most appropriate for the FIM total and motor score, respectively.
Conclusions
The FIM scale is appropriate for assessing independence and functional recovery in hip-fractured elderly. Improvements of 22 and 21 points at the total and motor FIM were identified as indicators of minimal clinical change in those admitted to a rehabilitation facility with an FIM total score between 40 and 80.
Implications for Rehabilitation
This study provides evidence of the high responsiveness of the Functional Independence Measure (FIM) total score and of its motor subscore, while the cognitive subscore is not responsive to change among older adults with hip fractures hospitalized for rehabilitation.
After a rehabilitative program, a change of at least 22 points in the FIM total score is clinically important in older adults with hip fractures.
This change scores will be useful for researchers and clinicians in order to determine a possible clinically meaningful improvement in independence as a response to rehabilitation after a hip fracture.
Introduction
Hip fractures are a major cause of hospitalization among older adults and frequently result in a decline of physical functioning and quality of life, loss of independence, and increased risk of mortality [Citation1,Citation2]. Among survivors, a high percentage of individuals who recover from hip fractures do not regain their pre-fracture level of independence [Citation2–4]. Researches show that at 1 year after hip fracture, only 40% of individuals are able to independently perform all activities of daily living (ADLs) [Citation3], while approximately 50% have a walking disability [Citation4] and 33% are totally dependent or in a nursing home [Citation3,Citation5]. Most physical recovery, expressed as the ability to walk and to perform ADLs, occurs in the first 6 months post-fracture, while a substantial decline in the functional ability of hip-fractured individuals 1-year post-discharge from rehabilitation has been reported [Citation6]. Therefore, in order to prevent the loss of functional capacity, rehabilitation appears to be crucial for the functional recovery of older adults with hip fractures. Accordingly, a specific outcome measurement tool for assessing functional status in older patients with hip fractures is needed.
The Functional Independence Measure (FIM) [Citation7] is a tool used worldwide for assessing functional independence in an inpatient rehabilitation context [Citation8–10]. It is composed of 18 items divided into two domains – motor and cognitive – with ordinal rating of the patient’s level of disability and changes in status in response to rehabilitation. The FIM scale has been validated in many neurological or musculoskeletal diseases and showed excellent internal consistency in people with stroke, multiple sclerosis, and spinal injuries, and in heterogeneous rehabilitation inpatients [Citation11–14]. Other psychometric properties have been widely investigated in individuals with stroke [Citation15–17]; however, many properties have still not been investigated in individuals with hip fracture even if this scale is widely used in rehabilitation facilities. In particular, responsiveness, which refers to the extent to which a measurement tool can accurately detect important change over time, and the Minimal Clinically Important Difference (MCID), or the smallest difference in the score that an individual can perceive as beneficial, has never been investigated for hip fracture [Citation18]. The MCID is crucial in rehabilitation since it constitutes a threshold above which a given change in score can be considered as meaningful and worthwhile. In fact, it is a reference point used for judging the magnitude of treatment effects not only in routine clinical practice but also in clinical trials and systematic reviews, facilitating the establishment of treatment recommendations for patients [Citation19,Citation20]. In particular, a threshold value of 22, 17, and 3 for the total FIM, motor FIM, and cognitive FIM, respectively, has been identified as a clinically important difference in people with stroke [Citation17].
Responsiveness is usually assessed with distribution-based and/or anchor-based methods [Citation21]. Effect size (ES) and other similar statistical measures are commonly used as distribution-based approaches, expressing an effect in terms of the underlying distribution of results; they are simple to use and provide information about the overall ability of a measure to chart the clinical course of a condition. Conversely, anchor-based approaches are based on the assessment of the receiving operating characteristic (ROC) curves created with the use of an external criterion [Citation22]. Similar to responsiveness, the MCID can be determined with both distribution-based and anchor-based methods. Although there is no gold-standard methodology to determine MCID values, proposed tools, and consensus approaches to support the use of anchor-based over distribution-based methods [Citation20,Citation23].
Guidelines usually recommend the use of patient-reported outcome measures as an anchor for assessing the anchor-based methods responsiveness and MCID [Citation18]. Nevertheless, as the participants of our study were older adults – an age group known to be prone to cognitive impairments [Citation24] – the use of patient-reported outcome measures would have led to the exclusion of a large part of the sample. Therefore, we decided to use as anchors the Barthel Index (BI), the Functional Ambulation Categories (FAC) score and a checklist regarding the individual’s independence in performing transfers, in order to investigate the responsiveness and the MCID of the FIM total score from a clinician’s perspective in older individuals with a diagnosis of hip fracture undergoing inpatient rehabilitation after surgery.
Methods
This retrospective study was based on data of individuals with a diagnosis of femur fracture (ICD-9 classification) consecutively admitted to the Istituti Clinici Scientifici Maugeri, IRCCS, Scientific Institute of Veruno (Italy), Division of Physical Medicine and Rehabilitation, between June 2018 and April 2020. Criteria for inclusion in the study were age ≥65 years and diagnosis of hip fracture (AO/OTA classification 31) surgically treated. Exclusion criteria were: diagnosis of femur fracture of the diaphysis and of distal end segment (AO/OTA classification 32 and 33) documented contraindication to mobilization, isolation due to infection, length of hospital stay >60 d due to clinical complications, transfer to another hospital because of clinical problems, or death. The Institutional Review Board approved the study, which complied with the Declaration of Helsinki.
All data collected at admission and discharge were obtained from medical records since they were part of routine care data collection. Data included age, sex, body mass index (BMI), diagnosis, type and side of the fracture, type of surgery, date of injury and of surgery, and date of admission and discharge from the rehabilitative clinic. The outcome measures used to assess participants at admission and at discharge were the BI and FIM. Moreover, at the time of discharge, the physical therapist assessed walking abilities with the FAC score and independence in performing the transfers through a checklist question.
The FIM scale was used to assess the level of independence and need of assistance in performing the basic ADLs during the rehabilitation period [Citation25]. It was administered at admission and discharge by a trained physical therapist. The FIM scale is an 18-item ordinal scale with each item scored from 1 (total dependence) to 7 (total independence), giving a total score range from 18 to 126. The scale can be subdivided into a 13-item motor subscale and a 5-item cognitive subscale, whose subscore score range from 13 to 91 and from 5 to 35, respectively. Tasks assessed with the FIM include sphincter control, transfers, locomotion, communication, social cognition, and the following six self-care activities: grooming, bathing, feeding, upper-body dressing, lower-body dressing, and toileting.
The BI is a 10-item scale measuring mobility and functional status. It was administered by the nurses at admission and discharge. The total score ranges from 0 to 100, with 100 indicating no problems with feeding and continence, normal mobility, and ADLs independence. The MCID of BI is reported to be 7.1 points [Citation26] in patients with hip fracture during rehabilitation.
The FAC is a 6-point scale ranging from 0 to 5 that evaluates the ambulation status by determining how much assistance the patient requires when walking [Citation27].
Finally, a checklist question was used for assessing the independence of individuals in performing the transfer from chair to bed and from chair to toilet, and vice versa. The physical therapist ticked “yes” if the individual was able to perform the task without assistance -supervision allowed-, “no” if he/she was not.
Rehabilitation program
On day 1 after admission, all participants commenced an individualized program of rehabilitation specific for hip fracture administered by physical therapists. It consisted in about 300 min/week (60 min/d, 5–6 times/week) of motor rehabilitation based on exercises for hip range of motion, muscle strength, balance, coordination, ADLs, gait activities, and climbing stairs, together with education on safety and on how to use assistive devices. The course of the rehabilitation program was tailored based on the patient’s identified abilities.
Statistical analysis
Responsiveness and MCID were primarily assessed for the FIM total score; nevertheless, the same statistical analyses were also conducted on its sub-scores – the motor and the cognitive. All statistical analyses were carried out with STATA 13.
Responsiveness to change of the FIM was assessed according to the recommendations of the COSMIN (COnsensus-based Standards for the selection of health Measurement INstruments) guidelines [Citation28]. We postulated 10 a priori hypotheses (), regarding both distribution-based and anchor-based methods concerning expected ES, expected correlations between the outcome measures and areas under the ROC curve (AUC). Responsiveness was adjudicated as high when ≥75% of the a priori hypotheses were met, moderate when 50–75% were met and low when <50% were met [Citation28].
Table 1. Hypotheses formulated a priori to assess the responsiveness of the FIM scale in older adults with hip fracture.
Regarding the distribution-based methods, we considered the paired-sample t-test between admission and discharge outcome measures and the magnitude of the effect of the treatment, as evaluated with Cohen’s d ES. Values of ES = 0.2 represent small differences, around 0.5 moderate, and ≥0.8 large [Citation31]. If a score – or sub-score – showed an ES < 0.2, suggesting that the difference between admission and discharge was negligible, it was not considered for the following analysis.
Responsiveness was also tested with anchor-based methods by measuring (1) the correlations between the outcome measures and (2) the AUCs for the ROC curve. First, correlations between the FIM scores and the BI (both baseline and change scores), the FAC score and the checklist at discharge were assessed by calculating the Spearman’s correlation coefficients (rs). A correlation <0.10 was considered as negligible, 0.10 ≤ 0.39 weak, 0.40 ≤ 0.69 moderate, 0.70 ≤ 0.89 strong and 0.90 ≤ 1.0 very strong [Citation32]. Second, the AUCs for the ROC curves were calculated [Citation33]. An AUC of 0.90-1.00 indicates high accuracy, 0.70–0.89 moderate, 0.50–0.69 low, and <0.50 a chance result [Citation34].
As suggested by the literature [Citation18,Citation35], we estimated the MCID considering both distribution-based and anchor-based methods and then triangulating their results [Citation18]. Among the distribution-based methods, first, we used the Cohen ES benchmark, for which Norman et al. [Citation36] suggest the formula of 0.5*SD of the FIM total and motor score at admission as a small but important change for the intervention effectiveness. In addition, we calculated the standard error of measurement (SEM) of both total and motor scores with the following formula: SEM = SD × √(1 − rtest–retest), where rtest–retest was the test–retest reliability of the FIM scale. Based on a previous review, the rtest–retest was equal to 0.95, 0.97, and 0.93, respectively for the total, motor, and cognitive scores [Citation15]. The SEM was used for calculating the minimum detectable change (MDC), as follows: MDC = SEM × z-value × 2, where the z-value was 1.96, so corresponding to a 95% C.I. of the MDC. The MDC is the smallest change in score that probably reflects a true change (not simply a measurement error), so a valid MCID should then be at least as large as the observed MDC [Citation37,Citation38].
For the anchor-based methods, the MCID was estimated by comparing the change score of the FIM with an external anchor. If their correlation with the FIM score was at least moderate (≥0.40), we used the MCID of the BI [Citation26], the FAC score and the transfers’ checklist question as external anchors. Participants were split as “non-functional ambulators” or “functional ambulators” if they obtained a FAC score <3 or ≥3, respectively, while those ticked as “yes” at the checklist question for transfers were classified as “independent”, “no” as “not-independent”.
Since different estimators can yield different MCIDs from the investigation of the ROC curve, we estimated the MCID for each anchor according to Froud and Abel [Citation39] and using, therefore, the STATA command “rocmic” with the bootstrap method to estimate their 95% C.I.
The use of multiple methods could result in a range of MCID values, therefore MCIDs are recommended to be triangulated to converge them on a small range of values or on a single value [Citation18]. Triangulation integrates results from different approaches and it corresponds to the calculation of the arithmetic mean of the MCIDs [Citation18,Citation40,Citation41]. As recommended, the anchor-based results should have a higher weight than that of the distribution-based method during the triangulation analysis. We therefore plotted and triangulated the MCIDs and 95% C.I. obtained from the anchor- and distribution-based methods.
Results
Of 868 individuals admitted with the diagnosis of femur fracture screened for the study, 167 (19%) did not meet the inclusion criteria and were excluded; the remaining 701 participants constituted the final study population. The clinical characteristics of participants are reported in .
Table 2. Clinical characteristics of older adults with hip fracture included in the study (n = 701).
Responsiveness
The mean (SD) improvement at the discharge of the FIM total score and its sub-scores – motor and cognitive – was 24.2 (11.8) points (p < 0.001), 23.3 (11.3) points (p < 0.001) and 0.9 (2.1) points (p < 0.005), respectively. The ES were: 1.39 (95% C.I. = 1.30–1.48, p < 0.001) for the total score, 1.78 (95% C.I. = 1.67–1.88, p < 0.001) for motor score and 0.16 (95% C.I. = 0.13–0.18, p < 0.001) for the cognitive score. Due to the small change and ES of the cognitive score, only the total and motor scores were considered in the following analysis.
The ES of the BI was 1.35 (95% C.I. = 1.25–1.45, p < 0.001), with a change in score between admission and discharge of 23.4 (15.1) points (p < 0.001). Based on the MCID of the BI, 116 (16.5%) participants out of 701 were classified as non-improved, while 585 (83.5%) as improved. The non-improved participants showed a mean (SD) improvement of FIM total and motor score of 13.0 (9.4) and 12.2 (8.9) points, respectively, while the improved ones increased their total and motor FIM scores 25.5 (10.9) and 25.5 (10.5) points, respectively, (p < 0.001).
Considering the score of 3 as a cut-off for the FAC score [Citation42], the 272 individuals classified as “non-functional ambulators” at discharge showed a mean increase in total and motor FIM scores of 16.8 (10.8) and 15.9 (9.8) points, respectively, while those classified as “functional ambulators” improved their scores of 29.2 (9.5) and 28.3 (9.2) points, respectively.
Finally, based on the checklist, independence in performing transfers at discharge was not achieved for 306 (43.6%), with a mean improvement at the FIM total and motor score of 16.7 (9.7) points and 30.4 (9.3), respectively. Conversely, 395 (56.4%) participants were able to independently perform the transfers showing a greater improvement in both total (15.8 (9.0)) and motor (19.9 (13.5)) FIM scores (p < 0.001 for both scores).
The correlations between the FIM scores and the BI change scores were moderate (rs = 0.51, 95% C.I. = 0.46–0.57 for a total score, rs = 0.53, 95% C.I. = 0.48–0.58 for motor score). Correlations of both the FAC score and the checklist question with the FIM change scores were all moderate: rs = 0.52 (95% C.I. = 0.47–0.58) between FAC and FIM total score, rs = 0.59 (95% C.I. = 0.55–0.64) for checklist and FIM total score, rs = 0.54 (95% C.I. = 0.49–0.60) between FAC and FIM motor score and rs = 0.62 (95% C.I. = 0.57–0.67) for checklist and FIM motor score.
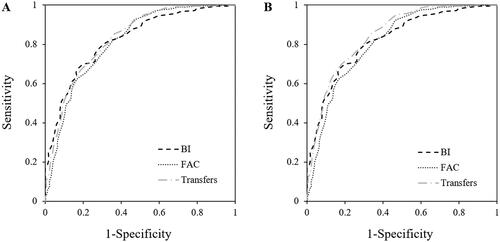
We calculated the ROC curve of the FIM total and motor scores considering the achievement or not of the MCID at the BI, the walking ability as assessed with the FAC score and the independence at the checklist question as anchors. reported the AUC results. All AUCs, separately calculated with the three anchors, showed values higher than the cut-off of 0.70 for both the total () and the motor () FIM scores, indicating a moderate ability of the FIM scale in discriminating those independent or not.
Figure 1. ROC curves of the FIM total (A) and motor (B) score considering the MCID of the BI, the FAC score, and the checklist question as anchors. ROC shows the overall accuracy of the FIM in identifying an improvement in the level of independence in individuals with hip fracture according to the three anchors. (A) For the total score, the AUCs (95% C.I.) were 0.82 (0.78 − 0.86) when the MCID of the BI was used as an anchor, 0.81 (0.78 − 0.85) when cut-off of 3 of the FAC score was the anchor, 0.85 (0.81 − 0.87) for the checklist on independence in performing transfers. (B) For the motor score, the AUCs (95% C.I.) were 0.83 (0.79 − 0.87) when the MCID of the BI was used as an anchor, 0.82 (0.79 − 0.85) when cut-off of 3 of the FAC score was used, 0.86 (0.83 − 0.89) for the checklist on independence in performing transfers.
Based on previous findings, 9/10 (90%) a priori hypotheses were confirmed, indicating high responsiveness of the FIM scale.
Minimal clinically important difference
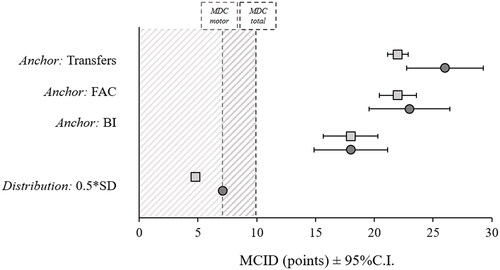
The MCID estimations, derived from both the anchor-based and distribution-based methods, are shown in and in Supplementary Material. The distribution-based MCID estimation expressed as 0.5*SD of the FIM total score at admission was 7.1 points, while for the motor score was 4.8 points. All the anchors showed a correlation with the FIM change scores ≥0.40, they were all used for the MCID estimation (). Since the MCIDs calculated with the distribution-based method were lower than the values of 10.3 and 7.7, corresponding to the MDCs of total and motor scores, they were not considered for the following estimation of the MCID. Triangulation of anchor-based findings showed that a MCID of 22.3 for the FIM total score and a MCID of 20.7 for the FIM motor score were the most appropriate. Since the FIM scale is composed of integer values, the MCIDs was therefore finally identified with the value of 22 and 21, respectively.
Figure 2. MCID for the FIM total and motor score using both anchors- and distribution-based methods. The dark grey circles represent the MCID of the FIM total score, while the light grey square the MCID of the FIM motor score. The dark and light grey dashed lines represent the minimum detectable change (MDC) of the total (10.3 points) and the motor (7.7 points) FIM score, respectively.
According to these MCID values, about 58% of individuals with hip fracture achieved a clinically important difference at the end of the rehabilitative program. In particular, these patients showed the highest improvement in those items much strictly related to the rehabilitative program, such as transferring to the toilet or to bed/chair/wheelchair and locomotion.
Moreover, only 30% of those who were not discharged home achieved the MCIDs of both total and motor scores, while about the 60% of those discharged home showed a clinical improvement.
Discussion
To our knowledge, despite there is the widespread use of the FIM scale in clinical practice to assess the independence of individuals with hip fracture during inpatient rehabilitation, this is the first study which specifically investigate the responsiveness and the MCID of the FIM scale in this population. Our results showed that both the total FIM scale and its motor subscore are highly responsive to change. Moreover, the MCIDs of 22 and 21, respectively for the total and motor FIM, identified in the present study might help clinicians and researchers to determine whether change scores indicate clinical improvement after an intervention.
Responsiveness
Our study assessed the responsiveness of the FIM scale using the COSMIN framework. Overall, 9 of the 10 (90%) a priori hypotheses were confirmed, suggesting that the FIM scale is highly responsive.
The improvement in functional abilities observed in our participants at discharge from the rehabilitation facility was similar to that found in other studies on individuals with hip fracture undergoing inpatient rehabilitation [Citation43,Citation44]. The mean increase in the FIM total score was similar to that obtained in the motor FIM score; thus, it suggests that FIM gain may be mostly explained by an increase in the motor score instead of in the cognitive one, whose change was only minimal. As ours, many other studies investigating the effects of rehabilitation on hip-fractured older adults reported only small improvements in the cognitive sub-score, with a mean increase <1 point, which corresponds to about 2% of the cognitive total score [Citation45,Citation46]. Therefore, due to this small change during rehabilitation and to the very small ES, the responsiveness and MCID of the cognitive FIM score were not assessed.
Both the FIM total and motor scores and the BI demonstrated large ESs from rehabilitation admission to discharge in individuals with hip fracture. The ES of the total FIM of our treatment was similar to the value found in a heterogeneous sample of individuals with orthopedic and neurological diseases and other disabling impairments [Citation29]. Conversely, the value of ES of the BI was lower than the value of 2.12 reported in the literature for individuals with hip fracture [Citation47]. However, while Unnanuntana et al. [Citation47] included in their study only people with femoral neck fracture surgically treated with hemiarthroplasty, in our study we included individuals with both neck and intertrochanteric fracture surgically treated. It is well known that the type of hip fracture can affect the length of stay and the recovery of functional outcome, i.e., people with intertrochanteric fracture have a lower FIM efficiency than others [Citation48–50].
Overall, the ESs we found for FIM and BI scores were similar, suggesting that both are good scales for assessing the functional outcome in performing ADLs. Nevertheless, when considering the BI as an anchor, we found only a moderate correlation with the FIM. Even if both scales evaluate similar items of functional independence, in our study the FIM was administered by physical therapists, while the BI was administered by nurses. The different professional figures and the different settings in which individuals were evaluated may have affected the administration of the scales, resulting in a moderate correlation between the change score of these two scales. The correlation between the FIM and the BI seems to be influenced by the composition of the team administering these scales. In fact, lower values of correlation have been reported when the two scales were rated by a multidisciplinary team, than when they were administered by the same health professional figures [Citation16,Citation30].
Finally, both the FAC score and checklist question of transfers measure similar underlying constructs of the FIM, i.e., independence, and showed an acceptable correlation, suggesting the appropriate use of these tools as anchor [Citation20,Citation51].
Minimal clinically important difference
Despite the widespread use of the FIM, the MCID of the FIM total and motor scores have previously been assessed only in individuals with stroke [Citation17], where they were found to be 22 and 17 points, respectively. The MCID of the FIM total score found in our study for individuals with hip fracture was the same of that reported by Beninato et al. [Citation17], while it was greater for the motor score − 21 points. Overall, a change of 22 points represents a variation of 17.5% for the FIM scale, whose maximum total score is 126. Even if there is no agreement, some studies have suggested that, for clinical measures, the change in the score which identifies a reasonable indicator of minimal change should be between 1% and 20% or between 6% and 10% [Citation18,Citation52,Citation53].
While general guidelines usually recommend a patient-reported outcome measure as the anchor, we used the BI, the FAC score and a checklist completed by the therapists. As reported in the literature, about 19% of all older individuals with hip fractures have dementia and up to 40% have some form of cognitive impairment, i.e., dementia, delirium, mild cognitive impairment, or other postoperative cognitive decline [Citation24]. Cognitive impairment is generally defined according to a standard cutoff, and the one most used is the cut-off of 24 on the Mini-Mental State Evaluation (MMSE) [Citation54]. Although there is not a cut-off of the FIM cognitive subscale for identifying individuals with cognitive impairment, many authors have reported a very high correlation between this scale and the MMSE scale [Citation55,Citation56], with the MMSE score of 24 corresponding to about 29 at the FIM cognitive score [Citation55]. Considering this value, about 38% of individuals recruited in our study could have some form of cognitive impairment, which could affect their ability to estimate a subjective improvement with a patient-reported outcome measure. Hence, the exclusion of this large portion of individuals would have altered the findings regarding responsiveness and MCID of the FIM and the resulting sample would not have been representative of older adults commonly referred to a rehabilitation service following a hip fracture.
Even if patient-reported anchors are more desirable, when individuals cannot directly provide information to inform the outcome, clinical measures or those that are assessed by a clinician are allowed as an anchor for the MCID determination [Citation20]. Therefore, in our study, we considered the BI, the FAC score, and the checklist as external anchors which were performed by different healthcare professionals (nurses and physical therapists, respectively). For an anchor to be suitable, it should be easily understandable, highly relevant to participants and should have a moderate-to-high correlation with the measure in the examination, in our case the FIM. The improvement in BI or the achievement of independence in walking or in the performance of transfers were not only moderately correlated with the FIM change score but also relevant for the independence of individuals after discharge from the rehabilitative institute.
Conversely, the MCIDs estimated with the distribution-based methods were not finally considered in the triangulation of results. As previously stated, a valid MCID should then be at least as large as the observed MDC [Citation37,Citation38]. In our results, the MCIDs calculated according to distribution-based methods were smaller with respect to the MDC. The approach used (0.5*SD) gave a small value of MCID for both FIM scores, probably because our sample was large (n = 701) and with a small variability of the FIM at admission. In fact, one of the limits of these approaches is the fact that they are sample-specific in the sense that the MCID value depends on the variability of the scores of the sample considered [Citation38].
It is well known that FIM total score, between 30 and 80 points, behaves like a continuous scale characterized by equal intervals [Citation57]. Continuous scale users can be confident that changes in patient function can be interpreted in the light of the same MCID. As 85% of patients with hip fractures admitted to our rehabilitation facility ranged between 40 and 80 of FIM total score, we believe that in this range, in which patients require maximum to moderate care [Citation58], our MCIDs can be considered valid for judging the magnitude of treatment effects. On the contrary, our results do not allow to interpret gains at the bottom and top end of FIM or in fragile individuals with hip fractures.
Study limitation
As previously discussed, one of the limitations of our study could be the absence of a patient-reported outcome measure as an anchor for assessing the MCID. Therefore, our estimated MCID could better reflect the clinical perspective or the needs of the healthcare system than the patient’s expectations [Citation59]. The estimate of MCID is context-specific, and thus it may vary according to methods, anchor, and sample characteristics [Citation60]. The values found in this study were specific for individuals with hip fracture admitted to a rehabilitation facility with a baseline FIM total score between 40 and 80. Moreover, even if easily to assess for physical therapists, the checklist question regarding the independence in performing the transfers which was used for assessing the ROC curve has not been validated yet. Finally, even if the sample of patients enrolled was large, the retrospective nature of this study was a limitation.
Conclusions
In individuals with recent hip fracture admitted to a rehabilitation clinic, the FIM is an appropriate scale for assessing independence and functional recovery in ADLs. It showed high responsiveness and was able to differentiate between independent and non-independent individuals. An improvement of 22 and 21 points at the time of discharge was identified as an indicator of minimal clinical improvement of the functional independence of FIM total and motor score, respectively, in older adults with hip fracture. We recommend taking this estimated MCID into account when assessing improvement or planning clinical studies on similar individuals with hip fracture admitted to a rehabilitation facility with a baseline FIM total score between 40 and 80.
Ethical approval
This study protocol was approved by the Internal Advisory Board of Istituti Clinici Scientifici Maugeri, IRCCS. This was a retrospective study, and only medical records were analyzed. All procedures involving human participants were performed in accordance with the Declaration of Helsinki and its later amendments. The need to obtain participants’ consent was waived by the Internal Advisory Board due to the retrospective and observational nature of the study.
Supplemental Material
Download MS Word (15.4 KB)Disclosure statement
No potential conflict of interest was reported by the author(s).
Data availability statement
The data that support the findings of this study are available from the corresponding author, MG, upon reasonable request.
Additional information
Funding
References
- Haentjens P, Magaziner J, Colón-Emeric CS, et al. Meta-analysis: excess mortality after hip fracture among older women and men. Ann Intern Med. 2010;152(6):380–390.
- Dyer SM, Crotty M, Fairhall N, et al. A critical review of the long-term disability outcomes following hip fracture. BMC Geriatr. 2016;16(1):158.
- Magaziner J, Simonsick EM, Kashner TM, et al. Predictors of functional recovery one year following hospital discharge for hip fracture: a prospective study. J Gerontol. 1990;45(3):M101–M107.
- Magaziner J, Fredman L, Hawkes W, et al. Changes in functional status attributable to hip fracture: a comparison of hip fracture patients to community-dwelling aged. Am J Epidemiol. 2003;157(11):1023–1031.
- Leibson CL, Tosteson AN, Gabriel SE, et al. Mortality, disability, and nursing home use for persons with and without hip fracture: a population-based study. J Am Geriatr Soc. 2002;50(10):1644–1650.
- Hershkovitz A, Pulatov I, Brill S, et al. Can hip-fractured elderly patients maintain their rehabilitation achievements after 1 year? Disabil Rehabil. 2012;34(4):304–310.
- Keith RA, Granger CV, Hamilton BB, et al. The functional independence measure: a new tool for rehabilitation. Adv Clin Rehabil. 1987;1:6–18.
- Haigh R, Tennant A, Biering-Sørensen F, et al. The use of outcome measures in physical medicine and rehabilitation within Europe. J Rehabil Med. 2001;33(6):273–278.
- Canadian Institute for Health Information. National rehabilitation reporting system PIA; 2015 Sep. [cited 2021 Oct 15]. Available from: https://www.cihi.ca/sites/default/files/document/nrs-pia-en.pdf
- Ministero della Salute. Evoluzione del sistema DRG nazionale. 2007 [cited 2021 Sep 29]. Available from: https://www.salute.gov.it/imgs/C_22_AttivitaMattoni_20_documenti_documento_2_fileAllegato.pdf
- Dodds TA, Martin DP, Stolov WC, et al. A validation of the functional independence measurement and its performance among rehabilitation inpatients. Arch Phys Med Rehabil. 1993;74(5):531–536.
- Sharrack B, Hughes RA, Soudain S, et al. The psychometric properties of clinical rating scales used in multiple sclerosis. Brain. 1999;122(1):141–159.
- Hobart JC, Lamping DL, Freeman JA, et al. Evidence-based measurement: which disability scale for neurologic rehabilitation? Neurology. 2001;57(4):639–644.
- Küçükdeveci AA, Yavuzer G, Elhan AH, et al. Adaptation of the functional independence measure for use in Turkey. Clin Rehabil. 2001;15(3):311–319.
- Ottenbacher KJ, Hsu Y, Granger CV, et al. The reliability of the functional independence measure: a quantitative review. Arch Phys Med Rehabil. 1996;77(12):1226–1232.
- Hsueh IP, Lin JH, Jeng JS, et al. Comparison of the psychometric characteristics of the functional independence measure, 5 item barthel index, and 10 item barthel index in patients with stroke. J Neurol Neurosurg Psychiatry. 2002;73(2):188–190.
- Beninato M, Gill-Body KM, Salles S, et al. Determination of the minimal clinically important difference in the FIM instrument in patients with stroke. Arch Phys Med Rehabil. 2006;87(1):32–39.
- Revicki D, Hays RD, Cella D, et al. Recommended methods for determining responsiveness and minimally important differences for patient-reported outcomes. J Clin Epidemiol. 2008;61(2):102–109.
- Rai SK, Yazdany J, Fortin PR, et al. Approaches for estimating minimal clinically important differences in systemic lupus erythematosus. Arthritis Res Ther. 2015;17(1):143.
- Devji T, Carrasco-Labra A, Qasim A, et al. Evaluating the credibility of anchor based estimates of minimal important differences for patient reported outcomes: instrument development and reliability study. BMJ. 2020;369:m1714.
- Guyatt GH, Osoba D, Wu AW, et al. Methods to explain the clinical significance of health status measures. Mayo Clin Proc. 2002;77(4):371–383.
- Turner D, Schünemann HJ, Griffith LE, et al. The minimal detectable change cannot reliably replace the minimal important difference. J Clin Epidemiol. 2010;63(1):28–36.
- McGlothlin AE, Lewis RJ. Minimal clinically important difference: defining what really matters to patients. JAMA. 2014;312(13):1342–1343.
- Seitz DP, Adunuri N, Gill SS, et al. Prevalence of dementia and cognitive impairment among older adults with hip fractures. J Am Med Dir Assoc. 2011;12(8):556–564.
- Tesio L, Granger CV, Perucca L, et al. The FIM instrument in the United States and Italy: a comparative study. Am J Phys Med Rehabil. 2002;81(3):168–176.
- de Morton NA, Harding KE, Taylor NF, et al. Validity of the de morton mobility index (DEMMI) for measuring the mobility of patients with hip fracture during rehabilitation. Disabil Rehabil. 2013;35(4):325–333.
- Holden MK, Gill KM, Magliozzi MR, et al. Clinical gait assessment in the neurologically impaired: reliability and meaningfulness. Phys Ther. 1984;64(1):35–40.
- de Vet HC, Terwee CB, Mokkink LB, et al. Measurement in medicine: a practical guide. New York (NY): Cambridge University Press; 2011.
- Darzins SW, Imms C, Shields N, et al. Responsiveness, construct and criterion validity of the personal care-participation assessment and resource tool (PC-PART). Health Qual Life Outcomes. 2015;13:125.
- Houlden H, Edwards M, McNeil J, et al. Use of the barthel index and the functional independence measure during early inpatient rehabilitation after single incident brain injury. Clin Rehabil. 2006;20(2):153–159.
- Cohen J. Statistical power analysis for the behavioral sciences. 2nd ed. New York (NY): Routledge Academic; 1988.
- Schober P, Boer C, Schwarte LA. Correlation coefficients: appropriate use and interpretation. Anesth Analg. 2018;126(5):1763–1768.
- Deyo R, Centor RM. Assessing the responsiveness of functional scales to clinical change: an analogy to diagnostic test performance. J Chronic Dis. 1986;39(11):897–906.
- Akobeng AK. Understanding diagnostic tests 3: receiver operating characteristic curves. Acta Paediatr. 2007;96(5):644–647.
- Hays RD, Woolley JM. The concept of clinically meaningful difference in health-related quality-of-life research. How meaningful is it? Pharmacoeconomics. 2000;18(5):419–423.
- Norman GR, Sloan JA, Wyrwich KW. Interpretation of changes in health-related quality of life: the remarkable universality of half a standard deviation. Med Care. 2003;41(5):582–592.
- Beaton DE. Understanding the relevance of measured change through studies of responsiveness. Spine. 2000;25(24):3192–3199.
- Copay AG, Subach BR, Glassman SD, et al. Understanding the minimum clinically important difference: a review of concepts and methods. Spine J. 2007;7(5):541–546.
- Froud R, Abel G. Using ROC curves to choose minimally important change thresholds when sensitivity and specificity are valued equally: the forgotten lesson of pythagoras. Theoretical considerations and an example application of change in health status. PLOS One. 2014;9(12):e114468.
- Alma H, de Jong C, Tsiligianni I, et al. Clinically relevant differences in COPD health status: systematic review and triangulation. Eur Respir J. 2018;52(3):1800412.
- Malec JF, Ketchum JM. A standard method for determining the minimal clinically important difference for rehabilitation measures. Arch Phys Med Rehabil. 2020;101(6):1090–1094.
- Baetens T, De Kegel A, Calders P, et al. Prediction of falling among stroke patients in rehabilitation. J Rehabil Med. 2011;43(10):876–883.
- Wang CY, Graham JE, Karmarkar AM, et al. FIM motor scores for classifying community discharge after inpatient rehabilitation for hip fracture. Pm R. 2014;6(6):493–497.
- Gialanella B, Santoro R, Prometti P, et al. Functional recovery in hip fracture patients: the role of pharmacotherapy. Aging Clin Exp Res. 2020;32(1):49–57.
- Adunsky A, Fleissig Y, Levenkrohn S, et al. A comparative study of mini-mental test, clock drawing task and cognitive-FIM in evaluating functional outcome of elderly hip fracture patients. Clin Rehabil. 2002;16(4):414–419.
- Adunsky A, Lusky A, Arad M, et al. A comparative study of rehabilitation outcomes of elderly hip fracture patients: the advantage of a comprehensive orthogeriatric approach. J Gerontol A Biol Sci Med Sci. 2003;58(6):542–547.
- Unnanuntana A, Jarusriwanna A, Nepal S. Validity and responsiveness of barthel index for measuring functional recovery after hemiarthroplasty for femoral neck fracture. Arch Orthop Trauma Surg. 2018;138(12):1671–1677.
- Kristensen MT. Factors affecting functional prognosis of patients with hip fracture. Eur J Phys Rehabil Med. 2011;47(2):257–264.
- Arcolin I, Godi M, Giardini M, et al. Does the type of hip fracture affect functional recovery in elderly patients undergoing inpatient rehabilitation? Injury. 2021;52(8):2373–2378.
- Hershkovitz A, Frenkel Rutenberg T. Are extracapsular and intracapsular hip-fracture patients two distinct rehabilitation subpopulations? Disabil Rehabil. 2021;13:1–6.
- Guyatt GH, Norman GR, Juniper EF, et al. A critical look at transition ratings. J Clin Epidemiol. 2002;55:900–908.
- Kosinski M, Zhao SZ, Dedhiya S, et al. Determining the minimally important changes in generic and disease-specific health-related quality of life questionnaires in clinical trials of rheumatoid arthritis. Arthritis Rheum. 2000;43:1478–1487.
- Angst F, Aeschlimann A, Angst J. The minimal clinically important difference raised the significance of outcome effects above the statistical level, with methodological implications for future studies. J Clin Epidemiol. 2017;82:128–136.
- Folstein MF, Folstein SE, McHugh PR. “Mini-mental state”. A practical method for grading the cognitive state of patients for the clinician. J Psychiatr Res. 1975;12:189–198.
- Heruti RJ, Lusky A, Barell V, et al. Cognitive status at admission: does it affect the rehabilitation outcome of elderly patients with hip fracture? Arch Phys Med Rehabil. 1999;80(4):432–436.
- Zwecker M, Levenkrohn S, Fleisig Y, et al. Mini-mental state examination, cognitive FIM instrument, and the loewenstein occupational therapy cognitive assessment: relation to functional outcome of stroke patients. Arch Phys Med Rehabil. 2002;83(3):342–345.
- Nilsson AL, Sunnerhagen KS, Grimby G. Scoring alternatives for FIM in neurological disorders applying rasch analysis. Acta Neurol Scand. 2005;111(4):264–273.
- Uniform Data System for Medical Rehabilitation. The FIM® instrument: its background, structure, and usefulness. Buffalo (NY): UDSMR; 2012 [cited 2020 November 04]. Available from: www.udsmr.org/Documents/The_FIM_Instrument_Background_Structure_and_Usefulness.pdf
- Beaton DE, Boers M, Wells GA. Many faces of the minimal clinically important difference (MCID): a literature review and directions for future research. Curr Opin Rheumatol. 2002;14(2):109–114.
- Wang YC, Hart DL, Stratford PW, et al. Baseline dependency of minimal clinically important improvement. Phys Ther. 2011;91(5):675–688.