
Abstract
Purpose: The world is approaching the sustainable development goals deadline, but many countries still do not produce the data required to track their indicators by disability. Integrating valid and relievable disability measurement tools into existing data platforms is key to ensuring that “no one is left behind.” In this paper, we aim to demonstrate that it is possible to gather valid data on disability for disaggregation using the WHO Functioning and Disability Disaggregation Tool.Materials and methods: Using representative data from India, Lao PDR, and Tajikistan collected through the Gallup World Poll, we estimated the likelihood of a positive sustainable development indicator by disability level. Logit regression was used, adjusted for age, sex, household size, number of children, marital status, urban or rural area, and country-fixed effects.Results: Our estimates showed a consistent disability gradient across all countries and indicators: the higher the level of disability, the lower the probability of having a positive outcome in barely any sustainable development goal.Conclusion: Our study demonstrates that it is not too late to generate sound and precise data about inequalities faced by persons with mild, moderate, or severe disability. This data is essential for reducing inequalities through evidence-based policymaking.
IMPLICATIONS FOR REHABILITATION
The disability gradient observed across all countries and indicators included in this study showed that the higher the level of disability (mild, moderate, or severe), the lower the probability of having a positive outcome in any sustainable development goal.
An underestimation of inequalities is observed when people with no, mild and moderate disability are combined into a group called “no severe disability” and used as the comparator to people with “severe disability.”
Rehabilitation policy and planning must consider the disability gradient and respond to the different needs of persons with mild, moderate, and severe disability.
Introduction
The world is now six years from the deadline to achieve the ambitious goals set out in the agenda for sustainable development. The 2030 United Nations (UN) Sustainable Development Goals (SDGs) were adopted in 2015 as a universal call to action to end poverty, protect the planet, and guarantee that by 2030 all people enjoy peace, good health, well-being, and prosperity. To monitor inequalities and ensure that “no one is left behind,” the agenda affirms that data needs to be disaggregated by age, gender, income, ethnicity, race, geographic location, and other characteristics [Citation1]. Yet disaggregation is also needed to monitor inequalities affecting more than 1.3 billion persons experiencing disability worldwide. Disparities between persons with disability and the general population, such as education or employment, can be identified and quantified using disaggregating data by disability for the key SDG indicators [Citation2]. Disaggregating data by disability will also help countries develop evidence-based policies to monitor the implementation of the Convention on the Rights of Persons with Disabilities (CRPD), measure progress toward national targets, and take stock of the remaining challenges. Finally, disability rights advocates can use this evidence to raise awareness, generate support, and advocate for policies that more fully include persons with disability in society [Citation3].
Despite its importance and the efforts of disability advocates, many countries still do not produce the data required to track the implementation of the SDGs for persons with disability. While many countries do not collect data on disability at all, countries that do so frequently collect disability information using various tools and definitions, making cross-country comparisons difficult [Citation4]. Despite the significant bias potential, some countries still collect information on disability by using single questions such as “Do you have a disability?” while others use a medical diagnosis. Nevertheless, some countries use what is commonly agreed to be the gold standard by assessing disability in terms of the extent of functioning limitations in selected functioning domains [Citation5]. Even when disability data is collected, it is often not disaggregated in an accessible manner. For example, since the beginning of the COVID-19 pandemic, the United Kingdom (UK) has been the only country to report accessible COVID-19 health data disaggregated by disability, which has revealed an increased mortality among persons with disability compared to the rest of the population [Citation6]. In short, whether the data is not collected at all, inappropriately collected, or not disaggregated, as a recent UN SDG report [Citation7] has argued, the absence and quality of sound disaggregated data by disability has limited the global understanding of the discrimination and exclusion that persons with disability experience. Last but not least, the lack of adequate data may also have contributed to a lack of political will to address the inequalities persons with disability face.
If scientifically sound disaggregation tools are integrated into existing data collection platforms, it would be possible to identify the most vulnerable groups to ensure that policies work toward no-one is left behind the SDGs agenda. Nevertheless, it is essential such tools are brief and easy to use to be integrated as modules into existing routine health and household surveys, as well as valid and reliable. It is also crucial that the data collection platforms offer various indicators to which disaggregation by disability can be applied. For example, the European Commission statistical offices (EUROSTAT) use disaggregated disability data for indicators such as healthcare use, poverty, social inclusion, and living conditions collected in the European Health Interview Survey (EHIS). Another good example is the Gallup World Poll, which regularly surveys people in over 160 countries, representing more than 99% of the world’s population aged 15 years and older, using randomly selected, nationally representative samples [Citation8].
The recently developed World Health Organization’s (WHO) Functioning and Disability Disaggregation Tool (FDD11) is a brief tool that makes it possible to easily and validly allocate respondents to four groups experiencing different levels of disability: persons with no, mild, moderate, and severe disability. This allocation approach is consistent with the concepts of functioning and disability introduced in the WHO International Classification of Functioning, Disability and Health (ICF) [Citation5]. Adding the FDD11 to existing surveys is considerably less costly than conducting dedicated disability surveys like the WHO and World Bank Model Disability Survey [Citation9], and makes it possible to directly compare persons with different levels of disability to the general population (no disability group). Importantly, disability measurement with the FDD11 is valid: the good psychometric properties of the tool have been recently confirmed using data from over 60,000 adults from 11 countries [Citation10].
This study aims to demonstrate that it is possible to gather valid data on disability for disaggregation using a data collection platform like the Gallup World Poll. In the present study, data from the FDD11 [Citation10] collected in the Gallup Poll in India, Lao PDR, and Tajikistan [Citation11,Citation12] was exemplarily disaggregated by disability for several SDG indicators captured in the survey. Our results show the value of integrating a short tool about disability in a comprehensive platform to track the progress of SDGs on key populations. Implementing the FDD11, as recommended in this study, would not only enable countries to report the required SDG indicators disaggregated by disability by 2030 but also to implement or plan remedial actions to tackle identified inequalities and inform the disability policy agenda beyond 2030.
Methods
Data
The secondary analyses used 2019 data from India, Lao PDR, and Tajikistan from the Gallup’s World Poll [Citation12]. The Gallup’s World Poll contains data about key socio-economic indicators and information about the citizens’ opinions on different political and economic topics in their country. Gallup uses part of this information to build compound indexes that describe and contrast important aspects within and between countries. The survey collected data from a representative sample drawn from the population in each country. Heads of households, randomly selected from the sample, answered the questionnaire in a face-to-face interview. There was no pre-selection of the participants [Citation10].
The Poll conducted in India, Lao PDR, and Tajikistan in 2019 included the brief WHO Model Disability Survey [Citation11] and its three modules: environmental factors, capacity, and performance. The FDD11 used 11 items from the capacity module of the brief MDS. It was designed as a standalone instrument to measure functioning and disability using fewer items that can be easily integrated into existing surveys and allow data analysis by disability level [Citation10]. The items measured impairments in body functions (items 1, 2, 4, 6, 9, and 11) as well as limitations in activities (items 3, 5, and 7) and participation restrictions (items 8 and 10); the response options ranged from 0 (no problem) to 5 (extreme problem). The 11 items included:
Do you have difficulty seeing, even if wearing glasses?
Do you have difficulty hearing, even if using a hearing aid?
Do you have difficulty walking or climbing steps?
Do you have difficulty remembering or concentrating?
Do you have difficulty (with self-care such as) washing all over or dressing?
How much difficulty do you have sleeping because of your health?
How much difficulty do you have doing household tasks because of your health?
Because of your health, how much difficulty do you have with joining community activities, such as festivities, religious or other activities?
To what extent do you feel sad, low, or depressed because of your health? To what extent do you feel worried, nervous, or anxious because of your health?
Because of your health, how much difficulty do you have getting along with people close to you, including your family and friends?
How much bodily aches or pain do you have?
Statistical analysis
To disaggregate the SDGs indicators by disability level measured in the FDD11, we undertook the following steps:
Identify from the available data which variables measure the selected SDG indicators.
To select the variables to measure the SDG indicators, we mapped all variables from Gallup’s World Poll and selected those that most accurately measure each indicator (). We could often follow the recommendations from the Global Indicator Framework for the SDGs and Targets 2030 Agenda [Citation13]; However, as we used microdata, we built approximations of the recommended indicators for some SDGs. For example, for SDG1: No poverty, we could follow the recommended indicator and use whether people were above the national poverty line. Nevertheless, for indicators related to the environment or political institutions, the selection required discussion and revision of the literature as the progress of the SDG was highly linked to the evolution of social norms and citizens’ perceptions [Citation14,Citation15]. For example, in SDG 5: Gender equality, we opted for the variable “feeling safe when walking alone,” as this variable better fit the two first targets within this SDG: End discrimination against women and girls; 2. End violence and exploitation against women and girls. In total, we selected 13 variables for disaggregating 16 SDG indicators.
SDG indicators measure the country’s situation and progress over time, which are highly linked to the evolution of social norms and citizens’ perceptions [Citation14,Citation15]. However, as we analyzed microdata, some indicators are based on the citizens’ perceptions, which are also valid measurements to enhance citizens’ participation and develop more insightful policy designs [Citation14,Citation15], often providing valid and useful information [Citation16]. In fact, related literature has argued that perception data can fill the gap in the timeliness and availability of data, making continuous measurement of the progress of different indicators possible [Citation17].
Define a homogeneous measure so the results are comparable.
The 16 chosen variables used as proxy measures of the SDGs indicators had different scales. In some cases, the variables were continuous; in others, the variables had a nominal or ordinal scale. To compare the results across indicators, we first transformed each variable to a single scale. For this study, all variables were converted into binary indicators, where one 1 stands for a positive outcome of the SDG, and zero 0 otherwise. For instance, in SDG 8: Decent work and economic growth, “1” stands for people having a positive view of the economy, and “0” otherwise.
Use the FDD11 to define groups representing different disability levels for the disaggregation.
The FDD11 is a validated instrument that identifies persons with one of four levels of disability—none, mild, moderate, and severe—using pre-defined cut-offs. Cut-offs correspond to the ones used in the MDS [Citation9], namely “no Score < Mean − 1 Standard Deviation (SD) or Score = 0” for no disability, “Mean − 1SD < Score < Mean” for mild, "Mean < Score < Mean + 1SD” for moderate and “Score ≥ Mean + 1SD” for severe disability. This conversion system was proposed in the original FDD11 publication [Citation10]. As recommended in the original FDD11 study, which transformed the ordinal FDD sum score into usual metrical sum scores with cardinal properties, persons who scored 0 in the FDD11 were allocated to the “no disability” group, a very important direct comparator to the other groups. Persons who scored 1 or 2 were assigned to the “mild disability” group, and persons with scores 3 to 8 were assigned to the “moderate disability” group. Finally, persons scoring 9 or higher were assigned to the “severe disability” group. Frequently, disability disaggregation is carried out by contrasting persons with “severe disability” with all the remaining persons in the data. The FDD11, however, opens the possibility of comparing these four groups so that a disability gradient (the more disability the person experiences, the worse the living situation) can be unveiled and quantified.
In the present study, we compared two disaggregation approaches: (1) comparing persons with no, mild, moderate, or severe disability and (2) comparing persons with severe disability with the remaining persons in the survey sample, labeled as having no severe disability. For the latter, we allocated persons of the no, mild, and moderate FDD11 groups into one group and labeled them as "persons with no severe disability."
Making additional adjustments where necessary
In principle, with representative samples, it is possible to compare the average of each indicator without additional adjustments. However, given that data was disaggregated by disability levels, adjusting for specific individual and country characteristics was necessary for a fair cross-country comparison. Thus, using a logit regression, we adjusted the indicators by the following characteristics: age, sex, household size, number of children, marital status, whether a person lived in an urban or rural area, and country-fixed effects. The logit regression estimated predicted probabilities (likelihood) of having a positive outcome in the SDG indicator of interest. For instance, an estimate of 0.4 means for SGD 3 (health) that a specific disability group has a probability of 40% of reporting good health. These probabilities can be contrasted across groups.
Table 1. Mapping of the Gallup variables to the SDGs indicators.
Results
summarizes the main characteristics of the sample in each of the three countries. On average, the sample was relatively young; in the three countries, the average age was below 40. Except for India, in Lao PDR and Tajikistan, more than half of the population were women, and 75% of the sample reported having a partner. The household size in the three countries was above 4, and in Tajikistan above 6. A similar pattern was observed in the number of children; for India and Lao PDR, it was below 2, and for Tajikistan, it was around 2.5. In India and Lao PDR, almost 50% of the population in the sample lived in urban areas; in contrast, in Tajikistan, 83% of the sample reported living in urban areas. Finally, about 45% of the sample in India and Tajikistan had no disability; in Lao PDR, this group corresponds to only 12% of the sample. In contrast, the percentage of people with severe disability in Tajikistan and India ranged between 11% and 16%, respectively, while this group for Lao PDR was 33%. For disaggregated descriptive statistics of the SDGs, see Table A1 in the Appendix.
Table 2. Descriptive statistics.
Disaggregation by disability groups and cross-country comparison using the FDD11
displays the adjusted SDG indicators disaggregated by disability level. Reported numbers are predicted probabilities (likelihood), where a higher number always indicates a better outcome of the SDG indicators. The results should be read as the likelihood that a person in each disability group reported a positive SDG. summarizes the results and shows a clear and consistent disability gradient: the higher the level of disability, the lower the likelihood that a person reports a positive outcome in all the SDG indicators in the three countries. Interestingly, people with similar levels of disability showed marked differences in the SDG indicators across countries, which highlights the critical role that the environment plays in their lived experience. For instance, persons living in India with no or mild disability have approximately 80% and 72% probability of reporting good health (SDG 3: Good health & wellbeing), respectively, while for persons with moderate or severe disability, the probabilities are approximately only 50% and 30%, respectively. Compared to no disability, persons facing any level of disability are always more likely to face poverty (SDG 1), hunger (SDG 2), have a reduced health status and well-being (SDG 3), be less satisfied with the quality of education (SDG 4), to face inequality (SDG 5), to report to have a bad quality of water and sanitation (SDG 6, SDG 14), to have a negative view of the economy (SDG 8), to be less satisfied with the efforts to preserve the environment (SDG 12, SDG 13, SDG 15), and to report a low law and order index (SDG 16). For a few indicators, namely affordable and clean energy (SDG 7), industry, innovation and infrastructure (SDG 9), and sustainable cities and communities (SDG 11), the groups with no or mild disability are comparable. However, for these same indicators, persons with moderate and severe disability reported consistently worse SDGs outcomes.
Figure 1. Predicted probability of SDG indicators by disability group.
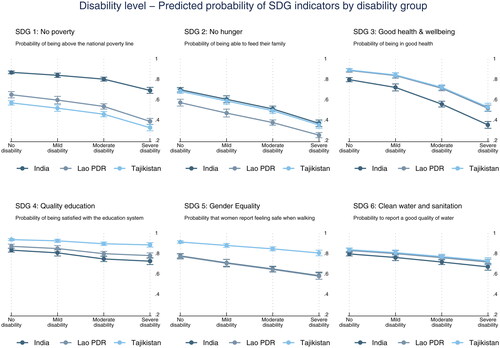
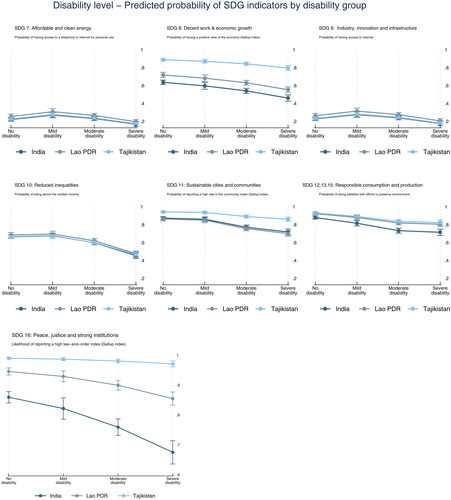
Table 3. Disability level - estimated probability of a positive SDG indicator.
Disaggregation by severe versus non-severe disability and in-country comparisons
displays and reports the estimated results using a dichotomous approach of comparing persons with severe disability to the remaining persons in the sample. A steeper slope indicates a bigger gap between the group with no disability compared to the group with severe disability. Conversely, a flatter line indicates a smaller gap between the two groups. The main result of is the significant differences in achieving the SDGs across countries, where persons with severe disability are at a clear disadvantage in comparison to persons with no severe disability.
Figure 2. Predicted probability of SDG indicators by disability group (severe / less than severe).
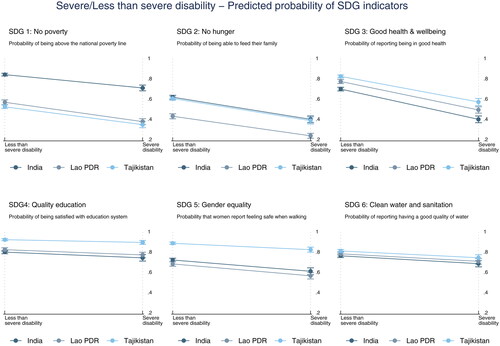
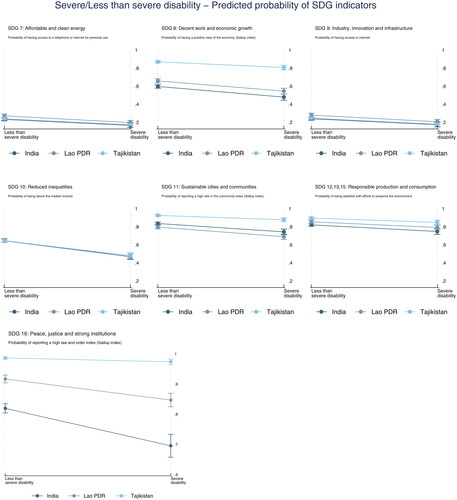
Figure 3. Predicted probability of SDG indicators by disability level.
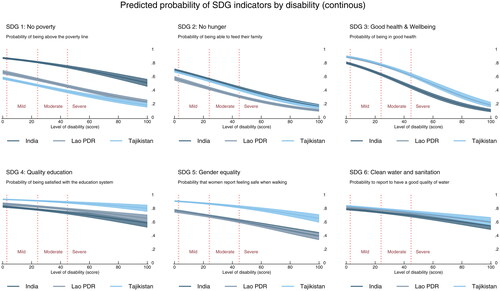
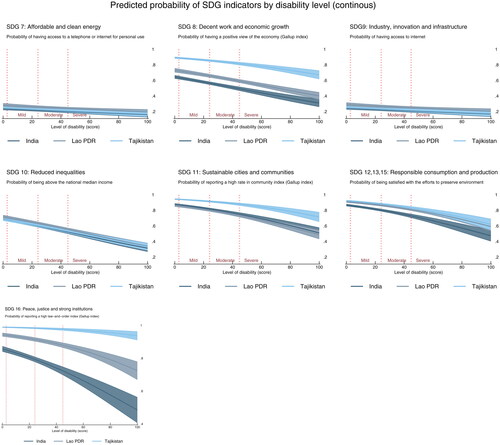
Table 4. Severe / less than severe - estimated probability of a positive SDG indicator.
In the three countries, the biggest gap is observed for the SDG 3 (Good health & wellbeing). In India, for instance, persons with less than severe disability have approximately 54% probability of reporting good health, in comparison to a probability of 35% for persons with severe disability. A similar pattern is observed in the SDG 2 (Zero hunger). SDG 1 (No poverty) also has a big gap, especially in Lao PDR and Tajikistan. The figure also identifies the SDGs with the best and worst performance in each country. For Lao PDR and Tajikistan, SDG 16 (Peace, justice and strong institutions) has the best performance. For India, SDGs 12, 13, and 15 (Responsible consumption and production) perform best. In contrast, SDG 7 and SDG 9 (Affordable clean energy and innovation & industry) show the worst performance in the three countries.
Comparison of the two disaggregation approaches
We use SDG 3 (Good health & Wellbeing) to compare the FDD11 and the frequent approach for disaggregating data (). The following scenarios are observed:
Table 5. Comparison of the FDD11 to a dichotomous approach for disaggregating data predicted probabilities for reporting good health (SDG3: good health & wellbeing).
Both approaches disclose inequalities and clearly show that people with severe disability are at a significant disadvantage compared to others. However, when people with no, mild, and moderate disability are combined into a group called “less than severe disability” and used as the comparator, the probability obtained for this group is lower, masking differences between these groups and underestimating inequalities compared to people with severe disability. In India, for example, people with severe disability are two times less likely to be in good health using a dichotomous approach but almost three times less likely to be in good health when compared with the “no disability” group generated by the FDD11. Additionally, people with moderate disability have a better likelihood than persons with severe disability (35%) to be in good health, but their probability (55%) is still quite different from the probability of the no disability group (80%). To highlight the need for data that enables disaggregation, we also present estimates showing a continuous disability score () in the Appendix.
Discussion
This study demonstrated the value of integrating a valid and reliable tool developed to measure disability in a comprehensive platform such as the Gallup World Poll to disaggregate SDG indicators and unveil the extent of inequality experienced by persons with disability. The results revealed a consistent disability gradient across all countries and indicators, showing that the higher the level of disability, the lower the probability of having a positive outcome in barely any of the assessed SDG indicators. This gradient is significant as it highlights the need for targeted interventions and policies to address the specific needs of individuals with different disability levels to reduce disparities and achieve a more equitable society.
The additional comparison of the FDD11 approach of contrasting persons with varying levels of disability with a dichotomous comparison of persons with severe disability with the remaining population in a survey (“persons with no severe disability”) showed that while both approaches disclosure inequalities, when people with no, mild and moderate disability are combined into a group called “no severe disability” and used as the comparator, this leads to an underestimation of inequalities. This underestimation is very problematic for evidence-informed policymaking as it can lead to inadequate policies, or no policies at all, with considerable impact on the inclusion of persons with mild, moderate, and, above all, severe disability in society.
The study demonstrates a promising way to use the FDD11 for a sound disaggregation of the SDG goals by disability, quantifying inequalities experienced by marginalized populations. If concerted action and resources are appropriately channeled, following the model described in this study, countries can still collect data regularly to track progress on SDG indicators for persons with disability by 2030. For example, India, Lao PDR and Tajikistan can repeat the study by 2025, compare data with pre-existing COVID-19 estimates reported in this study, and collect data by 2030 to evaluate progress toward SDGs. Countries that have not collected data so far can also plan a baseline assessment and a follow-up before 2030 to measure progress. This will allow them to plan or implement remedial actions and measure their effectiveness later. In addition, regular assessments will also inform the post-2030 agenda on what the focus on disability should be. The two elements that make such data collection a reality, a valid tool and comprehensive and reliable platforms, are readily available.
Valid, reliable, and brief tools that can be applied to collect and disaggregate data on disability are available. The FDD11 was evaluated using data from over 60 000 adults [Citation10], which differentiates between four and allows for a more nuanced understanding of the experiences of people with disability concerning SDG indicators. If implementing this 11-item tool is deemed too costly to be integrated into existing data platforms like Gallup, shorter valid tools also exist. For instance, the UK Office of National Statistics used two questions that underwent rigorous cognitive testing and piloting in the 2021 national census to identify persons with disability [Citation6]. The data was disaggregated by COVID-19 mortality indicators and revealed essential information about the disproportionate impact of the pandemic on persons with disability [Citation6]. The two questions have also been disaggregated by other indicators such as sex, deprivation, or age. Currently, several countries use the Washington Group Questions (WGQ) to disaggregate disability data in censuses and surveys [Citation18]. However, to the best of our knowledge, none of the WGQ versions have been psychometrically tested with appropriate sample sizes to confirm their validity and reliability for people with different health conditions or impairments, and concerns about the WGQ have increased in recent years [Citation19,Citation20], with even the US Census Bureau recently questioning their use based on evidence challenging the reliability of US disability prevalence estimates obtained with the WGQ [Citation21]. It is therefore important to reiterate that to ensure precise and reliable disability estimates, it is indispensable that National Statistics Offices only consider tools that have undergone a sound and scientifically documented (published in peer-reviewed journals) validation process.
Comprehensive data platforms that collect extensive information on SDG indicators are also available. The Gallup World Poll used in this study is a platform that can be used for integrating a tool like the FDD11 at a considerably lower cost than conducting dedicated disability surveys, with the advantage that data collected across countries is comparable and easily accessible. Other platforms can also be explored by countries, including the Demographic and Health Survey [Citation22], implemented in several countries or national or international living conditions, labor, or other topic-specific surveys that capture information on various SDG indicators. However, a financial investment is needed even to integrate additional questions to existing platforms. Given the scarcity of financial resources in many countries, planning and allocating well-existing resources is essential to obtain the most precise and reliable information that will inform policies and actions.
For comparison purposes, as we show in this study, it is necessary to harmonize the selected variables to evaluate SDGs indicators—in our case, dichotomizing all variables into a positive outcome (i.e., having good health) and a negative one (the opposite)—makes the comparison of inequalities across indicators, using graphs and tables, easy and accessible to all relevant stakeholders. Additionally, it must be acknowledged that when examining cross-country data, it is essential to account for potential confounding factors, such as differences in demographic characteristics, health conditions, or risk factor distributions. Adjustments like the ones applied in our study (for age, sex, household size, number of children, marital status, urban or rural area, and country fixed effects) help mitigate potential biases and improve the validity of cross-country comparisons. Due to the heterogeneity of the SDGs indicators, this demonstration study used the probabilities of a positive outcome by disability level. Although we recognize that this is not a usual way of reporting disaggregated data by disability, we offer it as a possibility of generating more precise information that is easy to compare and offers a good ground for studying trends over time. For instance, with the prevalence of severe disability in India of around 145 million persons [Citation23], an estimate of 0.32 regarding SDG 3 (good health) means that only 46 million within this group are in good health, while 99 million are not in good health.
In conclusion, our study demonstrates that it is not too late to generate sound and precise data about inequalities faced by persons with disability to inform policies targeting that by 2030 no person is left behind. Governments, statistical offices, researchers, and policymakers are encouraged to invest in integrating brief and valid disability tools in existing data platforms to track progress on the SDG goals and quantify inequalities experienced by marginalized populations such as persons with disability. To avoid deepening the evident inequalities observed in this and further studies, a concerted action and well-planned resource allocation to reliable and valid data collection is needed before 2030 to ensure that SDG goals are met for all people.
Disclosure statement
No potential conflict of interest was reported by the author(s).
Data availability statement
Data are available from WHO on request.
Additional information
Funding
References
- UN. Transforming our world: The 2030 agenda for sustainable development; 2015.
- The World Bank Group. Sustainable development goals (annual report). SDG Fund. 2019. Available from: https://documents1.worldbank.org/curated/es/106391567056944729/pdf/World-Bank-Group-Partnership-Fund-for-the-Sustainable-Development-Goals-Annual-Report-2019.pdf
- Sperrin Á. A disability rights approach to a constitutional right to housing. Int J Disabil Soc Justice. 2023;3(1):80–95.
- The Disability Data Portal [Internet]. [cited 2023 Nov 8]. Available from: https://www.disabilitydataportal.com/
- Cieza A, Sabariego C, Bickenbach J, et al. Rethinking disability. BMC Med. 2018;16(1):14. doi: 10.1186/s12916-017-1002-6.
- Ayoubkhani D, Matt B. Updated estimates of coronavirus (COVID-19) related deaths by disability status, England: 24 January to 20 November 2020. England: Office for National Statistics; 2021. Available at: https://www.ons.gov.uk/peoplepopulationandcommunity/birthsdeathsandmarriages/deaths/articles/coronaviruscovid19relateddeathsbydisabilitystatusenglandandwales/24januaryto20november2020
- UN DESA. The sustainable development goals Report 2017 - July 2017. New York, USA: UN DESA; 2017. © UN DESA. Available from: https://unstats.un.org/sdgs/report/2017/
- Gallup Organization, editor. The Gallup Organization [Internet]. Washington, DC: Gallup Organization; [cited 2023 Nov 8]. Available from: http://www.gallup.com
- Sabariego C, Fellinghauer C, Lee L, et al. Generating comprehensive functioning and disability data worldwide: development process, data analyses strategy and reliability of the WHO and World Bank Model Disability Survey. Arch Public Health. 2022;80(1):6. doi: 10.1186/s13690-021-00769-z.
- Lee L, Kamenov K, Fellinghauer C, et al. WHO Functioning and Disability Disaggregation (FDD11) tool: a reliable approach for disaggregating data by disability. Arch Public Health. 2022; 80(1):249. doi: 10.1186/s13690-022-01001-2.
- Sabariego C, Fellinghauer C, Lee L, et al. Measuring functioning and disability using household surveys: metric properties of the brief version of the WHO and World Bank model disability survey. Arch Public Health. 2021;79(1):128. doi: 10.1186/s13690-021-00654-9.
- Chen MZ, Lee L, Fellinghauer C, et al. Demographic and environmental factors associated with disability in India, Laos, and Tajikistan: a population-based cross-sectional study. BMC Public Health. 2022;22(1):607. doi: 10.1186/s12889-022-12846-1.
- Assembly, UN General. Work of the statistical commission pertaining to the 2030 agenda for sustainable development. New York (NY): United Nations; 2017.
- Dhillon A, Reinert I, Willett D. Citizen-driven measurement of the sustainable development goals. How can perceptions data measurement contribute to the 2030 agenda for sustainable development? [Internet]; UNICEF - National University of Singapore; 2017 Apr [cited 2024 Apr 8]. Available from: https://www.unicef.org/innovation/media/4506/file/Citizen-Driven%20Measurement%20of%20the%20Sustainable%20Development%20Goals.pdf
- DeLeon P. The historical roots of the field. In: Goodin R, Moran M, Rein M, editors. The Oxford handbook of public policy [Internet]; [cited 2024 Jun 13]. Oxford University Press; 2008. p. 0. doi: 10.1093/oxfordhb/9780199548453.003.0002.
- Organisation for Economic Co-operation and Development (OECD). OECD guidelines on measuring subjective well-being. Paris: OECD publishing; 2013. Available from: https://read.oecd-ilibrary.org/economics/oecd-guidelines-on-measuring-subjective-well-being_9789264191655-en
- The United Nations Secretary-General’s Independent Expert Advisory Group. A world that counts. Mobilising the data revolution for sustainable developement [Internet]; Washington, DC: United Nations;2014 Nov [cited 2024 Apr 8]. Available from: https://www.undatarevolution.org/wp-content/uploads/2014/11/A-World-That-Counts.pdf
- The Washington Group on Disability Statistics [Internet]; [cited 2024 May 27]. Available from: https://www.washingtongroup-disability.com/
- Mactaggart I, Kuper H, Murthy GVS, et al. Measuring disability in population based surveys: the interrelationship between clinical impairments and reported functional limitations in Cameroon and India. PLoS One. 2016;11(10):e0164470. doi: 10.1371/journal.pone.0164470.
- Australian Bureau of Statistics. Analysis of the 2016 supplementary disability survey [Internet]. Belconnen:Australian Bureau of Statistics; 2019. [cited 2024 May 10]. Available from: https://www.abs.gov.au/statistics/people/people-and-communities/research-paper-analysis-2016-supplementary-disability-survey
- Landes SD, Swenor BK, Vaitsiakhovich N. Counting disability in the National Health Interview Survey and its consequence: comparing the American Community Survey to the Washington Group disability measures. Disabil Health J. 2024;17(2):101553. doi: 10.1016/j.dhjo.2023.101553.
- The DHS Program - quality information to plan, monitor and improve population, health, and nutrition programs [Internet]. [cited 2023 Nov 8]. Available from: https://dhsprogram.com/
- World Health Organization. Brief model disability survey: results for India, Lao People’s Democratic Republic and Tajikistan [Internet]. Geneva: World Health Organization; 2019 [cited 2023 Nov 8]. Available from: https://www.jstor.org/stable/resrep33223
Appendix A
Table A1. Descriptive statistics SDGs: share of the population that declared a positive outcome in each indicator.