
Abstract
Linking water and land is essential in planning for the future of the western United States. We propose the concept of ‘water-smart growth’ and explore its implications through incorporating water considerations into the SLEUTH land-use model. The urban growth trajectory in Cache County, Utah, is modeled from 2007 to 2030 under four different scenarios: current trend; smart growth; water-smart growth with moderate implementation; and water-smart growth with full implementation. Comparisons of simulation results illustrate the extent and ways in which water-smart growth would alter current established land-use growth patterns. The approach represents an initial step to better integrate land and water in urban growth modeling and planning. This study's purposes are to provide improved understanding and representation of linkages between water and land in urbanizing environments, offer insights from a set of modeled options, and demonstrate the significance of integrating land and water in planning practices.
1. Introduction
As the fastest growing region in the United States, the West is facing challenging land-use planning and water management issues (US Census Bureau Citation2010; Reisner Citation1993). Rapid population growth and urbanization have significantly changed the region's land-use patterns, with large acreages of land, especially agricultural land, being converted through urban development. Meanwhile, substantial land transformation and population growth have caused a variety of contemporary water management issues, including: changing water demands; shifts in water uses; over-exploitation of aquifers; alterations to surface runoff; declining water quality; and the need for infrastructure renovation and wastewater treatment (Hutchinson, Varady, and Drake Citation2010).
Linkages between land and water have been suggested as a key to facilitate the West's land transformation in a water-sustainable manner (Gober Citation2010; Gober et al. Citation2013; Tarlock and Lucero Citation2002; Woltjer and Al Citation2007). For example, the Integrated Water Resources Management (IWRM) Framework promotes the strengthening of local action plans and improving the linkages between water and land-use planning (Mitchell Citation2005). C.A. Arnold (Citation2005) proposed the concept of ‘wet growth,’ suggesting water quality and water availability should be taken into account in land-use planning, and growth and land use should be sustainable with respect to maintaining aquatic ecosystems and managing water resources. Bates (Citation2011) proposed water-conscious land-use planning to promote protecting and restoring water sources in land-use practices, reducing humans’ water footprint through appropriate development patterns, and limiting growth by recognizing and incorporating water as a constraint to permitting new development.
Although the need to link land-use planning and water management has been recognized, historically, there have been disconnections between land-use planning and water management in legal frameworks, institutional management, and planning ideologies per se (Arnold Citation2005; Bates Citation2011). As pointed out by several observers, “it is all too common for critical linkages between land use and water planning to be ignored, or only tacitly recognized” (Carter, Kreutzwiser, and de Loë Citation2005, 116). In particular, the entrenched disconnected legal and administrative regimes of land-use planning and water management make it extremely hard to make radical changes to facilitate integration (Gober et al. Citation2013; Tarlock and Lucero Citation2002).
Carter, Kreutzwiser, and de Loë (Citation2005) argue that integration of land-use planning and water management is not merely a matter of lacking vision or strategies. Local land-use planners and water managers need practical ways of applying the concepts of integration and sustainability, and need simple tools to evaluate and understand the trade-offs of various decisions. A coupled water and urban land-use planning model would be an effective tool for such purpose. However, current modeling approaches also reflect the conceptual and institutional gaps between water planning and land-use planning. Few land-use models have emphasized water's role in land-use modeling and scenario planning (Li, Endter-Wada, and Li Citation2015; Tayyebi, Pijanowski, and Pekin Citation2015). Greater efforts need to be made to incorporate water elements into land-use models.
2. Water-smart growth
Ideas like water-conscious land-use planning, ‘wet growth,’ and IWRM provide the conceptual foundation and rationale for water-smart growth. Water-smart growth brings water to smart growth in response to rapid population growth, urban sprawl, and limited water resources in the arid West. The ‘smart’ part of water-smart growth is aligned with traditional smart growth. It advocates compact development with high infill rates, less land conversion from open space to urban development, and less impervious area (Downs Citation2007). The ‘water’ part of water-smart growth stands for preventing or reducing negative human impacts on water and water-related resources.
Three aspects of water and water-related resources are selected as targets for protection: surface water and groundwater resources, particularly groundwater recharge zones; wetlands; and soils with high infiltration rates. These three aspects are chosen for several reasons.
First, both surface water and groundwater provide important public water supplies. The quality of groundwater recharged to the water table depends largely on the nature of the overlying land use. Therefore, protecting water resources (surface water and groundwater) and groundwater recharge zones from development, pollution, and contamination is essential to ensure water quality and maintain ecosystem functions (Winter et al. Citation1998; Leopold Citation1968). Also, protection of aquifers and of recharge zones contributes to an area's portfolio of useable water supply for urban growth.
Second, wetlands are important in regulating river flow, recharging groundwater zones, filtering pollutants and fertilizers, decreasing flooding, providing habitats for plants, fish, wildlife, and birds, and serving recreational and cultural functions (Brinson Citation1993; Mitsch and Gosselink Citation2015). Maintaining wetlands is beneficial to sustain ecosystems and preserve cultural landscapes and recreational opportunities.
Third, soil with high infiltration rates is desirable because low infiltration may restrict or block water from entering the soil and cause ponding, flooding, or surface runoff (Trout, Sojka, and Okafor Citation1990). Runoff can carry soil particles and surface-applied fertilizers and pesticides off the land and result in soil erosion, contamination, and water quality degradation (Novotny Citation1999). Preserving soil with high infiltration rates is particularly important in the urban environment, due to the fact that it can help infiltrate storm water, decrease surface runoff, and control flooding (Williams and Wise Citation2006).
Water-smart growth is strategic thinking and planning for water-sustainable growth. This study focuses on how to direct growth to maintain water quality and sustain ecosystem integrity. In the future, water-smart growth also needs to integrate water supply and allocation planning. Water-smart growth represents an actionable way of integrating land-use planning and water planning that can be used by planning professionals in growth-related decision-making with policy-makers and public citizens. We hope that this concept will prompt greater collaboration among land and water disciplines and professions toward a ‘water-smart’ oriented growth in the arid urbanizing American West.
3. Methods
To examine the prospects of the water-smart growth concept, we employ the SLEUTH model to visualize and simulate future land-use changes under different growth alternatives. We incorporate water considerations into the SLEUTH model so as to explore a set of options for linking land and water in the urbanizing environment. The goal of this study is not to improve modeling techniques, but to use models and scenarios as a means to investigate the extent and ways in which water-smart growth would alter current established land-use growth patterns.
3.1. Study area
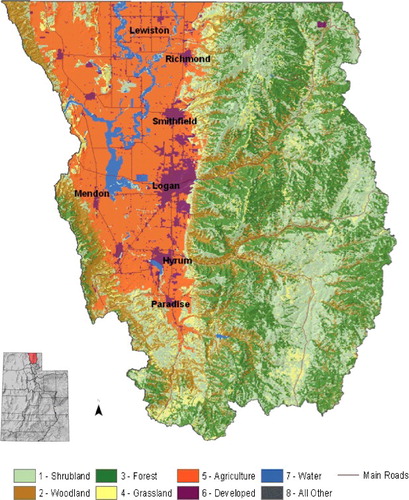
Cache County is located in an agricultural valley in the northeastern part of Utah that is bordered by the Uinta-Wasatch-Cache National Forest on the east (). The county currently contains 19 municipalities and 6 unincorporated towns, has a total area of 1,173 square miles (3,038.1 km2), and had a 2010 population of 112,656 (US Census Bureau Citation2010) which is growing by approximately 2% annually. Conservatively estimated, Cache County's present population will almost double to reach nearly a quarter million residents by 2040 (Cache Valley Regional Council Citation2010). Population growth is not only changing land use and land cover, but is also raising water demands, increasing pressure on the capacity and efficiency of water delivery systems, and intensifying risks of flooding due to increased impervious surface areas and diminished infiltration rates (Utah Association of Conservation Districts & Utah Department of Agriculture and Food & Natural Resources Conservation Service Citation2011). The area is subject to droughts characteristic of the Intermountain West region. Climate change may intensify Cache County's water stress due to shifts in precipitation patterns and the spatial–temporal mismatch of water supply relative to human uses (Leung et al. Citation2004; Gillies, Wang, and Booth Citation2012). Thus, integrating water considerations into land use and urban growth planning is an important issue for Cache County.
Figure 1. Location of study area. (See online color version for full interpretation.)
3.2. Data
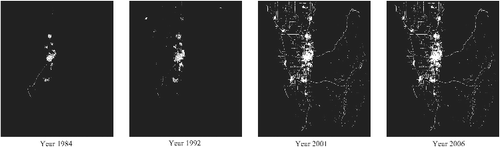
The SLEUTH model is tightly linked with GIS and raster-based spatial data that are derived from remote sensing (Solecki and Oliveri Citation2004; Jantz et al. Citation2010; Jantz, Goetz, and Shelley Citation2004; Clarke, Hoppen, and Gaydos Citation1997). A geodatabase was assembled to support visualization, descriptive analysis, and modeling of urban growth and land transformations for Cache County. Six major types of data were compiled for this project: land use, urban extent, slope, road, and hillshade, along with water-related data. Historical raster images and data for each category were collected and processed, as listed in . ISODATA unsupervised classification is applied to 1984 Satellite Image (Landsat 4-5, TM 30 m) acquired from U.S. Geological Survey using ERDAS IMAGINE 2010. Level 1 of the Anderson classification system was used. Post-classification, based on expert-knowledge, was used to update the classification products according to existing land-use databases using ArcGIS 10.1. The accuracy of each of the derived classification products was assessed with a kappa coefficient 0.84. Also, the accuracy of this classification is checked by fieldwork. Among 100 sites we inspected, no misclassification was found. 1992, 2001, and 2006 land-use data were acquired from National Land Cover Database (NLCD). Land-use categories are grouped into urban, agricultural, forest, grassland, wetland, water, or barren, based on NLCD land-use classification description.
Table 1. Input data used for visualization and model simulation.
3.3. Applying SLEUTH
Numerous land-use models are being developed from different disciplinary backgrounds, using a variety of techniques including linear extrapolation, suitability mapping, genetic algorithms, neural networks, scenario analysis, expert opinion, public participation, and agent-based modeling (Pontius Jr et al. Citation2008; Tayyebi and Pijanowski Citation2014; Tayyebi, Perry, and Tayyebi Citation2014; Agarwal et al. Citation2002; Verburg et al. Citation2002; Briassoulis Citation2000; Tayyebi et al. Citation2014). SLEUTH, developed by Clarke in 1997, is a probabilistic cellular automata model that simulates urban growth and land-use changes (Clarke, Hoppen, and Gaydos Citation1997). We chose the SLEUTH model because of its open access, availability of source code, and ease of use (Chaudhuri and Clarke Citation2013; Clarke, Hoppen, and Gaydos Citation1997). Another reason is because SLEUTH allows for flexibility in building alternative scenarios and provides the simulation environment for user-defined growth rules. The utility of the SLEUTH model for simulating urban growth and land-use changes has been widely successful and well documented (Solecki and Oliveri Citation2004; Jantz et al. Citation2010; Jantz, Goetz, and Shelley Citation2004; Clarke, Hoppen, and Gaydos Citation1997; Verburg et al. Citation2004).
The name SLEUTH is an acronym for the input requirements of the model: slope, land use, excluded areas, urban extent, transport routes, and hillshade (Clarke, Hoppen, and Gaydos Citation1997). SLEUTH examines historical urbanization and land-use change patterns, then projects future growth as specified by the geographic environment (slope, land cover, land uses, roads, hillshade, and excluded zones) and growth rules based on alternative growth scenarios and different policy options (Solecki and Oliveri Citation2004). Complete documentation on SLEUTH is maintained at the project website: http://www.ncgia.ucsb.edu/projects/gig/ (Gigalopolis Citation2001). The specific model diagram used in this study is shown in . Consistent with the traditional SLEUTH model, historical input data (years 1984, 1992, 2001, and 2006; see ) are used to calibrate the model and determine past transition rules and growth parameters, which are applied to different scenarios for future growth predictions (from year 2007 to 2030).
Figure 2. Model diagram of SLEUTH simulation in this study.
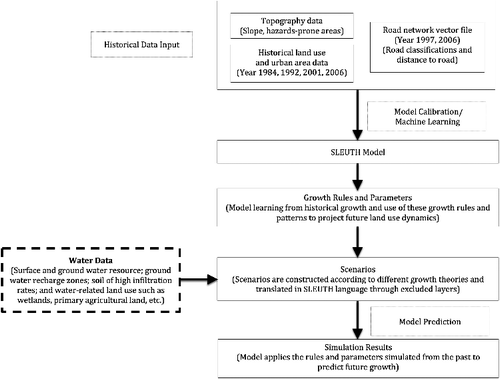
Figure 3. Images of historical urban extent of study area.
The calibration process is the most essential and time-consuming phase, as the model must be calibrated to the unique characteristics of the study area. The purpose of model calibration is to use historical land use and urban extent data to determine a set of values of the growth parameters that appropriately represent the spatial pattern and extent of historical growth (Clarke, Hoppen, and Gaydos Citation1997; Jantz, Goetz, and Shelley Citation2004; Solecki and Oliveri Citation2004). provides brief descriptions of what each growth type and coefficient represents (Clarke and Gaydos Citation1998; Clarke, Hoppen, and Gaydos Citation1997; Gigalopolis Citation2001). Five coefficients are integer values that range from 0 to 100. For calibration, the model runs through every combination of the five coefficient values indicated by performing Monte Carlo iterations. The earliest map (year 1984) of historical land use and urban extent layers were used to initialize the simulation and three additional control points (years 1992, 2001, and 2006) were used to measure how well the spatial patterns of land-use dynamics were modeled for that year. In this case study, a thorough calibration was performed following the established SLEUTH calibration protocol (http://www.ncgia.ucsb.edu/projects/gig/Imp/imCalibrate.htm). We used a combination of Lee-Sallee metric and optimal SLEUTH metric (OSM) (Dietzel and Clarke Citation2007; Pontius Jr et al. Citation2008) to justify our measurement of model accuracy with past data. At the final calibration, we got: a Pearson value r2 = 0.91, which represents the squares regression score for modeled urbanization compared to actual urbanization for the control years; a Lee-Sallee metric = 0.7871, which measures the spatial fit between the model's growth and the known urban extent for the control years; and an OSM = 0.7881, which is derived from a set of other most relevant metrics offered by the code. The final values of the control coefficients were determined: dispersion coefficient (32), breed coefficient (16), spread coefficient (71), slope resistance (73), and road gravity (100).
Table 2. Summary of growth types and coefficients simulated by SLEUTH model.
3.4. Scenarios
There are three general methods that are applied in SLEUTH in order to simulate different scenarios (Rafiee et al. Citation2009). The first one is to change growth parameter values to guide alternative growth rules and shape future growth patterns (e.g. Leao, Bishop, and Evans Citation2004). The second one is to make alterations in the excluded layers by assigning specified areas with different levels of exclusion values (e.g. Oguz, Klein, and Srinivasan Citation2007). And the third one is to adjust self-organization constraints (e.g. Yang and Lo Citation2003). In this study, in order to simply test how water-smart growth will affect urban growth, we chose not to adjust growth parameters in the future growth simulation. Instead, we used the second approach by modifying excluded layers to explore how protecting water and water-related areas would make a difference in future growth patterns.
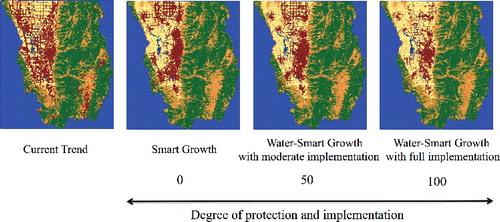
The excluded layers are where users can designate lands that are resistant to urban development, which allows for user-defined functionality and fosters the visualization of different growth and policy scenarios. In the exclusion layer, each pixel is usually scaled from 0 (no exclusion from development) to 100 (completely excluded from development). In this study, federal, state, and local parks, conservation easement areas, and surface water bodies, were completely excluded (value = 100) from development in all four scenarios. Four growth scenarios were investigated and visualized through urban growth simulations: current trend; smart growth; water-smart growth with moderate implementation; and water-smart growth with full implementation (). The following paragraphs describe how exclusion values were set for each scenario.
Figure 4. Illustrations of excluded layers under four scenarios.
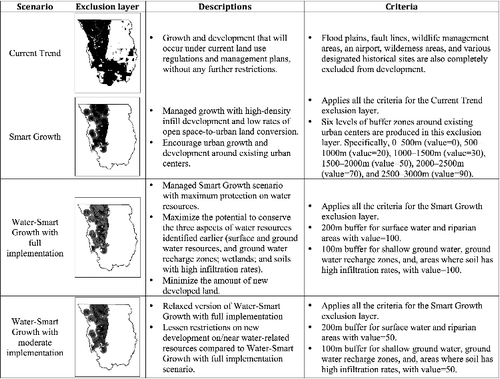
The current trend scenario represents growth and development that will occur under current land-use regulations and management plans, without any further restrictions. For the purposes of protecting public health and welfare, maintaining ecosystem integrity, and preserving cultural heritage, we assigned flood plains, fault lines, wildlife management areas, an airport, wilderness areas, and various designated historical sites with values equal to 100. This action means all these areas are completely excluded from development and essentially represents current policy and best planning practices. The rest of the land within the study area remains open to development, with values equal to 0. In this scenario, modeled urban growth is allowed to happen at any non-excluded locations without further restrictions, but subject to the control coefficients simulated during the model calibration process.
The smart growth scenario assumes managed growth with high-density infill development and low rates of open space-to-urban land conversion. Smart growth scenario applies all the criteria for the current trend exclusion layer, but encourages urban growth and development around existing urban centers. Six levels of buffer zones around existing urban centers are produced in this exclusion layer. Specifically, the buffer zone within 500 m radius from existing centers is assigned a value of 0, meaning that this area is fully open to development and growth. The buffer zone between 500 and 1,000 m from existing centers is assigned a value of 20, indicating a 20% probability of exclusion. With the buffer radius increasing every 500 m, the probability of exclusion increases accordingly. The six levels of buffer zones and associated values are 0–500 m (value = 0), 500–1,000 m (value = 20), 1,000–1,500 m (value = 30), 1,500–2,000 m (value = 50), 2,000–2,500 m (value = 70), and 2,500–3,000 m (value = 90). Areas that are not within the 3,000 m buffer zones are not encouraged for growth or development, with an assigned value of 100. The widths of buffers were determined by reference to earlier work (Yang and Lo Citation2003) and assessed for appropriateness given the current size and nature of communities in Cache County. No extra environmental protection is added in this scenario.
The water-smart growth with full implementation scenario represents a managed smart growth scenario with maximum protection on water resources. This scenario maximizes the potential to conserve the three aspects of water resources identified earlier (surface water and groundwater resources, and groundwater recharge zones; wetlands; and soils with high infiltration rates) and minimizes the amount of new developed land. Based on smart growth, the water-smart growth with full implementation scenario adds more protected areas excluded from growth and development, including: 200 m buffer for surface water and riparian areas; 100 m buffer for shallow groundwater, groundwater recharge zones, and areas where soil has high infiltration rates (defined as US classification of hydrologic groups A). Standards for buffer design are sourced to ‘Riparian Buffer Design Guidelines’ (Johnson and Buffler Citation2008). These water-related areas are assigned a value of 100, which means they are completely excluded from development. At the same time, the six-level buffer zones applied in the smart growth to encourage growth near existing urban centers are also applied in this scenario. The value of overlapping areas (between the smart growth six-level buffer zones and the three water-related areas) was set to an accumulated sum, but values over 100 were considered to be 100 (full exclusion).
Water-smart growth with moderate implementation has more relaxed assumptions than the water-smart growth with full implementation. It lessens restrictions on new development on/near water-related resources compared to the water-smart growth with full implementation scenario. Identified protected water-related areas (200 m buffer for surface water and riparian areas; 100 m buffer for shallow groundwater, groundwater recharge zones, and areas where soil has high infiltration rates) are assigned a value of 50 (partially excluded) rather than 100 (completely excluded). This rule means these identified protected water-related areas have a 50% chance of being developed or excluded from development. In other words, these areas can be developed but development is not encouraged, so these locations are not considered primary choices in simulation runs. Meanwhile, values of the six-level buffer zones applied in smart growth remain the same, and overlapping areas are assigned values with an accumulated sum up to 100 (full exclusion).
4. Results
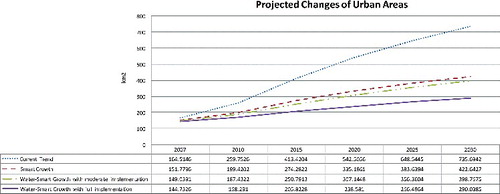
SLEUTH generated rasterized images of simulated future urban extent and land uses at one-year intervals for each scenario from 2007 to 2030. These rasterized images have the same categorical land uses as input land-use data. These rasterized images are brought into ArcGIS to analyze the acreages of each land use under each scenario (Clarke, Hoppen, and Gaydos Citation1997). shows the projected land-use statistics by land-use categories by 2030 under the four scenarios. Under the current growth scenario, urban land use would reach 736 km2 by 2030. Smart growth would slow down the current sprawl trend, and reduce land development to 423 km2. Water-smart growth with full implementation would result in a total of 290 km2 of developed areas. The total amounts of developed land in 2030 under the smart growth scenario (423 km2) and the moderately implemented water-smart growth scenario (399 km2) are very close.
Table 3. Projected land use by 2030 under four scenarios (unit: km2).
shows the growth trajectories of the four scenarios and projected changes in urban area. The current trend presents a steeper growth rate at a pace of 24.9 km2/year in new urban development compared to the other three alternatives. Smart growth and water-smart growth with moderate implementation represent similar growth trajectories at 11.9 and 10.9 km2/year, respectively. Water-smart growth with full implementation exhibits the slowest and steadiest growth with 6.3 km2/year in new urban area.
Figure 5. Details of urban growth projections under four scenarios from 2007 to 2030. (See online color version for full interpretation.)
shows the spatial distributions of projected urban growth under the various scenarios. The current trend scenario shows the greatest dispersion of growth throughout the study area. The smart growth scenario shows that new growth mostly occurs near current existing urban centers. The two water-smart growth scenarios keep most development away from water and water-related land uses, however, with quite different spatial patterns, due to the varying degrees of implementing protections for water-related resources. Most importantly, all four scenarios show that future land-use patterns will retain some of the historic imprint of the rectangular pattern of the Public Land Survey System as well as the well-established Mormon settlement pattern under which towns were laid out in a regular grid pattern with square blocks and wide streets (Jackson Citation1977; Jackson and Layton Citation1976; Parera Citation2005).
Figure 6. Simulation results of urban growth in Cache County by 2030 under four scenarios. (See online color version for full interpretation.)
Under the current trend scenario, about 432 km2 of agricultural land in 2006 would be converted, mostly to urban development, by 2030 (). Smart growth would be able to save substantial amounts of agricultural land, with 223 km2 of agricultural land conversions from 2006 to 2030 (). However, when we overlay new urban areas projected by the four scenarios with different designated farmland types, results () show that under all of the scenarios except water-smart growth with full implementation, prime farmland would be the major land source for new urban development. Nearly half of the new development under the smart growth scenario would happen on prime farmland, with the highest percentages of prime farmland loss. The water-smart growth with moderate implementation scenario will have similar amounts of total agricultural land being developed compared with the smart growth scenario, but with less development on prime farmland. Under the water-smart growth with full implementation scenario, more agricultural land would be saved, and only 19% of the new development would be on prime farmland.
Table 4. Percentage of projected urban growth on different designated farmland.
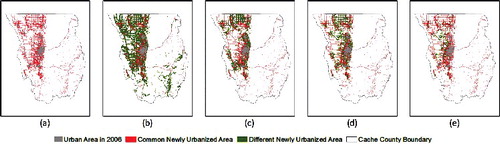
identifies the similarities and differences of newly urbanized areas under each scenario. Map comparison is an effective way to visualize these patterns across scenario outcomes (Visser and de Nijs Citation2006). (a) shows the common new urban areas that are projected under all four scenarios (red areas). These common areas account for 125 total km2 but represent about 17%, 30%, 31%, and 43% of the total newly urbanized area under the scenarios of current trend, smart growth, water-smart growth with moderate implementation, and water-smart growth with full implementation, respectively. Because these common areas are identified under various growth scenarios, they presumably reflect high probabilities to actually be urbanized in the future. panels (b) through (e) display the differences of newly urbanized areas (in green) between the scenarios of current trend (b), smart growth (c), water-smart growth with moderate implementation (d), and water-smart growth with full implementation (e). The differences in amount and location of projected urbanization beyond the urbanized areas that all four scenarios commonly predict are well illustrated in this series of maps.
Figure 7. Comparison of the newly urbanized areas under four scenarios. (See online color version for full interpretation.)
5. Discussion
5.1. Rethinking growth management in the US West
Another way to interpret smart growth is that it is water-smart growth with no implementation of water resources protection. Therefore, in the sequence of smart growth, water-smart growth with moderate implementation, and water-smart growth with full implementation, and reveal how the degree of policy implementation and water resources protection would affect urban land-use extent and layouts. Water-smart growth with moderate implementation and smart growth are oriented from different planning theories and emphases. Although the two scenarios result in very different spatial outputs, the total amounts of developed land in both scenarios in 2030 are very close. Meanwhile, the growth curves of these two scenarios are also very similar (). (c) and 7(d) shows the spatial differences of these two scenarios and how urban form can have different meanings and outcomes for water resources protection. Specifically, with a similar amount of land for new development, the spatial layout of the water-smart growth with moderate implementation scenario will have less impacts on water and water-related resources than water-smart growth. To put it differently, water-smart growth with moderate implementation demonstrates the feasibility of balancing the need to accommodate growth while simultaneously realizing the benefits of reducing human impacts on water-related resources.
Water-smart growth reflects the concept that “good planning doesn't just place limits on growth and development” (McKinney and Harmon Citation2002, 3). It still allows a reasonable amount of urban development but directs the spatial distribution of urban growth toward a more water-sustainable growth pattern. The water-smart growth with moderate implementation scenario sheds light on how cities in the US West can wisely allocate and direct growth to pursue multiple land and water-related benefits. The take-home message is that with a limited amount of land resources, we still have choices to make in deciding where to grow and can seek options for maintaining water resource integrity, which in turn could contribute economic and quality of life benefits to local communities. Location matters.
5.2. Agricultural land conversion
As with urbanization in many other areas of the US, most newly urbanized areas in the West come from converting agricultural lands (Alig, Kline, and Lichtenstein Citation2004). Results from this study show, as indicated in , agricultural lands are under great pressure from urban encroachment if growth continues in its current form or even in a more compact form. But by directing urban development away from the three types of water-related sensitive areas, more agricultural land, especially prime farmland, would be preserved. This is because high quality soil is a major attribute of prime farmland, and generally it overlaps with soil with high infiltration rates, wetlands, and groundwater recharge zones. Therefore, water-smart growth can protect not only water and water-related areas, but also prime farmland for agricultural activities.
5.3. Implications for water resources management
Under rapid urbanization, water resources can be severely impacted by conversion of land use and land cover. Replacing agriculture or/and natural land cover with impervious surface increases storm water flows, which result in increased flooding of waterways and canal systems. As indicated by many other studies, once the percentage of impervious area in a watershed reaches 30%, stream health is degraded, and storm water management encounters greater difficulties (Arnold and Gibbons Citation1996). Clearly, future growth patterns like the current trend in this study will increase challenges to not only the availability of land resources but also to associated flooding and storm water management. Conserving agricultural land and natural land cover is a critical component to prevent storm water management complications.
Also, new spatial configurations and shifts of land uses also lead changes of water uses. With agricultural land gradually diminishing, many areas in Cache County have experienced declining agricultural water use and increasing municipal and industrial water use (Utah Association of Conservation Districts & Utah Department of Agriculture and Food & Natural Resources Conservation Service Citation2011). Although agriculture likely will continue to be the major water use sector, under anticipated shifts from agricultural water use to residential and commercial water use, the capacity and efficiency of water infrastructure in both urban and agricultural environments will be pressured to meet changing water needs (Utah Association of Conservation Districts & Utah Department of Agriculture and Food & Natural Resources Conservation Service Citation2011).
5.4. Future improvements of the model
SLEUTH is a useful tool that integrates both spatial and temporal dimensions of urban growth processes. Nonetheless, as descriptive and illustrative as SLEUTH can be, it does not possess the explanatory power of revealing the causes of the spatial patterns it generates (Santé et al. Citation2010). The relaxation and simplicity of the SLEUTH model might overlook or underestimate some fundamental but unique characteristics of a particular locality (Santé et al. Citation2010). With respect to simulation results illustrating future alternatives, however, the accuracy and realism are overall acceptable for the purpose that it serves, which is to demonstrate the significance of different choices and how they reverberate over time in a system to produce varying results. The mechanism of land-use change, especially urban growth, is complicated and often heavily influenced by politics and economics, which is not something a regression or mathematical model can simply predict. But this factor does not limit SLEUTH's usefulness in answering ‘water-if’ types of questions or to contribute to better understanding urban dynamics and growth theories.
The concept and illustration of water-smart growth proposed in this study are valuable for both planning practice and modeling efforts, because they attempt to incorporate water components into growth modeling and serve as an important visualization aid. However, further demonstration and investigation of how water-smart growth affects particular water and land-use planning issues are needed. Examples would be linking SLEUTH/water-smart growth spatial outcomes to a watershed hydrological model like the Soil and Water Assessment Tool to gauge the effects on water quantity and quality, or coupling water withdrawal and consumption simulation models with land use and urban growth outputs.
6. Conclusion
This study is an exploration of the water-smart growth concept. It offers a general broad understanding of linking water and land in planning practices. To achieve more accurate predictions of urban growth and associated hydrological impacts, a more detailed analysis of site assessment, zoning policy, and local development plans would be needed. From an urban planning standpoint, the water-smart growth concept connects an aspect of water sustainability to the current land-use planning agenda by facilitating understanding of how land-use decisions impact water resources. From a water management standpoint, the urban water environment is a complex and interconnected human and natural system, requiring water managers to take a holistic and systematic approach to examine all aspects of the urban hydrologic cycle, including interactions between land, water, and the atmosphere within both the natural and built environments. From a public policy standpoint, since the urban water environment is a system that encompasses hydrology, ecology, culture, land use, design, infrastructure, society, law, and economy, effective application of water-smart growth should incorporate multiple perspectives and varied expertise in an interdisciplinary and collaborative framework.
Acknowledgements
This research was supported by NSF EPSCoR grant EPS 1208732 awarded to Utah State University, as part of the State of Utah Research Infrastructure Improvement Award. Additional support was provided by the Ecology Center at Utah State University in collaboration with the iUTAH EPSCoR Program. Any opinions, findings, and conclusions or recommendations expressed are those of the authors and do not necessarily reflect the views of the National Science Foundation. We thank two reviewers, Mark Brunson, Jeff Horsburgh, and Christopher Lant for reviewing an earlier version of the manuscript and for their insightful comments and suggestions.
Disclosure statement
No potential conflict of interest was reported by the authors.
Additional information
Funding
References
- Agarwal, Chetan, Glen M. Green, J. Morgan Grove, Tom P. Evans, and Charles M. Schweik. 2002. A Review and Assessment of Land-Use Change Models: Dynamics of Space, Time, and Human Choice. Vol. 297. Newtown Square, PA: US Department of Agriculture, Forest Service, Northeastern Research Station.
- Alig, Ralph J., Jeffrey D. Kline, and Mark Lichtenstein. 2004. “Urbanization on the US Landscape: Looking Ahead in the 21st Century.” The Social Aspects of Landscape Change: Protecting Open Space Under the Pressure of Development 69 (2–3): 219–234. doi:10.1016/j.landurbplan.2003.07.004.
- Arnold, Craig Anthony. 2005. “Is Wet Growth Smarter than Smart Growth?: The Fragmentation and Integration of Land Use and Water.” Environmental Law Reporter 35 (3): 10152–10178.
- Arnold, Chester L., and James C. Gibbons. 1996. “Impervious Surface Coverage: The Emergence of a Key Environmental Indicator.” Journal of the American Planning Association 62 (2): 243–258. doi:10.1080/01944369608975688.
- Bates, Sarah. 2011. Bridging the Governance Gap: Strategies to Integrate Water and Land Use Planning. Missoula, MO: Center for Natural Resources and Environmental Policy, The University of Montana.
- Briassoulis, Helen. 2000. Analysis of Land Use Change: Theoretical and Modeling Approaches. Morgantown, West Virginia: Regional Research Institute, West Virginia University.
- Brinson, Mark M. 1993. “Changes in the Functioning of Wetlands Along Environmental Gradients.” Wetlands 13 (2): 65–74. doi:10.1007/BF03160866.
- Cache Valley Regional Council. 2010. Envision Cache Valley Final Report and Toolkit. http://www.envisionutah.org/projects/project-archive/item/download/94_84b7a432a0297541ae421e665c93d0f1
- Carter, Nicole, Reid D. Kreutzwiser, and Rob C. de Loë. 2005. “Closing the Circle: Linking Land Use Planning and Water Management at the Local Level.” Land Use Policy 22 (1): 115–127.
- Chaudhuri, Gargi, and Keith C. Clarke. 2013. “The SLEUTH Land Use Change Model: A Review.” International Journal of Environmental Resources Research 1 (1): 88–104.
- Clarke, Keith C., and Leonard J. Gaydos. 1998. “Loose-Coupling a Cellular Automaton Model and GIS : Long-Term Urban Growth Prediction for San Francisco and Washington/Baltimore.” Journal of Geographical Information Science 12 (7): 699–714. doi:10.1080/136588198241617.
- Clarke, Keith C., S. Hoppen, and L. Gaydos. 1997. “A Self-Modifying Cellular Automaton Model of Historical Urbanization in the San Francisco Bay Area.” Environment and Planning B: Planning and Design 24 (2): 247–261.
- Dietzel, Charles, and Keith C. Clarke. 2007. “Toward Optimal Calibration of the SLEUTH Land Use Change Model.” Transactions in GIS 11 (1): 29–45.
- Downs, Anthony. 2007. “Smart Growth: Why We Discuss It More than We Do It.” Journal of the American Planning Association 71 (4): 367–378.
- Gigalopolis. 2001. “Project Gigalopolis, NCGIA.” http://www.ncgia.ucsb.edu/projects/gig/.
- Gillies, Robert R., Shih-Yu Wang, and Marty R. Booth. 2012. “Observational and Synoptic Analyses of the Winter Precipitation Regime Change over Utah.” Journal of Climate 25 (13): 4679–4698. doi:10.1175/JCLI-D-11-00084.1.
- Gober, Patricia. 2010. “Desert Urbanization and the Challenges of Water Sustainability.” Current Opinion in Environmental Sustainability 2 (3): 144–150. doi:10.1016/j.cosust.2010.06.006.
- Gober, Patricia, Kelli L. Larson, Ray Quay, Colin Polsky, Heejun Chang, and Vivek Shandas. 2013. “Why Land Planners and Water Managers Don't Talk to One Another and Why They Should!” Society and Natural Resources 26 (3): 356–364. doi:10.1080/08941920.2012.713448.
- Hutchinson, Charles F., Robert G. Varady, and Sam Drake. 2010. “Old and New: Changing Paradigms in Arid Lands Water Management.” In Water and Sustainability in Arid Regions, edited by Graciela Schneier-Madanes and Marie-Francoise Courel, 311–332. Dordrecht,Springer.
- Jackson, Richard H. 1977. “The Mormon Village: Genesis and Antecedents of the City of Zion Plan.” Brigham Young University Studies 17 (2): 223–240.
- Jackson, Richard H., and Robert L. Layton. 1976. “The Mormon Village: Analysis of a Settlement Type.” The Professional Geographer 28 (2): 136–141.
- Jantz, Claire A., Scott J. Goetz, David Donato, and Peter Claggett. 2010. “Designing and Implementing a Regional Urban Modeling System Using the SLEUTH Cellular Urban Model.” Computers, Environment and Urban Systems 34 (1): 1–16. doi:10.1016/j.compenvurbsys.2009.08.003.
- Jantz, Claire A., Scott J. Goetz, and Mary K. Shelley. 2004. “Using the SLEUTH Urban Growth Model to Simulate the Impacts of Future Policy Scenarios on Urban Land Use in the Baltimore – Washington Metropolitan Area.” Environment and Planning B: Planning and Design 31 (2): 251–271. doi:10.1068/b2983.
- Johnson, Craig W., and Susan Buffler. 2008. Riparian Buffer Design Guidelines Wildlife Habitat Functions on Agricultural Landscapes in the Intermountain West. Fort Collins, CO: USDA, Forest service, Rocky Mountain Research Station. http://www.fs.fed.us/rm/pubs/rmrs_gtr203.pdf
- Leao, Simone, Ian Bishop, and David Evans. 2004. “Simulating Urban Growth in a Developing Nation's Region Using a Cellular Automata-Based Model.” Journal of Urban Planning and Development 130 (3): 145–158.
- Leopold, Luna B. 1968. Hydrology for Urban Land Planning: A Guidebook on the Hydrologic Effects of Urban Land Use. Washington, DC, USA: US Government Printing Office.
- Leung, L. Ruby, Yun Qian, Xindi Bian, Warren M. Washington, Jongil Han, and John O. Roads. 2004. “Mid-Century Ensemble Regional Climate Change Scenarios for the Western United States.” Climatic Change 62 (1–3): 75–113.
- Li, Enjie, Joanna Endter-Wada, and Shujuan Li. 2015. “Linkages Between Water Challenges and Land Use Planning in Megacities.” Water Resources IMPACT 17 (1): 9–12.
- McKinney, Matthew, and Will Harmon. 2002. “Land Use Planning and Growth Management in the American West.” Lincoln Institute of Land Policy, Land Lines. http://www.lincolninst.edu/pubs/201_Land-Use-Planning-Growth-Management.
- Mitchell, Bruce. 2005. “Integrated Water Resource Management, Institutional Arrangements, and Land-Use Planning.” Environment and Planning A 37 (8): 1335–1352.
- Mitsch, William J., and James G. Gosselink. 2015. Wetlands. 5th ed. Hoboken, NJ: John Wiley and Sons.
- Novotny, Vladimir. 1999. “Diffuse Pollution from Agriculture – a Worldwide Outlook.” Water Science and Technology 39 (3): 1–13.
- Oguz, Hakan, A.G. Klein, and R. Srinivasan. 2007. “Using the SLEUTH Urban Growth Model to Simulate the Impacts of Future Policy Scenarios on Urban Land Use in the Houston-Galveston-Brazoria CMSA.” Research Journal of Social Sciences 2 (1): 72–82.
- Parera, Cecilia. 2005. “Mormon Town Planning: Physical and Social Relevance.” Journal of Planning History 4 (2): 155–174.
- Pontius Jr, Robert Gilmore, Wideke Boersma, Jean-Christophe Castella, Keith Clarke, Ton de Nijs, Charles Dietzel, Zengqiang Duan, Eric Fotsing, Noah Goldstein, and Kasper Kok. 2008. “Comparing the Input, Output, and Validation Maps for Several Models of Land Change.” The Annals of Regional Science 42 (1): 11–37.
- Rafiee, Reza, Abdolrassoul Salman Mahiny, Nematolah Khorasani, Ali Asghar Darvishsefat, and Afshin Danekar. 2009. “Simulating Urban Growth in Mashad City, Iran Through the SLEUTH Model (UGM).” Cities 26 (1): 19–26.
- Reisner, Marc. 1993. Cadillac Desert: The American West and Its Disappearing Water. New York: Penguin.
- Santé, Inés, Andrés M. García, David Miranda, and Rafael Crecente. 2010. “Cellular Automata Models for the Simulation of Real-World Urban Processes: A Review and Analysis.” Landscape and Urban Planning 96 (2): 108–122. doi:10.1016/j.landurbplan.2010.03.001.
- Solecki, William D., and Charles Oliveri. 2004. “Downscaling Climate Change Scenarios in an Urban Land Use Change Model.” Journal of Environmental Management 72 (1–2): 105–115. doi:10.1016/j.jenvman.2004.03.014.
- Tarlock, A. Dan, and Lora A. Lucero. 2002. “Connecting Land, Water, and Growth.” Land Use Law and Zoning Digest 54 (4): 3–9.
- Tayyebi, Amin, Phillips Christian Perry, and Amir Hossein Tayyebi. 2014. “Predicting the Expansion of an Urban Boundary Using Spatial Logistic Regression and Hybrid Raster–Vector Routines with Remote Sensing and GIS.” International Journal of Geographical Information Science 28 (4): 639–659.
- Tayyebi, Amin, and Bryan C. Pijanowski. 2014. “Modeling Multiple Land Use Changes Using ANN, CART and MARS: Comparing Tradeoffs in Goodness of Fit and Explanatory Power of Data Mining Tools.” International Journal of Applied Earth Observation and Geoinformation 28 (May): 102–116. doi:10.1016/j.jag.2013.11.008.
- Tayyebi, Amin, Bryan C. Pijanowski, Marc Linderman, and Claudio Gratton. 2014. “Comparing Three Global Parametric and Local Non-Parametric Models to Simulate Land Use Change in Diverse Areas of the World.” Environmental Modelling and Software 59 (September): 202–221. doi:10.1016/j.envsoft.2014.05.022.
- Tayyebi, Amin, Bryan C. Pijanowski, and Burak K. Pekin. 2015. “Land Use Legacies of the Ohio River Basin: Using a Spatially Explicit Land Use Change Model to Assess Past and Future Impacts on Aquatic Resources.” Applied Geography 57: 100–111.
- Trout, T.J., R.E. Sojka, and L.I. Okafor. 1990. “Soil Management.” In Management of Farm Irrigation Systems, edited by Glenn J. HoffmanTerry A. Howell Kenneth H. Solomon, 873–896. St. Joseph, MI: The American Society of Agricultural Engineers (ASAE).
- US Census Bureau. 2010. “Growth in Urban Population Outpaces Rest of Nation, Census Bureau Reports.” https://www.census.gov/newsroom/releases/archives/2010_census/cb12-50.html
- Utah Association of Conservation Districts & Utah Department of Agriculture and Food & Natural Resources Conservation Service. 2011. “Cache County Resource Assessment: Conserving Natural Resources for Our Future.” http://www.uacd.org/pdfs/RA/3-21%20Cache%20County%202010%20resource%20assessment.pdf
- Verburg, Peter H., Paul P. Schot, Martin J. Dijst, and A. Veldkamp. 2004. “Land Use Change Modelling: Current Practice and Research Priorities.” GeoJournal 61 (4): 309–324. doi:10.1007/s10708-004-4946-y.
- Verburg, Peter H., Welmoed Soepboer, A. Veldkamp, Ramil Limpiada, Victoria Espaldon, and Sharifah S.A. Mastura. 2002. “Modeling the Spatial Dynamics of Regional Land Use: The CLUE-S Model.” Environmental Management 30 (3): 391–405. doi:10.1007/s00267-002-2630-x.
- Visser, H., and T. de Nijs. 2006. “The Map Comparison Kit.” Environmental Modelling and Software 21 (3): 346–358. doi:10.1016/j.envsoft.2004.11.013.
- Williams, Evan Shane, and William R. Wise. 2006. “Hydrologic Impacts of Alternative Approaches to Storm Water Management and Land Development.” Journal of the American Water Resources Association 42 (2): 443–455.
- Winter, Thomas C., Judson W. Harvey, O. Lehn Franke, and William M. Alley. 1998. Ground Water and Surface Water: A Single Resource. Denver, CO: U.S. Geological Survey.
- Woltjer, Johan, and Niels Al. 2007. “Integrating Water Management and Spatial Planning.” Journal of the American Planning Association 73 (2): 211–222. doi:10.1080/01944360708976154.
- Yang, Xiaojun, and C.P. Lo. 2003. “Modelling Urban Growth and Landscape Changes in the Atlanta Metropolitan Area.” International Journal of Geographical Information Science 17 (5): 463–488. doi:10.1080/1365881031000086965.