
Abstract
The consideration of urban ecosystem services becomes increasingly important when planning compact cities. We implement a multi-objective optimization approach to support decision-makers in their efforts to develop green and dense cities. Embedded in a participatory process, the applied genetic algorithm allows us to assess spatial tradeoffs between urban ecosystem services and compactness. The optimization model is embedded in a decision support system for interactive analysis and communication of the results, facilitating the engagement of planners to support sustainable development. We illustrate the process in a multi-level case study in Singapore, a tropical city state aiming to pursue its distinct greening strategy. The whole process, from the problem definition to the obtained solution set, is evaluated using a feedback loop with stakeholders. Using this approach, we identify robust and best-suited urban development locations as well as temporal prioritization schemes evolving around future public transportation nodes.
1. Introduction
While the world’s urban population is rapidly growing, sustainable development increasingly depends on the successful management of urban growth (United Nations Citation2018). Coping with the growing number of urban dwellers challenges urban living conditions and calls for synthetic and holistic solutions (Acuto, Parnell, and Seto Citation2018). Densification processes have been suggested as an effective strategy to reduce urban sprawl (Wolsink Citation2016) and related environmental impacts (Stone, Hess, and Frumkin Citation2010). Planning for compactness, however, often entails the loss of urban green space (Haaland and van den Bosch Citation2015), negatively influencing the supply of ecosystem services (Grêt-Regamey et al. Citation2020) and ultimately well-being (Tzoulas et al. Citation2007), as well as urban sustainability (Elmqvist, Mcdonald, and Seto Citation2013) and resilience (McPhearson et al. Citation2015). Securing urban green spaces in the context of densification becomes increasingly difficult in compact cities (Wolsink Citation2016), as land is limited and this scarce resource is contested by competing land uses, such as housing, commercial interests, and transportation. On the one hand, the integrity and connectivity of natural and semi-natural ecosystems within the urban landscape are continuously threatened by new housing and infrastructure developments. On the other hand, the demand for services from such ecosystems is growing due to the growth of the urban population, as well as exacerbated environmental issues due to global warming and anthropogenic heat.
The conservation, restoration, and creation of urban ecosystem services (UES) are known to decrease the detrimental impact of cities, while creating a more resilient and livable space for city dwellers (Gómez-Baggethun and Barton Citation2013). The benefits that cities obtain from green spaces include drinkable water, microclimate regulation, food, biodiversity and recreation, to name but a few (Luederitz et al. Citation2015). By buffering against more frequent climate-related disturbances exacerbated by human activities such as flooding and heat waves, UES have an increased insurance value (Gómez-Baggethun and Barton Citation2013; McPhearson et al. Citation2015). At the same time, green spaces contribute to meeting recreational needs (Jim and Chen Citation2006), supporting physical and psychological health benefits (Mark et al. Citation2017), embodying aesthetic appreciation (Jim and Chen Citation2006), and allowing spiritual experience, sense of place (Daniel et al. Citation2012) and education (Wolsink Citation2016). Ultimately, all these benefits have been proven to contribute to better socio-economic conditions for urban communities (Tzoulas et al. Citation2007).
As the amount of green spaces decreases, the number and variety of interests for the multiple services provided by the remaining open spaces increase. Integrating UES into urban planning (Grêt-Regamey et al. Citation2017) thus increasingly requires the consideration of tradeoffs and conflicting or diverging values (Elmqvist, Mcdonald, and Seto Citation2013; Haaland and van den Bosch Citation2015). Several computational tools have been developed to support decisions in contexts of tradeoffs between single or multiple conflicting objectives. Approaches range from multi-criteria decision analysis (MCDA) to multi-objective optimization problems. Both approaches pursue different strategies to structure, search and evaluate solutions to decision problems (Jankowski, Fraley, and Pebesma Citation2014). Polasky et al. (Citation2008) studied tradeoffs between biodiversity and economic values regarding land use, utilizing a heuristic search algorithm. Grêt-Regamey et al. (Citation2017) applied a MCDA approach using a web-based platform to allocate a requested amount of urban development areas on the basis of UES and locational factors. Elliot et al. (Citation2019) used multi-objective integer linear programming to model scenarios that optimize UES supply. Seppelt and Voinov (Citation2002) used genetic algorithms for optimizing land use patterns. Holzkämper and Seppelt (Citation2007) showed that a genetic algorithm can be used to tradeoff habitat requirements of bird species and the cost-effectiveness of management actions for species conservation. They also demonstrated the applicability of the genetic algorithm to various spatial planning problems and identify tradeoffs between conflicting values.
Multi-objective optimization aims at solving combinatorial decision problems without giving undue weight to individual objectives or depending upon weighting schemes (Schwaab, Deb, Goodman, Kool, et al. Citation2018). Multi-objective genetic algorithms are stochastic optimization procedures that were developed to identify Pareto-optimal solutions. These solutions are optimal as the improvement of one objective leads to the decline of another objective (Pareto Citation1964). Several multi-objective optimization techniques have been developed, among them genetic or evolutionary algorithms. Genetic algorithms mimic natural selection and evolutionary principles. The Non-Dominated Sorting Genetic Algorithm NSGA-II (Deb et al. Citation2002) has been proven to be effective and efficient as a multi-objective search technique for various application scenarios (Bekele and Nicklow Citation2007). It’s described as a powerful and effective algorithm for multi-objective land use allocation optimization (Shaygan et al. Citation2014). The NSGA-II algorithm is widely applied in optimization processes in forest planning (Fotakis et al. Citation2012), spatial allocation of natural resources (Lautenbach et al. Citation2013; Jankowski, Fraley, and Pebesma Citation2014; Hu et al. Citation2015), renewable energy sources (Karakostas Citation2015), water management (Bekele and Nicklow Citation2007) or land use allocation (Fonseca et al. Citation2007; Cao et al. Citation2011; Shaygan et al. Citation2014; Schwaab, Deb, Goodman, Kool, et al. Citation2018). Problems evolving around the allocation of land uses are often complex because multiple stakeholders with conflicting goals and objectives are involved (Aerts et al. Citation2005). Multi-objective optimizations allow integration of various stakeholder perspectives (Schwaab, Deb, Goodman, Kool, et al. Citation2018), which makes optimization procedures well-suited for integration in participatory approaches. Participatory approaches comprise contributions of stakeholders and allow the consideration of a range of viewpoints (Elliot et al. Citation2019). They have been applied in UES research to map intangible cultural values in the marine spatial planning context (Klain and Chan Citation2012) or they have been used for the exploration of the social perceptions of conditions, trends, tradeoffs, and the future of UES to propose management strategies (Palomo et al. Citation2011). Participatory approaches have been found to add value to urban planning decision-making and stimulate discussions (Elliot et al. Citation2019) that can foster different visions and consensual management strategies (Palomo et al. Citation2011). Feedback loops represent the mechanism to integrate participatory information in the modeling process. For example, Boumans et al. (Citation2015) used successive cycles of observation, stakeholder engagement, mediated modeling, and model run updates in an iterative flow across multiple scales. Piemonti et al. (Citation2017) applied human-in-the-loop optimization methods using a web-based approach. Despite the number of UES studies including participatory aspects, there is still a gap in studies outside the EU and the US (Haase et al. Citation2014). Furthermore, a gap in multi-level studies (de Groot et al. Citation2010) has been identified, especially in a participatory context (Haase et al. Citation2014).
This paper describes a participatory multi-objective optimization approach to support minimization of UES loss and maximization of compactness in planning of new developments in cities. The approach is illustrated in a case study in Singapore, an island nation located in the tropical climate. We implement a stakeholder feedback loop to gain insights into local constraints and objectives. The framework is applied to simulate temporal development options evolving around future transportation nodes. We finally discuss how the integration of stakeholders in the modeling process facilitates the development of legitimate, credible and salient solutions for more sustainable development in cities.
2. Methods
2.1. Modeling framework
We rely on a multi-objective optimization approach developed by Schwaab, Deb, Goodman, Kool, et al. (Citation2018) to assist decision-making in urban planning. We trade off compact development of future residential areas with minimizing the loss of UES due to this development. Since the employed optimization procedure is stochastic, there is no guarantee that the true Pareto-optimal solutions can be identified. However, a set of non-dominated solutions is defined, which is usually close to, or even identical to, the Pareto-optimal solutions. To avoid any misunderstanding, we will henceforth speak of non-dominated solutions, when referring to the set of optimal solutions identified in the evolutionary optimization process. In the following, we present the modeling framework with the algorithmic structure of the genetic operators, and the implementation of the optimization procedure in a stakeholder process.
The two-dimensional land use matrix constituted the chromosome of the evolutionary optimization process being evolved within a vast space of candidate solutions. The input and output maps featured a resolution of 100 m. This pixel size was chosen to respect the approximate needed size for construction sites. Based upon population growth in previous decades, we estimated a hypothetical 10%-growth of the residential area until 2030.
We implemented the NSGA-II () using the Python (Rossum Citation1995) framework called DEAP Distributed Evolutionary Algorithms in Python (Fortin et al. Citation2012). The crossover and mutation methods shown to be most effective in the work of Schwaab, Deb, Goodman, Lautenbach, et al. (Citation2018) were consequently applied to our optimization problem. In the crossover procedure, the parent solutions are halved by drawing a line in randomly varying angles through the center of the polygon of our area of interest. The mutation process consists of a combination of uniform and biased mutation operators. The starting population size was chosen to be 100 analog to Schwaab, Deb, Goodman, Kool, et al. (Citation2018). To monitor the fitness after every iteration, the hypervolume indicator (Zitzler Citation1999) was used. The increase in hypervolume after 5,000 generations (i.e. iterations) was minor. Thus, 5,000 iterations were chosen for each run, resulting in a computation time of around 30 min per run. More details on the modification of the crossover and mutation operators can be found in Schwaab, Deb, and Goodman (Citation2017).
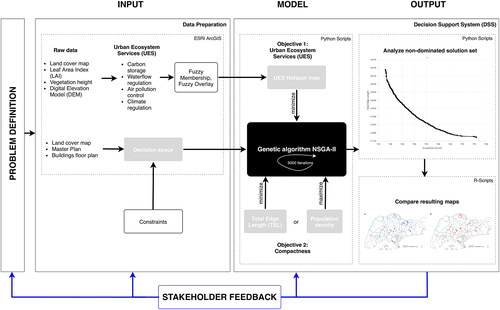
Figure 1. Flow chart of the optimization procedure. Problem Definition: together with stakeholders the problem and the required steps were defined. Input: The input consists of raw data processed to urban ecosystem service layers. These layers are combined to form the urban ecosystem service hotspot map. The decision space is mapped using Land cover, Master Plan and Buildings floor plan. Model: The core of the model (NSGA-II algorithm) minimizes loss of urban ecosystem services and maximizes compactness simultaneously. Output: After 5,000 iterations, the produced output data is further inspected. The resulting graphs and maps are analyzed and compared using the features of a decision support system. Stakeholder Feedback: The parameters are adapted depending on the feedback of the stakeholder. The iterative loop with the stakeholders is indicated in blue. Colour online.
In order to identify growth areas that are robust in terms of meeting both objectives in every section of the solution set of the non-dominated front, we produced an overlay of the pixel patterns. The pixel values of each solution on the non-dominated front were summed up and divided by the total quantity of pixel patterns to obtain the average per pixel. The mean value of every pixel determined its robustness measure. A threshold of 1 was applied to exclusively obtain pixels recurring in every solution and filter out the non-robust pixels. Among all the solution pixels, robust pixels can be considered as preferable by decision-makers. We chose two time steps (2020–2025 and 2025–2030) to account for a 10 year planning approach to urban development. The chosen time steps are for illustrative purposes only and do not directly correspond with time frames used by the local urban planning agencies. In each consecutive step, the optimization model was executed based on the new decision space resulting from the previous time step, constraining the decision space with fewer allocation possibilities.
We embedded the optimization process in an interactive participation procedure with local stakeholders in a three phases process (). The stakeholders consisted of representatives from science (Singapore-ETH Center (SEC), National University of Singapore (NUS), Swiss Federal Institute of Technology (ETH Zurich), Nanyang Technical University (NTU), and the Singapore-MIT Alliance for Research and Technology (SMART) as well as stakeholders from Singaporean government agencies (National Parks Board [NParks], Urban Redevelopment Authority [URA], Housing and Development Board [HDB], and Singapore Land Authority [SLA]). The stakeholders were keen, among other interests, to see the development of a tool to support the allocation of future development areas to maintain dense and green city structures. In the input phase (2018–2019), stakeholders had to identify key challenges related to urbanization. In the same workshops, the stakeholders identified essential UES related to the problem definition. The model phase (2019) focused on the development of the modeling process. We defined the objectives most suited to meet the problem definition. In the output phase (2019–2020), the results were shown to, and discussed with, the stakeholders. Stakeholders made suggestions for improving the approach, two of which are highlighted: (1) using a higher resolution for the optimization to help identify the distribution of new built-up locations per Planning Area (urban planning and census divisions of Singapore), (2) incorporating further datasets such as ecological connectivity and locations of future MRT-stations.
To facilitate the visual communication of the results, the optimization model was integrated in Singapore Views. Singapore Views is a 3D-4D GIS platform for visualizing, analyzing and presenting scientific geospatial data (Burkhard et al. Citation2018). It has been developed by the Collaborative Interactive Visualization and Analysis Laboratory (CIVAL) group at the Singapore ETH-Center (SEC).
2.2. Case study
Singapore is a tropical island city-state situated near the equator in Southeast Asia (). Its area covers about 724.2 km2 (SLA Citation2018) and the current population amounts to about 5.64 million inhabitants (Singstat Citation2018). With 7,804 people/km2 (Singstat Citation2018), Singapore has one of the highest population densities in the world. Singapore has a highly developed infrastructure and industry and is considered a compact, high-rise, and high-density city (Tan, Wang, and Sia Citation2013). For our case study, we used an estimated growth of 10% from 2020 until 2030 that would lead to an expected population size of approx. 6.28 million (Statista Citation2019).
The ecological transformation of Singapore can be divided into two phases: (1) deforestation, mainly in the 19th century, and (2) urbanization, beginning in the 19th century and lasting until today (Corlett Citation1992). Urbanization and modernization were the main drivers of a major shift in land use changes after the independence of Singapore in 1959 (Yee et al. Citation2011). Singapore’s extensive land reclamation programs have led to a growth of the land area of 24.5% in the past 60 years (SLA Citation2018), partially meeting the increasing demand for new land areas. Nevertheless, the rate of urbanization and growth of the built-up area raised the competition for urban space and increased pressure on green spaces. For instance, between 2007 and 2011 a population rise of 16% was observed, while vegetation cover had significantly declined by 7% (Tan Citation2016). The new town planning concept of Singapore successfully provides living space for a large and growing number of inhabitants. At the same time, the large-scale developments lead to a loss of extensive green areas. Despite the constant and successful efforts to green the city, the heavily modernized and densely developed urbanity characterizes the cityscape of Singapore. This urban form of multifunctional areas shapes the types and quantities of UES provided in Singapore in manifold respects.
The framework includes optimization runs on two scales, the national level of Singapore (100 m resolution) and the Planning Area level of Tengah (30 m resolution). The Planning Area of Tengah covers an area of 7 km2 and is reserved for future housing developments. In Tengah, we considered the influence of future Mass Rapid Transport (MRT) stations on the development patterns. Pixels overlapping with the approximate locations of future MRT-stations were turned into built-up area to simulate urban patches and act as urban growth seeds.
2.3. Data
The decision space was defined by comparing the residential area of the Master Plan 2014 of Singapore (URA Citation2014) with the building floor plan of Singapore for 2016 (Dissegna et al. Citation2019). The Master Plan describes the land use plan that guides Singapore's development over the next 10 to 15 years. Areas zoned as residential in the Master Plan are set aside for possible future developments. Using the residential area of the Master Plan 2014 as the basis for the possible decision space ensured congruence with the goals of the spatial planning authorities in Singapore. The decision space includes only unbuilt-up residential areas on the mainland of Singapore (, red) within the country’s boundary to date and thus consisted of 2,402 pixels. Offshore islands and future to be reclaimed land were not taken into account due to the lack of UES data at these locations.
Figure 2. Map of the island city-state of Singapore, located south of the Malayan Peninsula. The land cover map shows 6 land cover classes based on Dissegna et al. (Citation2019).
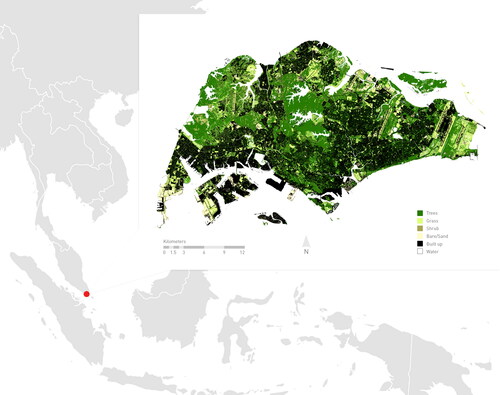
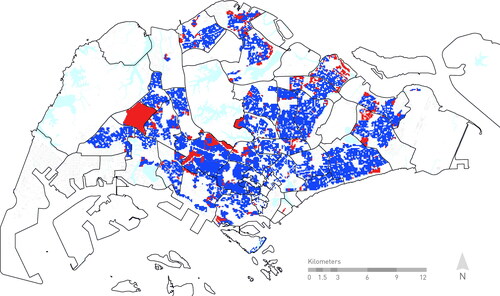
Figure 3. The total area zoned as residential area on the mainland of Singapore according to the Master Plan 2014 (blue and red pixels combined). The non-built-up residential area of Singapore’s mainland (red pixels) constitutes the decision space where allocation of new residential pixels is considered. Colour online.
The first objective of the optimization was to minimize the impact on UES, including air pollution control, carbon storage, climate control and water flow regulation. These UES were determined together with stakeholders and are considered highly relevant for Singapore (Grêt-Regamey et al. Citation2020). All UES maps were estimated using the land cover map () developed by Dissegna et al. (Citation2019), vegetation layers, Digital Elevation Model (DEM), and the Master Plan of Singapore. Details about the modeling of the four UES maps are provided in Appendix 1 (online supplemental data).
Areas where multiple UES are generated, were considered as UES hotspots (). The hotspots were calculated following a two-step procedure: In a first step, the individual UES maps were constructed using fuzzy membership in ArcMap (ESRI Citation2016). The fuzzy representation considers the indication of the strength of membership in a set (Bick, Bardhan, and Beaubois Citation2018). In a second step, under the assumption of equal importance of every UES (Larondelle and Lauf Citation2016), the layers were aggregated using a fuzzy sum overlay method. Fuzzy sum is a linear combination function producing results larger than the inputs (Bick, Bardhan, and Beaubois Citation2018).
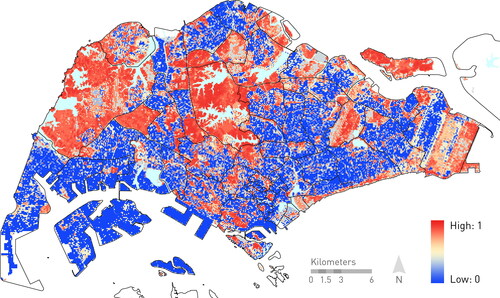
Figure 4. The urban ecosystem service hotspots were mapped using ecosystem service models of air pollution control, carbon storage, climate control and water flow regulation. Low values (blue) indicate low ecosystem service provision while high values (red) indicate high provision of multiple ecosystem services.
In order to operationalize the second objective, we selected two compactness measures. The first measure was based on the population density map. Using the population density increases the allocation likelihood of new residential areas in proximity to existing populated residential zones. The population density was calculated using the dataset Singapore Residents by Subzone and Type of Dwelling (MTI Citation2016). The mean population density per subzone was computed and distributed evenly among the residential pixels per subzone. As a second compactness measure, we applied the Total Edge Length (TEL) of all urbanized area. All edges neighboring any class other than urban were counted (Schwaab, Deb, Goodman, Kool, et al. Citation2018). Compactness indicators encourage the neighboring allocation of pixels of equal land use (Aerts et al. Citation2005), with low TEL corresponding to a compact urbanization pattern (Schwaab, Deb, and Goodman Citation2017). We ran the optimization model with the UES hotspot map and with both compactness measures, population density and TEL (see ). We compared the results using R (R Core Team Citation2018) and the R-Package diffeR (Pontius and Millones Citation2011) to calculate omission and commission pixels.
3. Results
Using the optimization procedure presented above, we allocated new residential areas in the decision space. We identified robust optimal locations that minimize UES losses and maximize closeness to high population density () as well as minimize UES losses and minimize TEL ().
Figure 5. Robust optimal solutions for possible new residential development areas in Singapore, based on (a) minimizing urban ecosystem service loss and maximizing areas of high population density (leading to 1,158 robust solution pixels in blue) or (b) minimizing urban ecosystem service loss and reducing the Total Edge Length of all built-up areas (resulting in 1,077 robust solution pixels in red). Colour online.
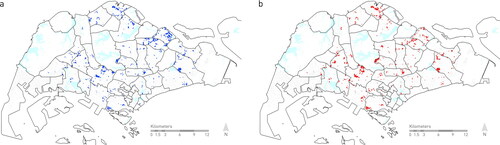
The results of both compactness measures show a concentration of new residential pixels around existing residential areas, strengthening the urban fabric. The similarity of the spatial pattern of the allocation maps in is quantitatively confirmed with an agreement indicator of 1,015, with an omission of 232, and commission of 229 pixels (Table 2.1, Appendix 2 [online supplemental data]).
Using the population density as a compactness measure leads to 1158 robust pixels and an increase of 3.03% in the overall built-up area compared to the current situation. TEL as a compactness measure leads to 1,077 robust pixels and an increase of 2.82% of the overall built-up area compared to the current situation ().
Table 1. Changes in the amount of urban (built-up) pixels in the present (Baseline 2020) compared with two allocation scenarios of new residential areas until 2030. The comparison is presented for two compactness measures, population density and Total Edge Length (TEL).
A deeper understanding of the influence of the compactness measures on the allocation procedure is provided when comparing the non-dominated fronts of both optimizations (, Appendix 3 [online supplemental data]). Exploring the tradeoffs between the two objectives UES and compactness in Planning Areas in Singapore shows certain areas to be more optimal than others for residential development, depending on the emphasis on minimizing the loss of UES (left side of the non-dominated front, ) or on compactness (right side of the non-dominated front, ). Punggol, for example, shows a large difference in the number of converted pixels between the left and the right side of the non-dominated front ().
Figure 6. Mapping the distribution of optimal new residential areas in the Planning Area of Punggol using the minimization of the two objectives loss of urban ecosystem services (UES) and Total Edge Length (TEL). (a) In the solution on the left side of the non-dominated front 122 pixels are converted to new residential areas. (b) In the right side of the non-dominated front 82 pixels are converted to new residential areas. The analysis of the solutions along the non-dominated front allows to launch a discussion about allocation possibilities among decision-makers.
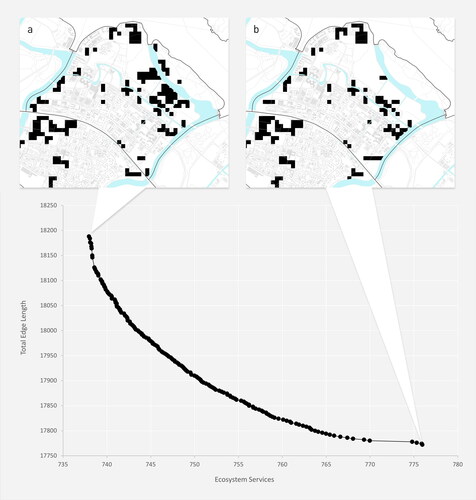
An increase of 26.67% on the left side () and an increase of 18.22% on the right side of the front () was simulated for built-up areas in Punggol until 2030 compared to the Baseline (2020) (). This difference indicates that reaching a compact development is difficult, but minimizing the loss of UES is more achievable in Punggol compared to other Planning Areas.
Table 2. Comparison of the amount of pixels allocated to new residential areas between the present situation (Baseline 2020) and the left side of the non-dominated front or the right side of the non-dominated front in Punggol until 2030.
As not all development areas will be planned and realized at once, we investigated the use of an allocation by time steps to prioritize areas for development. The model simulation was partitioned into two steps, namely time step 1 referring to 2020–2025 and time step 2 referring to 2025–2030 (). In time step 2, the amount of options in the decision space is reduced, increasing the pressure on the remaining free areas. The development areas (1) or (3), on the one hand, illustrate clusters of residential pixels that get converted in time step 1 (, red). The area of (2) or (4) as well as (5), on the other hand, are only considered under increasing pressure (, blue).
Figure 7. The allocation of new residential areas modeled in two time steps: in time step 1 from 2020-2025, there were 622 new residential pixels allocated (red), and in time step 2 from 2025-2030, there were 622 new residential pixels allocated (blue). Areas in (1) or (3) predominantly get converted in time step 1, whereas areas in (2) or (4) as well as (5) are predominantly converted in time step 2. Colour online.
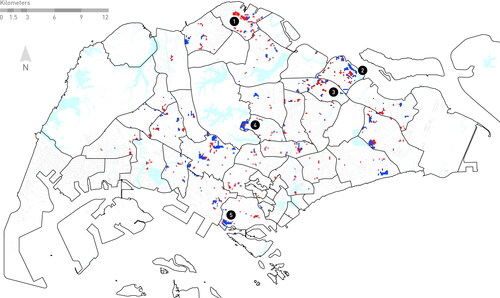
To analyze the tradeoffs between UES and compactness values in different time steps, their non-dominated fronts were compared (, Appendix 4 [online supplemental data]). The options of retaining UES decrease considerably with time, while the decrease is less pronounced for compactness. The successive optimization was further applied to the Planning Area of Tengah in a higher temporal resolution of ten time steps. The result of the map on Planning Area level in shows that the very southern part of Tengah was prioritized, similarly to the national-level map. In both the national- and Planning Area-level maps, the remaining lower priority pixels are scattered around the boundary of the Planning Area of Tengah ( and ).
Figure 8. Temporal urban growth simulation patterns in the Planning Area of Tengah from black (pixels converted in the first time step, higher in priority) to bright gray (pixels converted in the last time step, lower in priority). (a) The temporal urban growth pattern simulated on a blank space, without consideration of future transportation nodes. (b) The temporal urban growth pattern simulated including approximate locations of future transportation nodes as urban growth seeds (blue points). Colour online.
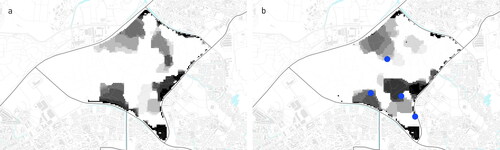
The time-partitioned model runs of the optimization in Tengah without transportation nodes () and with transportation nodes () revealed significant differences in the urban growth patterns (from black to bright gray). In , the urban growth simulation follows a pattern of optimal minimization of ES loss and maximization of compactness. This leads to new residential patches that dock onto the existing built-up area around the boundary of Planning Area Tengah. Whereas in new residential patches incrementally expand toward areas with low UES values and in proximity to future MRT-stations. This case study simulates how future transportation nodes could be combined with UES information to simulate hypothetical urban growth patterns.
4. Discussion
Our multi-objective optimization approach helped to successfully identify urban development areas () that meet the requirements of dense and green development efforts in a case study in Singapore. To our knowledge, this is the first study that shows that targeting tradeoffs between minimizing UES losses and maximizing urban compactness can aid in prioritizing urban development locations. We propose successive optimization model runs to obtain time steps simulating a prioritization scheme for the development of new residential areas (). Implementing the suggestions of stakeholders, we linked future transportation nodes with the optimization model to investigate their effect on urban growth simulations (). We argue that the presented collaborative workflow can be applied to a broad variety of spatial decision problems. In particular, integrated into a participatory process, such an iterative solution-finding process (Elliot et al. Citation2019) can support negotiation of sustainable development goals (Seppelt et al. Citation2013). The stakeholder feedback loop can be used to gain innovative insights on boundary conditions or constraints, such as scarcity of the decision space and its effect on the solution set. This allows a learning process by the stakeholders (Grêt-Regamey et al. Citation2013), while including their preferences in the modeling process (Stewart, Janssen, and Van Herwijnen Citation2004). In dense cities with strong resource constraints, the quantification of tradeoffs (e.g. between UES and compactness) will gain importance as urbanization processes are expected to increase over time.
While we identified new optimal locations for development, we did not consider other densification possibilities such as (1) conversion of former industrial sites, or (2) building high-rise instead of low-density buildings, as described in Haaland and van den Bosch (Citation2015). These densification procedures have less impact on existing UES and should therefore be considered first when development efforts are pursued. However, if the circumstances pressure decision-makers to develop new buildings in non-built-up areas, a deliberate and data-driven allocation as proposed in our work is crucial, even more so when taking into account the high degree of irreversibility of the urbanization process (Haaland and van den Bosch Citation2015). This is essential in Singapore with its new town planning strategy and current high level of greenery. But it could be even more important for other compact cities that are facing drastic declines in UES (Haaland and van den Bosch Citation2015).
While we used two objectives to define our spatial optimization problem, addressing complex questions in urban planning usually requires the consideration of more than two dimensions. However, increasing the number of objectives is known to restrict the use of simple visualization techniques for decision-makers (Blasco et al. Citation2008). This can hinder valuable feedback from stakeholders and impede the decision-makers’ choice (Blasco et al. Citation2008). Nevertheless, considering more objectives seems promising and requires further investigation. As suggested by stakeholders, we highlight the possibility of including ecological connectivity. Habitat corridors connecting green spaces are known to provide a high value for biodiversity and intact ecosystems (van Strien and Grêt-Regamey Citation2016), especially in compact cities such as Singapore, where the integrity of habitats is threatened by settlements and roads. To ensure that new residential developments do not disrupt vital habitat corridors, maps of ecological connectivity could be taken into account.
The drivers of the UES modeled in this work obey very different spatio-temporal dynamics, but also the dependencies and interactions among the drivers of the UES change with varying dynamics (Stürck, Schulp, and Verburg Citation2015). These dynamics are expected to change with future land use changes (Stürck, Schulp, and Verburg Citation2015) and climate change (Shaw et al. Citation2011). Awareness of the simplification of these dynamics in the applied UES models is essential in the interpretation of the results. Further, the modeling includes uncertainties stemming from various sources such as errors of sensor measurement or incomplete simulations of computational models (Goh and Tan Citation2009). To improve the reliability of the results, modeling uncertainty or external drivers such as climate change, could be integrated into an assessment involving different future scenarios (Lautenbach et al. Citation2013). The robustness assessment presented in this work, which selects locations that score highly on both axes (compactness and UES), could thus be considered as a first step in this direction. The robustness measure could be used to assess the impact of other driving forces on urban development, facilitating the generation of more resilient solutions (McPhearson et al. Citation2015).
Scales are known to significantly influence spatial modeling results (Gotway and Young Citation2002) and several authors have called for analyses at multiple scales (Seppelt et al. Citation2013; de Groot et al. Citation2010; Larondelle and Lauf Citation2016). Upon request by the stakeholders, the resolution of 100 m for the city-wide analysis was expanded by a 30 m resolution analysis at the Planning-Area scale. However, we only compared our results visually without an in-depth quantitative analysis. A deeper investigation of the issues originating from cross-scale approaches has been called for in studies on spatial multi-objective optimization (Seppelt et al. Citation2013).
A lot of real-world systems, including urbanization, feature time-varying components with changing conditions operating in a constant state of flux (Goh and Tan Citation2009). The time steps applied in this work ( and ) only partially account for such changes. Multiple time-partitioned runs of optimizations allow an update of the objective maps after every time step, thereby approximating toward more dynamic and realistic temporal representation. A high degree of integration of stakeholder feedback as suggested in the work of Piemonti et al. (Citation2017) provides the basis for an important next step in research.
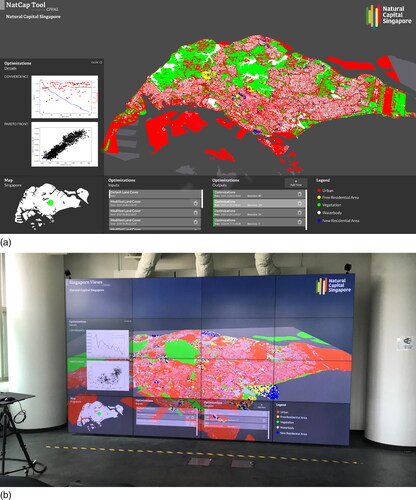
Integrating multiple stakeholders into the optimization process calls for interactive decision support systems (DSS) to be used in planning processes (Stewart, Janssen, and Van Herwijnen Citation2004). We integrated our optimization model into the stand-alone DSS Singapore Views (). The dialogue with the stakeholders is simplified as outputs can be discussed and viewed in a realistic 3D-space of Singapore, aiming toward a data-driven DSS for informed decision-making. The usage of such a DSS can raise awareness of UES integration in urban planning as shown by Grêt-Regamey et al. (Citation2017).
Figure 9. (a) The multi-objective optimization was integrated into the interactive 3D GIS platform Singapore Views and (b) displayed in the Value Lab Asia at the Singapore ETH-Center (SEC).
An in-depth decision-making analysis using an interactive DSS with effective visuals can help identify key areas of the solution set as well as preferred solutions within the key areas (Jankowski, Fraley, and Pebesma Citation2014). Enabling a participatory solution-finding process can support the understanding of land use impacts and tradeoffs, essentially leading to innovative insights and paving the way for more effective decision-making (Haase et al. Citation2014). For example, Elliot et al. (Citation2019) illustrated a proof-of-concept of a participatory spatial optimization process to explore land use compositions that maximize UES. Concurrent with Elliot et al. (Citation2019), we recommend a participatory approach to integrate local expert knowledge and engage stakeholders in the modeling process.
Similarly to Schwaab, Deb, Goodman, Kool, et al. (Citation2018), we were able to show that multi-objective optimization using two objectives can be applied to simulate development options. While Schwaab, Deb, Goodman, Kool, et al. (Citation2018) focus on agricultural productivity and soil loss to make conclusions about zoning practices, we showed that the method is adaptable to UES and residential development. A similar optimization approach was implemented by Yoon, Kim, and Lee (Citation2019) using NSGA-II to optimize cooling effect, connectivity and cost for urban greening in a hypothetical landscape at a neighborhood scale. Their results showed synergistic relationships between cooling and connectivity. The resulting optimal plans are sought to contribute to the feedback loop with stakeholders, as suggested in our work. Yoon, Kim, and Lee (Citation2019) aim to maximize UES through the allocation of new green space, while we target minimizing the UES loss due to future developments. The merits of our study are embedding of the multi-objective optimization into a participatory approach with a feedback loop. To our knowledge, this is the first study to use this method to develop temporal multi-level urban growth simulations tied to future transportation nodes to support the allocation of new residential areas.
5. Conclusion
Participatory optimization procedures have the potential to support sustainable land allocation processes. Rather than providing a single solution, the optimization approach delivers a solution set, supporting a negotiation process of conflicting demands for the remaining green areas in dense cities. As shown in this work, the method delivers geographically explicit development options and it can be applied to develop temporal multi-level urban growth simulations linked to future transportation nodes. In order to provide clear and coherent visual information on complex development challenges, we embedded our approach in an interactive 3 D visualization DSS to support the collaborative and iterative solution-finding process. Exhausting the full potential of these advancements toward participatory problem-solving can reveal salient and credible urban development prioritization schemes that were not initially apparent. Such an approach not only fosters the acquisition of interdisciplinary knowledge but allows tradeoffs between UES and densification efforts to be addressed explicitly, which is pivotal for shaping the growing cities across the world.
Supplemental Material
Download MS Word (226.9 KB)Acknowledgments
This research was supported by the National Research Foundation, Prime Minister’s Office, Singapore under its Campus for Research Excellence and Technological Enterprise (CREATE) Programme (NRF2016-ITC001-013). We are grateful for the support of Dr. Marcelo Galleguillos Torres in the spatial modeling of the UES maps and the support of Ralph Sonderegger in the graphical design of the maps and figures. We especially thank Singapore’s government agencies for their collaboration and valuable expertise. Finally, we would like to thank the team members of Natural Capital Singapore for their much appreciated inputs and support.
Disclosure statement
The authors declare that there is no conflict of interest regarding the publication of this article.
Supplemental data
Supplemental data for this article can be accessed here.
Additional information
Funding
References
- Acuto, Michele, Susan Parnell, and Karen C. Seto. 2018. “Building a Global Urban Science.” Nature Sustainability 1 (1): 2–4. doi:https://doi.org/10.1038/s41893-017-0013-9.
- Aerts, Jeroen C. J. H., Marjan Van Herwijnen, Ron Janssen, and Theodor J. Stewart. 2005. “Evaluating Spatial Design Techniques for Solving Land-Use Allocation Problems.” Journal of Environmental Planning and Management 48 (1): 121–142. doi:https://doi.org/10.1080/0964056042000308184.
- Asner, Gregory P., Jonathan M. O. Scurlock, and Jeffrey A. Hicke. 2003. “Global Synthesis of Leaf Area Index Observations.” Global Ecology and Biogeography 12 (3): 191–205. doi:https://doi.org/10.1046/j.1466-822X.2003.00026.x.
- Bekele, Elias G., and John W. Nicklow. 2007. “Multi-Objective Automatic Calibration of SWAT Using NSGA-II.” Journal of Hydrology 341 (3–4): 165–176. doi:https://doi.org/10.1016/j.jhydrol.2007.05.014.
- Bick, Ian Avery, Ronita Bardhan, and Terry Beaubois. 2018. “Applying Fuzzy Logic to Open Data for Sustainable Development Decision-Making: A Case Study of the Planned City Amaravati.” Natural Hazards 91 (3): 1317–1339. doi:https://doi.org/10.1007/s11069-018-3186-2.
- Blasco, Xavier, Juan Manuel Herrero, Javier Sanchis, and Miguel Martínez. 2008. “A New Graphical Visualization of N-Dimensional Pareto Front for Decision-Making in Multiobjective Optimization.” Information Sciences 178 (20): 3908–3924. doi:https://doi.org/10.1016/j.ins.2008.06.010.
- Boumans, Roelof, Joe Roman, Irit Altman, and Les Kaufman. 2015. “The Multiscale Integrated Model of Ecosystem Services (MIMES): Simulating the Interactions of Coupled Human and Natural Systems.” Ecosystem Services 12: 30–41. doi:https://doi.org/10.1016/j.ecoser.2015.01.004.
- Burkhard, Remo, Jan Perhac, Shiho Asada, Anastasia Troyanov, Sailin Zhong, Yingying Jiang, and Simon Schubiger. 2018. “4D-UX: User Experience Design Principles for Coupling Multidimensional Visual Representations in Presentations.” Paper presented at the 2018 22nd International Conference Information Visualisation (IV), Fisciano, Italy, July 10–13. doi:https://doi.org/10.1109/iV.2018.00071.
- Cao, Kai, Michael Batty, Bo Huang, Yan Liu, Le Yu, and Jiongfeng Chen. 2011. “Spatial Multi-Objective Land Use Optimization: Extensions to the Non-Dominated Sorting Genetic Algorithm-II.” International Journal of Geographical Information Science 25 (12): 1949–1969. doi:https://doi.org/10.1080/13658816.2011.570269.
- Corlett, Richard T. 1992. “The Ecological Transformation of Singapore, 1819-1990.” Journal of Biogeography 19 (4): 411–420. doi:https://doi.org/10.2307/2845569.
- Daniel, Terry C., Andreas Muhar, Arne Arnberger, Olivier Aznar, James W. Boyd, Kai M. A. Chan, Robert Costanza, et al. 2012. “Contributions of Cultural Services to the Ecosystem Services Agenda.” Proceedings of the National Academy of Sciences of the United States of America 109 (23): 8812–8819. doi:https://doi.org/10.1073/pnas.1114773109.
- Deb, Kalyanmoy, Samir Agrawal, Amrit Pratap, and T. Meyarivan. 2002. “A Fast and Elitist Multiobjective Genetic Algorithm.” IEEE Transactions on Evolutionary Computation 6 (2): 182–197. doi:https://doi.org/10.1109/4235.996017.
- de Groot, Rudolf S., Rob Alkemade, Leon Braat, Lars Hein, and Louise Willemen. 2010. “Challenges in Integrating the Concept of Ecosystem Services and Values in Landscape Planning, Management and Decision Making.” Ecological Complexity 7 (3): 260–272. doi:https://doi.org/10.1016/j.ecocom.2009.10.006.
- Dissegna Maria Angela, Tiangang Yin, Shanshan Wei, Dan Richards, and Adrienne Grêt-Regamey. 2019. “3-D Reconstruction of an Urban Landscape to Assess the Influence of Vegetation in the Radiative Budget.” Forests 10 (8): 700. doi:https://doi.org/10.3390/f10080700.
- Elliot, Thomas, Alexandre Bertrand, Javier Babí Almenar, Claudio Petucco, Vânia Proença, and Benedetto Rugani. 2019. “Spatial Optimisation of Urban Ecosystem Services through Integrated Participatory and Multi-Objective Integer Linear Programming.” Ecological Modelling 409: 108774. doi:https://doi.org/10.1016/j.ecolmodel.2019.108774.
- Elmqvist, Thomas, Robert I. Mcdonald, and Karen C. Seto. 2013. Urbanization, Biodiversity and Ecosystem Services: Challenges and Opportunities: A Global Assessment. Dordrecht: Springer.
- ESRI. 2016. ArcGIS Desktop: Release 10.5. Redlands, CA: Environmental Systems Research Institute.
- Fonseca, Carlos M., Paulo A. Condado, Dilip Datta, Fernando G. Lobo, Julia Seixas, and Kalyanmoy Deb. 2007. “Multi-Objective Evolutionary Algorithm for Land-Use Management Problem.” International Journal of Computational Intelligence Research 3 (4): 1–24. doi:https://doi.org/10.5019/j.ijcir.2007.118.
- Fortin, Félix-Antoine, François-Michel De Rainville, Marc-André Gardner, Marc Parizeau, and Christian Gagné. 2012. “DEAP: Evolutionary Algorithms Made Easy.” Journal of Machine Learning Research 13: 2171–2175.
- Fotakis, Dimitris G., Epameinondas Sidiropoulos, Dimitrios Myronidis, and Kostas Ioannou. 2012. “Spatial Genetic Algorithm for Multi-Objective Forest Planning.” Forest Policy and Economics 21: 12–19. doi:https://doi.org/10.1016/j.forpol.2012.04.002.
- Goh, Chi-Keong, and Kay Chen Tan. 2009. “Evolutionary Multi-Objective Optimization in Uncertain Environments.” In Issues and Algorithms, edited by Prof. Janusz Kacprzyk, 125–152. Berlin, Heidelberg: Springer. doi:https://doi.org/10.1007/978-3-540-95976-2_5.
- Gómez-Baggethun, Erik, and David N. Barton. 2013. “Classifying and Valuing Ecosystem Services for Urban Planning.” Ecological Economics 86: 235–245. doi:https://doi.org/10.1016/j.ecolecon.2012.08.019.
- Gotway, Carol A., and Linda J. Young. 2002. “Combining Incompatible Spatial Data.” Journal of the American Statistical Association 97 (458): 632–648. doi:https://doi.org/10.1198/016214502760047140.
- Grêt-Regamey, Adrienne, Jürg Altwegg, Elina A. Sirén, Maarten J. van Strien, and Bettina Weibel. 2017. “Integrating Ecosystem Services into Spatial Planning: A Spatial Decision Support Tool.” Landscape and Urban Planning 165: 206–219. doi:https://doi.org/10.1016/j.landurbplan.2016.05.003.
- Grêt-Regamey, Adrienne, Sibyl H. Brunner, Juerg Altwegg, Marc Christen, and Peter Bebi. 2013. “Integrating Expert Knowledge into Mapping Ecosystem Services Tradeoffs for Sustainable Forest Management.” Ecology and Society 18 (3): 34–55. doi:https://doi.org/10.5751/ES-05800-180334.
- Grêt-Regamey, Adrienne, Marcelo Galleguillos-Torres, Angela Dissegna, and Bettina Weibel. 2020. “How Urban Densification Influences Ecosystem Services: A Comparison between a Temperate and a Tropical City.” Environmental Research Letters 15 (7): 075001. doi:https://doi.org/10.1088/1748-9326/ab7acf.
- Haaland, Christine, and Cecil Konijnendijk van den Bosch. 2015. “Challenges and Strategies for Urban Green-Space Planning in Cities Undergoing Densification: A Review.” Urban Forestry and Urban Greening 14 (4): 760–771. doi:https://doi.org/10.1016/j.ufug.2015.07.009.
- Haase, Dagmar, Neele Larondelle, Erik Andersson, Martina Artmann, Sara Borgström, Jürgen Breuste, Erik Gomez-Baggethun, et al. 2014. “A Quantitative Review of Urban Ecosystem Service Assessments: Concepts, Models, and Implementation.” Ambio 43 (4): 413–433. doi:https://doi.org/10.1007/s13280-014-0504-0.
- Holzkämper, Annelie, and Ralf Seppelt. 2007. “A Generic Tool for Optimising Land-Use Patterns and Landscape Structures.” Environmental Modelling and Software 22 (12): 1801–1804. doi:https://doi.org/10.1016/j.envsoft.2007.02.008.
- Hu, Haitang, Bojie Fu, Yihe Lü, and Zhenmin Zheng. 2015. “SAORES: A Spatially Explicit Assessment and Optimization Tool for Regional Ecosystem Services.” Landscape Ecology 30 (3): 547–560. doi:https://doi.org/10.1007/s10980-014-0126-8.
- Jackson, Robert B., Josep Canadell, James Ehleringer, Harold Moonye, Osvaldo Sala, and E.-Detlef Schulze. 1996. “A Global Analysis of Root Distributions for Terrestrial Biomes.” Oecologia 108 (3): 389–411. doi:https://doi.org/10.1007/BF00333714.
- Janhäll, Sara. 2015. “Review on Urban Vegetation and Particle Air Pollution - Deposition and Dispersion.” Atmospheric Environment 105: 130–137. doi:https://doi.org/10.1016/j.atmosenv.2015.01.052.
- Jankowski, Piotr, Grant Fraley, and Edzer Pebesma. 2014. “An Exploratory Approach to Spatial Decision Support.” Computers, Environment and Urban Systems 45: 101–113. doi:https://doi.org/10.1016/j.compenvurbsys.2014.02.008.
- Jim, Chi Yung, and Wendy Y. Chen. 2006. “Recreation-Amenity Use and Contingent Valuation of Urban Greenspaces in Guangzhou.” Landscape and Urban Planning.” 75 (1–2): 81–96. doi:https://doi.org/10.1016/j.landurbplan.2004.08.008.
- Karakostas, Spiros. 2015. “Multi-Objective Optimization in Spatial Planning: Improving the Effectiveness of Multi-Objective Evolutionary Algorithms (Non-Dominated Sorting Genetic Algorithm II).” Engineering Optimization 47 (5): 601–621. doi:https://doi.org/10.1080/0305215X.2014.908870.
- Klain, Sarah C., and Kai M. A. Chan. 2012. “Navigating Coastal Values: Participatory Mapping of Ecosystem Services for Spatial Planning.” Ecological Economics 82: 104–113. doi:https://doi.org/10.1016/j.ecolecon.2012.07.008.
- Larondelle, Neele, and Steffen Lauf. 2016. “Balancing Demand and Supply of Multiple Urban Ecosystem Services on Different Spatial Scales.” Ecosystem Services 22: 18–31. doi:https://doi.org/10.1016/j.ecoser.2016.09.008.
- Lautenbach, Sven, Martin Volk, Michael Strauch, Gerald Whittaker, and Ralf Seppelt. 2013. “Optimization-Based Trade-Off Analysis of Biodiesel Crop Production for Managing an Agricultural Catchment.” Environmental Modelling and Software 48 (2013): 98–112. doi:https://doi.org/10.1016/j.envsoft.2013.06.006.
- Luederitz, Christopher, Ebba Brink, Fabienne Gralla, Verena Hermelingmeier, Moritz Meyer, Lisa Niven, Lars Panzer, et al. 2015. “A Review of Urban Ecosystem Services: Six Key Challenges for Future Research.” Ecosystem Services 14: 98–112. doi:https://doi.org/10.1016/j.ecoser.2015.05.001.
- Mark, J., Owen Douglas, Mick Lennon, and Mark Scott. 2017. “Green Space Benefits for Health and Well-Being: A Life-Course Approach for Urban Planning, Design and Management.” Cities 66: 53–62.
- Martin, Adam R., and Sean C. Thomas. 2011. “A Reassessment of Carbon Content in Tropical Trees.” PLoS One 6 (8): e23533. doi:https://doi.org/10.1371/journal.pone.0023533.
- McPhearson, Timon, Erik Andersson, Thomas Elmqvist, and Niki Frantzeskaki. 2015. “Resilience of and through Urban Ecosystem Services.” Ecosystem Services 12: 152–156. doi:https://doi.org/10.1016/j.ecoser.2014.07.012.
- MTI. 2016. Singapore Residents by Subzone and Type of Dwelling, June 2016. Singapore: Ministry of Trade and Industry, Department of Statistics.
- Palomo, Ignacio, Berta Martín-López, Cesar López-Santiago, and Carlos Montes. 2011. “Participatory Scenario Planning for Protected Areas Management under the Ecosystem Services Framework: The Doñana Social-Ecological System in Southwestern Spain.” Ecology and Society 16 (1): 23–56. doi:https://doi.org/10.5751/ES-03862-160123.
- Pareto, Vilfredo. 1964. Cours D’économie Politique. Vol. 1. Lausanne: Librairie Droz.
- Piemonti, Adriana Debora, Babbar Meghna‐Sebens, Snehasis Mukhopadhyay, and Austin Kleinberg. 2017. “Water Resources Research.” Water Resources Research 53 (5): 4303–4326. doi:https://doi.org/10.1111/j.1752-1688.1969.tb04897.x.
- Polasky, Stephen, Erik Nelson, Jeff Camm, Blair Csuti, Paul Fackler, Eric Lonsdorf, Claire Montgomery, et al. 2008. “Where to Put Things? Spatial Land Management to Sustain Biodiversity and Economic Returns.” Biological Conservation 141 (6): 1505–1524. doi:https://doi.org/10.1016/j.biocon.2008.03.022.
- Pontius, Robert Gilmore, and Marco Millones. 2011. “Death to Kappa: Birth of Quantity Disagreement and Allocation Disagreement for Accuracy Assessment.” International Journal of Remote Sensing 32 (15): 4407–4429. doi:https://doi.org/10.1080/01431161.2011.552923.
- Proulx, Raphaël, Guillaume Rheault, Laurianne Bonin, Irene Torrecilla Roca, Charles A. Martin, Louis Desrochers, and Ian Seiferling. 2015. “How Much Biomass Do Plant Communities Pack per Unit Volume?” Peerj 3: e849. doi:https://doi.org/10.7717/peerj.849.
- R Core Team. 2018. R: A Language and Environment for Statistical Computing. Vienna, Austria: R Foundation for Statistical Computing.
- Rossum, Guido Van. 1995. “Python Software Foundation. Python Language Reference, Version 2.7.” http://www.python.org
- Schwaab, Jonas, Kalyanmoy Deb, and Erik D. Goodman. 2017. “How to Choose the Right Planning Horizon? Using Multi-Objective Optimization to Support Urban Planning.” Paper presented at the 22nd International Congress on Modelling and Simulation, Hobart, Tasmania, Australia, December 3–8.
- Schwaab, Jonas, Kalyanmoy Deb, Erik Goodman, Sander Kool, Sven Lautenbach, Andrea Ry, Maarten J. Van Strien, and Adrienne Grêt-Regamey. 2018. “Using Multi-Objective Optimization to Secure Fertile Soils across Municipalities.” Applied Geography 97: 75–84. doi:https://doi.org/10.1016/j.apgeog.2018.06.001.
- Schwaab, Jonas, Kalyanmoy Deb, Erik Goodman, Sven Lautenbach, Maarten J. van Strien, and Adrienne Grêt-Regamey. 2018. “Improving the Performance of Genetic Algorithms for Land-Use Allocation Problems.” International Journal of Geographical Information Science 32 (5): 907–930. doi:https://doi.org/10.1080/13658816.2017.1419249.
- Schwarz, Nina, Annette Bauer, and Dagmar Haase. 2011. “Assessing Climate Impacts of Planning Policies: An Estimation for the Urban Region of Leipzig (Germany).” Environmental Impact Assessment Review 31 (2): 97–111. doi:https://doi.org/10.1016/j.eiar.2010.02.002.
- Seppelt, Ralf, Sven Lautenbach, Martin Volk, Peter H. Verburg, Ole Mertz, Karl-Heinz Erb, and Giovana Espindola. 2013. “Identifying Trade-Offs between Ecosystem Services, Land Use, and Biodiversity: A Plea for Combining Scenario Analysis and Optimization on Different Spatial Scales.” Current Opinion in Environmental Sustainability 5 (5): 458–463. doi:https://doi.org/10.1016/j.cosust.2013.05.002.
- Seppelt, Ralf, and Alexey Voinov. 2002. “Optimization Methodology for Land Use Patterns Using Spatially Explicit Landscape Models.” Ecological Modelling 151 (2–3): 125–142. doi:https://doi.org/10.1016/S0304-3800(01)00455-0.
- Shaw, M. Rebecca, Linwood Pendleton, D. Richard Cameron, Belinda Morris, Dominique Bachelet, Kirk Klausmeyer, Jason MacKenzie, et al. 2011. “The Impact of Climate Change on California’s Ecosystem Services.” Climatic Change 109 (S1): 465–484. doi:https://doi.org/10.1007/s10584-011-0313-4.
- Shaygan, Mehran, Abbas Alimohammadi, Ali Mansourian, Zohreh Shams Govara, and S. Mostapha Kalami. 2014. “Spatial Multi-Objective Optimization Approach for Land Use Allocation Using NSGA-II.” IEEE Journal of Selected Topics in Applied Earth Observations and Remote Sensing 7 (3): 906–983. doi:https://doi.org/10.1109/JSTARS.2013.2280697.
- Singstat. 2018. “Singapore Department of Statistics.” https://www.singstat.gov.sg/find-data/search-by-theme/population/population-and-population-structure/latest-data
- SLA. 2018. “Total Land Area in Singapore.” https://www.sla.gov.sg/Press-Room/Statistics
- Statista. 2019. “Total Population of Singapore from 2015 to 2035 (in Millions).” https://www.statista.com/statistics/713063/singapore-forecast-total-population/
- Stewart, Theodor J., Ron Janssen, and Marjan Van Herwijnen. 2004. “A Genetic Algorithm Approach to Multiobjective Land Use Planning.” Computers and Operations Research 31 (14): 2293–2313. doi:https://doi.org/10.1016/S0305-0548(03)00188-6.
- Stone, Brian, Jeremy J. Hess, and Howard Frumkin. 2010. “Urban Form and Extreme Heat Events: Are Sprawling Cities More Vulnerable to Climate Change than Compact Cities?” Environmental Health Perspectives 118 (10): 1425–1428. doi:https://doi.org/10.1289/ehp.0901879.
- Strien, Maarten J. van, and Adrienne Grêt-Regamey. 2016. “How is Habitat Connectivity Affected by Settlement and Road Network Configurations? Results from Simulating Coupled Habitat and Human Networks.” Ecological Modelling 342: 186–198. doi:https://doi.org/10.1016/j.ecolmodel.2016.09.025.
- Stürck, Julia, Catharina J. E. Schulp, and Peter H. Verburg. 2015. “Spatio-Temporal Dynamics of Regulating Ecosystem Services in Europe: The Role of Past and Future Land Use Change.” Applied Geography 63: 121–135. doi:https://doi.org/10.1016/j.apgeog.2015.06.009.
- Tan, Puay Yok. 2016. “Chapter 10 Greening Singapore: Past Achievements, Emerging Challenges.” In Fifty Years of Urban Planning in Singapore, edited by C. K. Heng, 177–195. Singapore: World Scientific.
- Tan, Puay Yok, James Wang, and Angelia Sia. 2013. “Perspectives on Five Decades of the Urban Greening of Singapore.” Cities 32: 24–32. doi:https://doi.org/10.1016/j.cities.2013.02.001.
- Tzoulas, Konstantinos, Kalevi Korpela, Stephen Venn, Vesa Yli-Pelkonen, Aleksandra Kaźmierczak, Jari Niemela, and Philip James. 2007. “Promoting Ecosystem and Human Health in Urban Areas Using Green Infrastructure: A Literature Review.” Landscape and Urban Planning 81 (3): 167–178. doi:https://doi.org/10.1016/j.landurbplan.2007.02.001.
- United Nations. 2018. World Urbanization Prospects: The 2018 Revision. New York: United Nations, Department of Economic and Social Affairs. doi:https://doi.org/10.18356/b9e995fe-en.
- URA. 2014. “Master Plan 2014.” https://www.ura.gov.sg/
- USDA. 1975. “Urban Hydrology for Small Watersheds.” Soil Conservation 55 (TR-55): 164. Technical Release.
- Wolsink, Maarten. 2016. “Sustainable City’ Requires ‘Recognition’: The Example of Environmental Education under Pressure from the Compact City.” Land Use Policy 52: 174–180. doi:https://doi.org/10.1016/j.landusepol.2015.12.018.
- Yee, A., Richard Corlett, S. Liew, and Hugh Tan. 2011. “The Vegetation of Singapore: An Updated Map.” The Gardens’ Bulletin, Singapore 63: 205–212.
- Yoon, Eun Joo, Bomi Kim, and Dong Kun Lee. 2019. “Multi-Objective Planning Model for Urban Greening Based on Optimization Algorithms.” Urban Forestry and Urban Greening 40: 183–194. doi:https://doi.org/10.1016/j.ufug.2019.01.004.
- Zitzler, Eckart. 1999. Evolutionary Algorithms for Multiobjective Optimization: Methods and Applications: Berichte Aus Der Informatik, No 13398 (30), 120. Aachen: Shaker Verlag. https://doi.org/citeulike-article-id:4597043.