
 ?Mathematical formulae have been encoded as MathML and are displayed in this HTML version using MathJax in order to improve their display. Uncheck the box to turn MathJax off. This feature requires Javascript. Click on a formula to zoom.
Abstract
Various measures have been proposed and validated to assess environmental motivation and explain peoples’ consumer behavior. However, most of the measures are rather complex, sometimes comprising dozens of items. In order to overcome the associated response burden, the goal of our research is to validate a much simpler measure of environmental motivation, namely the measure of Climate Change-Stage of Change. To do so we analyze data from a discrete choice experiment in which drivers decide to purchase a car with different levels of CO2 emissions and we also measure their environmental motivation with three alternative measures. The results show that environmental motivation assessed with Climate Change-Stage of Change explains the choices in the experiment as well as with more complex measures. Our findings have substantial implications for researchers as they may be able to assess climate-relevant motivation – a significant factor for many consumer choices – with a single question.
1. Introduction
Climate change is one of the most pressing problems of our time. Many actions are required in order to meet the goals of carbon neutral societies. In order to help guide policy, researchers conduct experiments to elicit how people might act given certain choice scenarios. In the context of climate change, some people may not believe that it exists or be sufficiently motivated to behave accordingly while others may be. Therefore, researchers conducting experiments related to environmental choices should control for such behavioral antecedents so that users of scientific results will know how the policies might affect those sub-populations. Currently, established measures exist on environmental behaviors, attitudes and beliefs that can be used in behavioral models. However, those measures are complex and often contain many more than 10 questions. In this article we examine whether a simpler question capturing climate change belief and behavior might sufficiently replace the established measures.
Travel choices are typical situations that influence climate change emissions. Previous research has demonstrated that CO2 emissions (CO2-E) information affects transport choices (Waygood and Avineri Citation2016; Daziano et al. Citation2017; Waygood and Avineri Citation2018). However, the response to CO2-E information has been found to vary between groups of people, depending on their environmental motivation (Gaker and Walker Citation2013; Daziano et al. Citation2017). Gaker and Walker (Citation2013) used latent class modeling to categorize individuals with respect to the strength of their response to the CO2-E information. As one group had statistically no response, and the other a strong one. However, lacking any exogenous indicator of environmental motivation, they could only infer that the latter was highly motivated by environmental concerns. Daziano et al. (Citation2017) also used latent class modeling but was able to corroborate the effect of motivation on the choice only for the price of using an extensive set of exogenous motivational indicators. In that experiment, 50 questions came from the General Environmental Behavior scale (Kaiser and Wilson Citation2004) and 15 from the New Environmental Paradigm (Dunlap et al. Citation2000).
Established measures such as the General Ecological Behavior (GEB) and New Environmental Paradigm (NEP) are valid and reliable measures of environmental attitudes and behavioral tendencies (Kaiser and Wilson Citation2004; Dunlap et al. Citation2000). However, the burden of that number of questions increases costs to researchers and may increase respondent fatigue (e.g. Backor, Golde, and Nie Citation2007; Peytchev and Peytcheva Citation2017). A less arduous method able to evaluate a respondent’s environmental behavior and beliefs would thus make scientific endeavors to mitigate the climate change more efficient.
Another point to consider is that climate change is a specific environmental concern, and a question focused on it might be better than a general environmental one. For example, an individual might undertake environmental behaviors such as recycling or not throwing batteries in the garbage, but these will have little impact on climate change and might be related to concerns over garbage rather than climate. How individuals respond to the climate-related impacts of their choices likely relates to their concern for, and motivation to take action on, climate change. Waygood and Avineri (Citation2011, Citation2018) showed, for example, how the strength of influence of CO2-E information differed by what they termed a climate change stage of change (CC-SoC) measure. This measure is based on the Transtheoretical Model (TTM) which defines six key stages of change in climate-related behavior: precontemplation, contemplation, preparation, action, maintenance, and termination. Here is a brief description of those stages (Prochaska and Velicer Citation1997; Prochaska, Redding, and Evers Citation2015):
Precontemplation refers to not intending to take action in the next 6 months and is often related to believing that the behavior is not a problem. Having no intention to act could be because of previous failed attempts at behavior change or being unaware of the consequences of their behavior;
Contemplation means intending to take action in the next 6 months. Individuals in this stage are aware of the problem, but may not be sufficiently motivated to take action. Thus, they may be stuck in “chronic contemplation”;
Preparation refers to being ready to take action in the next 30 days. These individuals are motivated to take action and have likely identified actions to take;
Action refers to having made an overt lifestyle change in the past 6 months;
Maintenance means performing a new behavior for more than 6 months;
Termination is that an individual is no longer at risk of returning to their previous behavior.
The measure, CC-SoC in this study was composed of questions related to the first four stages. The later stages are essentially combined into the highest level due to findings from previous studies (e.g. Waygood and Avineri Citation2016, Citation2018) that found a small percentage of people at such a stage. In the future, as more people consciously make efforts to reduce, the distinction between those levels may become important.
In order to know how people respond to the vehicle choices based on the information related to climate change, various context information about the vehicle would be provided for respondents in the discrete choice experiment (DCE), such as the vehicle price, fuel cost per year, CO2 emissions per year, etc. The information about CO2 emissions could be presented in different framings, for example, using the number of grams per mile or pounds per year to present it (Daziano et al. Citation2017). Different information presentations (framings) would have different effects on people’s choices (Daziano et al. Citation2017; Daziano et al. Citation2021). Details on the expected influence are given in the Methodology section. Moreover, various questions related to the respondents should be asked to investigate the internal causes of their decision-making, including socio-demographics, environmental behavior, and related beliefs.
The objective of this research is to measure how individual response to CO2-E varies by the individual levels of attitudes assessed with established measures, namely GEB and NEP, as well as the proposed CC-SoC measure. First, with respect to previous research on climate change and potential sociodemographic confounders, the CC-SoC stages are analyzed with respect to those. Then, how the GEB and NEP measures relate to the CC-SoC are presented. Following that, logit models are used to determine willingness-to-pay for CO2 based on data from a discrete choice experiment (DCE). A separate logit model is estimated for each of the three environmental attitude measures. The results of those models are used to evaluate how the CC-SoC measure compares to the GEB and NEP in terms of explaining different willingness to pay (i.e. variance explained) and model fit. The main innovation for this study is the analysis results that provide empirical support for the use of a simplified measure of environmental attitudes and behavior with respect to climate change.
The next section will give a more detailed introduction to the CC-SoC measure and its use. Section 3 contains details on the methods used including the participants, survey tools, and the vehicle choice models used in this study. Based on the survey data, statistical analysis results and model results are shown in Section 4, which will be discussed in Section 5. Finally, the conclusion gives a summary of the study and points out the current limitations and future research.
2. Background
Previous research on environmental attitudes and behavior have highlighted the problem that attitudes do not necessarily explain behavior (Anable, Lane, and Kelay Citation2006; Kaiser, Byrka, and Hartig Citation2010). As an example, someone may have a positive attitude toward environmental issues, but may still perform behaviors counter to those attitudes such as driving a large vehicle. Moreover, some psychological literature indicates that behavioral barriers must be low in order for attitudes to play a significant role in behavior (Swim et al. Citation2009; Kaiser, Byrka, and Hartig Citation2010, but cf. Taube et al. Citation2018). A behavioral barrier can be something that makes an action difficult to do. For example, without good cycling infrastructure, an individual might not cycle to places because the safety cost is too high. Referred to as Campbell’s paradigm, the gap between attitudes and behavior can be explained by behavioral costs (Kaiser, Byrka, and Hartig Citation2010). One can think of behavioral costs in terms of different costs such as effort, time, or money. The behavioral cost of recycling is relatively low in most places where the city collects waste for recycling regularly, but the behavioral cost of composting could be considered higher due to a need for space, a basic knowledge of how composts function, and the effort to empty it yearly.
Kaiser, Byrka, and Hartig (Citation2010) argue that attitudes and behaviors should not be seen as having a causal relationship, but a formal one where they are “inseparable aspects of a unity; they are two sides of one coin.” In other words, it is not that one causes the other, but they should be considered together. They argue that attitude is a propensity (in their words, a latent disposition) that shapes people’s pro-environmental behavior. This means that someone with a positive attitude is inclined to perform environmental behaviors. From the perspective of the behavior, attitude is a measure of the subjective value (or salience) that one places on the behavior. For example, an individual who has concerns over climate change may be more inclined to use non-motorized travel which is indicative of pro-environmental attitudes. Further, as that action has meaning to them (it is salient), doing such an action likely makes them feel better. This formal relationship is in contrast to commonly applied causal relationship theories such as the theory of planned behavior (Ajzen Citation1991) where attitudes cause behavior.
The behavioral cost of a pro-environmental behavior will also affect the likelihood of it being conducted (Taube et al. Citation2018). An individual could be strongly motivated to conduct a pro-environmental behavior, yet still not conduct it. For example, an individual living in the suburbs may wish to use more environmentally benign options, but the costs of doing so may prevent them. The costs can be any number of things including time, physical effort, or going against social norms. Following the perspective proposed by Kaiser, Byrka, and Hartig (Citation2010), which they term Campbell’s paradigm, for an individual to state “I am concerned about the environment” is an “easy behavior” related to pro-environmental attitudes. Conducting a behavior that requires higher costs (whether they be mental, physical, time, or financial) such as abstaining from car use would indicate a stronger attitude toward environmental conservation. Thus, one could propose a gradation of attitude-behavior from a lack of concern through to action.
2.1. Climate change stage of change
The notion of moving from no concern to action is captured in the Transtheoretical Model (TTM) where the Stages of Change (SoC) lie at the heart. TTM is a behavioral model used to conceptualize the process of intentional behavior change, which was originally used for change in health behavior (Prochaska and Velicer Citation1997; Prochaska and Norcross Citation2001; Prochaska, Redding, and Evers Citation2015). Using this approach as a framework, we propose different stages of change in climate behavior to be an alternative and very simple measure of environmental attitudes and behavior. The possible responses range from not being concerned about climate change, concerned about climate change but with no action planned (low cost), planning to take action to reduce one’s emissions (planning effort costs), and finally to having taken action to reduce one’s climate change emissions (high cost). Higher costs indicate the strength of the attitude-behavior toward climate change. The first, not being concerned, represents an absence of attitude-behavior toward climate change; the second, concerned with no action, shows some attitude-behavior. The third, planning to act, is a sufficient attitude-behavior strength that the individual is consuming mental and time costs, but the total behavioral cost may prevent them from actually taking any action. The final category, having taken action (to reduce climate change impacts), represents attitude-behavior strength so strong that they have made changes.
In this study, the question and responses relate to general climate change behavior as transport choices have a significant impact on individual emissions. Further, the development of a general measure is more useful as it can be applied to other behaviors. Further, depending on the context of the individual’s life domain (e.g. life-cycle stage, built environment, health, etc.) it may be more or less easy to make climate-friendly transport choices (Sun et al. Citation2009). But the option of having made changes to reduce emissions allows for individuals with sufficiently high motivation to have found an appropriate behavior and followed through (whether that be home improvements, transport changes, diet changes, etc.). Thus, a person may determine that it is more appropriate for them to make reductions to their climate change emissions in some other domain such as their home, being vegetarian, saving energy, etc. In all cases, they have made efforts to reduce their emissions, which is the defining characteristic for that stage.
2.2. Environmental attitude measures
There is a variety of environmental attitude measures including the scales of General Ecological Behavior (GEB) and New Ecological Paradigm (NEP) which are widely used and the validity and reliability of which have been assessed (Milfont and Duckitt Citation2010; Dunlap Citation2008). The GEB scale uses self-reported environmental behaviors to measure environmental attitudes (Kaiser and Wilson Citation2004; Kaiser, Byrka, and Hartig Citation2010). The NEP scale is an often-used environmental attitude measure assuming one’s moral values to be the core concept of environmental attitudes (Dunlap et al. Citation2000). Different types of behaviors have been successfully explained by GEB and NEP measures. The GEB is widely used and is one of the most established domain-general measures (Lange and Dewitte Citation2019). The NEP scale is one of the world’s most widely used measures (Dunlap Citation2008) for pro-environmental behavior and it has been used extensively with respect to a wide variety of behaviors such as waste reduction, participation in green electricity programs, and green buying (Hawcroft and Milfont Citation2010). Henn, Taube, and Kaiser (Citation2019) also demonstrated that environmental attitude is essential for restraining consumption and saving energy, it contributes to appropriate behavior choices being made, and rigorously implementing these choices.
However, general environmental concern or general environmental behavior is not necessarily related to climate change concern or action. Climate change is a global commons problem (Brown et al. Citation2019) with impacts that are often perceived to be geographically and temporarily distant. This may differ from more visible environmental issues such as garbage pollution or toxic pollutants with direct health impacts. As such, although the Climate Change Stage of Change scale is simple in comparison to the more complex GEB and NEP scales, it may compensate for that simplicity by targeting climate change concerns and action.
2.3. How information is presented can impact response strength
In practice, CO2-E information is typically presented as grams/mile (or km) or tons/year (Gaker et al. Citation2011; Achtnicht Citation2012; Daziano and Achtnicht Citation2014; Waygood and Avineri Citation2016, Citation2018; Daziano et al. Citation2017). However, presented in this manner, it may be difficult for people to use CO2-E information in their decisions because they do not have the necessary knowledge to judge whether the amount is high or low. It has been documented that the form in which CO2-E information is presented to individuals influences the degree to which people act pro-environmentally (Avineri and Waygood Citation2013; Waygood and Avineri Citation2016; Daziano et al. Citation2017; Waygood and Avineri Citation2018); presenting CO2-E information as grams/mile was much less effective than when some context was given. The difference between response strength is even more pronounced if consideration to their climate change concern is taken into account. For example, individuals who were not concerned about climate change were not influenced by CO2-E information when it was presented as grams/mile (Waygood and Avineri Citation2011; Waygood and Avineri Citation2018), but were when it was presented with context such as trees required to absorb the emissions or with respect to a carbon budget. Thus, in testing how people respond to environmental information, it is important to not only consider their environmental motivation, but also the framing of the environmental information.
3. Methodology
3.1. Research framework
The research framework used in this study to account for one’s environmental attitude, climate change concerns and information framing is shown in detail in . The strength of the reaction to the above-mentioned factors can be measured through willingness-to-pay (WTP) derived from choices in a discrete choice experiment.
Figure 1. Research framework.
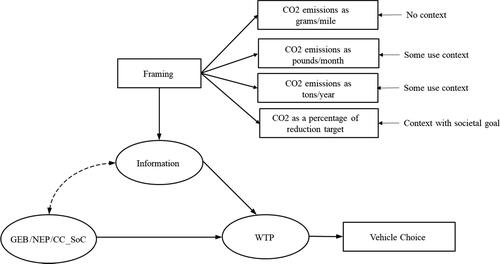
First, following a review by McCright et al. (Citation2016), a number of relevant socio-demographic variables were identified for testing to examine whether relationships between the CC-SoC and previous work are consistent. The association of CC-SoC with sociodemographic characteristics of individuals is analyzed with ANOVA and chi-squared. Then, relations between CC-SoC, GEB and NEP are presented. Finally, mixed logit models with panel effects are conducted to compare the explanatory power of CC-SoC compared to GEB or NEP in in climate change-related consumer choices. The same logit model structure is conducted using the separate measures of GEB, NEP, and CC-SoC. As the GEB and NEP measures result in continuous variables, but the CC-SoC is an ordinal measure, quartiles are created for GEB and NEP to facilitate comparison. The measures for the model’s goodness of fit (e.g. loglikelihood, Rho-square-bar, AIC, BIC), hypothesis testing (likelihood ratio test), and the WTP by the different attitudinal measures are then compared to assess whether the CC-SoC can be used as a reasonable substitute for the more complex measures NEP and GEB. summarizes the hypothesis and empirical strategies in this study which are (1) correlate CC-SoC to socio-demographic measures; (2) correlate the three measures with each other, and; (3) compare fit statistics for the three choice models.
Table 1. Summary of hypothesis and empirical strategies.
3.2. Respondents and survey design
An online survey was conducted in Philadelphia and Boston, USA, between 15 December, 2015 and 15 March, 2016. Because the information is related to CO2 emissions of vehicles, only car owners living in these two metropolitan areas were recruited. A panel of 1,581 car owners completed the online survey. General socio-demographic information for the participants is shown in .
Table 2. Socio-demographic characteristics of the respondents.
The survey includes six parts: (1) Current vehicle ownership and plans for the next car; (2) Socio-demographics of respondents; (3) Tax policy preference and environmental concern; (4) Measurement for general ecological behavior (GEB); (5) Measurement for new environmental paradigm (NEP); (6) Discrete choice experiment on vehicle choice.
3.3. CO2 Emissions information framing
Four different methods of framing the CO2 emissions information were tested (see also Daziano et al. Citation2017). Those four framings are referred to as treatments in the experiment. Individuals were randomly assigned to one of the treatments so that their responses could be treated independently. The four different framings were:
CO2 emissions as grams per mile (e.g., 336 g/mile);
CO2 emissions as pounds per month (e.g., 926 lbs/month);
CO2 emissions as tons per year (e.g., 5.56 tons/year);
CO2 as a percentage of the 2025 US EPA reduction target of 27% from 2005 levels (e.g., 134% of reduction target).
For the government reduction target 27% was used. Following the current car-label standard, for all treatments, an annual mileage of 15,000 miles was used to derive annual amounts. In reality, fuel economy/expenses and emissions are correlated, but in this experiment, both are treated as orthogonal to ensure correct identification of the values of the attributes. The orthogonality assumption is not problematic in this case as the relationship between fuel and emissions is not a direct one for consumers.
The influence of different framings was tested previously by Daziano et al. (Citation2017) using latent class modeling. Membership to the latent class modeling was examined using socio-demographic and some environmental attitudinal information, but not with the measure CC-SoC. The hypotheses for that experiment were that due to a lack of context, the first framing would perform the worst, the second and the third would perform better than the first, especially with more environmentally inclined people, and the last would perform best following findings by Waygood and Avineri (Citation2011, Citation2016) that found that even people who are not concerned about climate change were motivated by such information.
3.4. Measurements of environmental attitudes
Two established measures of environmental attitude were used: the General Environmental Behavior (GEB) scale composed of 50 questions, and the New Environmental Paradigm (NEP) scale composed of 15 questions which are described in more detail in Section 4. As an innovation, a simple question about Climate Change Stage of Change (CC-SoC) was used same as in e.g. Waygood and Avineri (Citation2011, Citation2016). The question asked individuals to choose the statement which best describes them with respect to climate change emissions. The responses were as follows:
Precontemplation: I am not concerned;
Contemplation: I would like to reduce my emissions, but I don’t know how;
Preparation: I would like to reduce my emissions, and will do so in the future;
Action: I have already reduced my emissions significantly.
3.4.1. General ecological behavior
The General Ecological Behavior (GEB) scale includes 50 self-reported environmental behaviors such as: “I drive my car in or into the city”, “I contribute financially to environmental organizations”, etc. The operational scale entails that the indicator items such as self-reported behavior in the GEB from which a person’s general environmental attitude is inferred represent a single – for all individuals – transitively ordered class of items. The inferred property is also sufficient for accurately anticipating the responses of individuals (Bond Citation2015). This study only used 49 GEB items. The item (#17): “I refrain from using a car” was left out, since frequent driving was a qualification criterion for participation in the study.
The GEB scale indicates the performance of environmental behaviors which differ in behavioral difficulty. Recycling represents an example of a rather easy behavior (a common environmental behavior in the most wealthy countries), while going car-free a rather difficult behavior (which would require in most cases greater motivation and effort). In order to derive an individual’s level of environmental motivation, i.e. one’s propensity to overcome behavioral costs/obstacles related to environmental behaviors, a Rasch model is used. The Rasch model is a conventional way to consider an individual’s latent ability related to the difficulty of behaviors in which an individual engages (Rasch Citation1993; Merrell and Tymms Citation2005; Roczen et al. Citation2014).
For the 49 GEB items, 17 behaviors were measured with yes/no questions and 32 behaviors with a 5-point frequency scale ranging from 1 (never) to 5 (always) and 6 (don’t know). In order to run the simple Rasch model, the responses to the latter items need to be recoded into a dichotomous format (e.g. 1, 0 rather than the frequency scale) (Fischer and Molenaar Citation2012). The recoding of the behavioral self-reports measured by their frequency into a dichotomous format has proven to diminish measurement error rather than substantive information relevant for a valid assessment of interindividual differences in people’s attitudes (Kaiser and Wilson Citation2004). “Never”, “seldom”, and “occasionally” are considered “no pro-environmental” engagement. “Often” and “always” were collapsed into “yes pro-environmental” engagement. “I don’t know” was a response category when an answer is, for whatever reason, not possible. Such responses are coded as missing values. Of all behavior statements, 3.6% were found to be missing. For negatively formulated behavior, the scales are subsequently reversely coded.
3.4.2. New ecological paradigm measures
The New Ecological Paradigm (NEP) scale is an often-used environmental attitude measure assuming one’s moral values to be the core concept of environmental attitudes (Dunlap et al. Citation2000). For the NEP measure of attitude requires that every person rates each of the 15 items on a 5-point scale ranging from 1 (strongly agree) to 5 (strongly disagree). In order to make people concentrate on responses for each item, the eight odd items are formulated positively, and the seven even items are formulated negatively. The NEP score is a summation of the 15 rescaled items, with higher values indicating greater pro-environmental attitude for an individual (the odd items were subsequently reverse coded). The standardized value of NEP score is used in the analysis.
To improve the data efficiency, all cases with zero variance in attitudinal responses, which indicates respondent’s non-attention to the questions, were excluded from the data analysis. Altogether 42 (2.7%) cases were excluded from the analysis resulting in N = 1,539 final sample.
The general distributions of CC-SoC, GEB, and NEP measures are presented in .
Table 3. General distribution of environmental attitude measures.
3.5. Discrete choice experiment
For the logit model data, the discrete choice experiment (DCE) described in Daziano et al. (Citation2017) is used. A Bayesian efficient design (Kessels, Goos, and Vandebroek Citation2006; Bliemer, Rose, and Hess Citation2008) was applied to derive the combination of vehicle attributes leading to a total of 12 choice tasks. Note that the information frames act as treatments and are not additional experimental attributes. The actual attributes were purchase price, fuel costs per year, and grams of CO2 per mile (). The experiment used a simple text-based presentation of these three pieces of information (). The respondent needs to choose one from two types of vehicles. Vehicle A has higher fuel costs per year and grams of CO2 per mile with higher purchase price than vehicle B. The attributes for different scenarios are different combinations of the same attribute of vehicle A and vehicle B in different levels. The values for Vehicle A are based on a conventional gasoline vehicle, whereas those of Vehicle B are based on hybrid vehicles. The final experimental design was obtained using the software Ngene.
Figure 2. Example of choice experiment question.
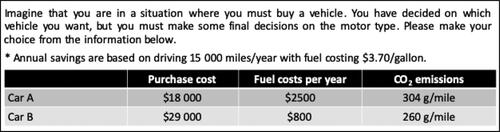
Table 4. Experiment attributes and levels.
3.5.1. Vehicle Choice CC-SoC model
Following the choice model proposed in Daziano et al. (Citation2017), the indirect utility on individual when choosing alternative
was specified as follows:
(1)
(1)
where
is the present value of the future (operating) costs over the holding horizon, PVFE is the present value of future emissions, and
is the marginal willingness to pay for reducing emissions (over the whole holding horizon, i.e. the willingness to pay for reducing one unit of emissions over the whole period in which the car is owned).
Also as in Daziano et al. (Citation2017), if both emissions and operating costs are measured in a per-month basis, then:
(2)
(2)
(3)
(3)
where
is the subjective discount rate (reflecting time preferences),
is the total number of months of ownership,
is the expected value of operating costs at month
and
is the expected value of emissions at month
Taking the monthly uniform equivalent of future operating costs
and the monthly uniform equivalent of future emissions
over a sufficiently large holding horizon, the following capitalized value approximation can be applied:
(4)
(4)
(5)
(5)
meaning that it is possible to rewrite the choice model as:
(6)
(6)
where
becomes an additional parameter to estimate. Note that the estimates for all discrete choice analysis in this paper reflect the parameters of the WTP-space specification.
There are 4 levels for the Stage of Change variable: not concerned (SoC1, Precontemplation); concerned, don’t know what to do (base, Contemplation); concerned, will do something (SoC3, Preparation); concerned, have done something (SoC4, Action). To analyze the effect of CC-SoC on vehicle purchase choices, deterministic variations in the willingness to pay for reducing emissions are introduced as a function of both CC-SoC and information framing. The utility of individual i, when choosing alternative j is thus specified as follows (Daziano et al. Citation2017):
(7)
(7)
Tons per year was taken as the reference for framing (dollars per ton is a standard unit for emission abatement), and willingness to pay measures are determined incrementally with respect to this reference. The other framings were grams per mile, pounds per month, and societal reduction goal (for more information, please see Daziano et al. Citation2017). For the level of concern, “don’t know what to do” is the base level of climate change concern. is the marginal willingness to pay for reducing emissions. In order to explain heterogeneity around WTP measures and how it may relate to different measures of environmental attitude.
) has been specified to be normal distribution:
with parameters
Moreover, in the discrete choice experiment, each decision maker provided repeated choices under 12 choice tasks The panel effects are considered to avoid underestimating the standard errors of the parameters. Thus,
(8)
(8)
where
is the mean value of
which represents the base willingness to pay for emissions treatment of tons per year.
is a random variable which is assumed to follow standard normal distribution.
is a parameter to be estimated. Then the utility function of the general form in EquationEquation 7
(7)
(7) becomes:
(9)
(9)
3.5.2. Vehicle choice model with GEB measures
In order to compare the utility effects of the CC-SoC variable with the effect of the GEB variable, the CC-SoC dummy indicators are replaced by GEB theta scores derived from the responses on the GEB scale (see EquationEquation 10(10)
(10) ). The GEB theta score indicates the extent of a person’s environmental attitude with a higher value indicating that the individual has a greater propensity to conduct the pro-environmental behavior. Following the same model structure of EquationEquation 9
(9)
(9) as outlined in the previous subsection, the utility of individual
when choosing alternative
at time
was specified as:
(10)
(10)
Note that the CC-SoC variables have been replaced by the GEB propensity with a coefficient
that represents the influence of pro-environmental attitudes on the utility of an individual’s choice. To investigate the different levels of people’s pro-environmental attitude, we divide the GEB active ability into four categories by quartiles. The higher level means stronger pro-environmental attitude, which is similar to the CC-SoC levels. The other variables are the same as the Vehicle Choice CC-SoC model. As a result, the utility function is changed to:
(11)
(11)
where the second level of GEB active ability is the base level.
3.5.3. Vehicle choice model with NEP measures
Similar to the substitution of the CC-SoC variable with the GEB variable, the CC-SoC dummy variables in EquationEquation 9(9)
(9) are replaced by a measure of an individual’s environmental attitude derived from the NEP scale. The standardized value of NEP score is adopted into the model, with higher values indicating stronger pro-environmental attitude for an individual. The standardized NEP score is a continuous variable. As before, the utility of individual
when choosing alternative
at time
was specified as follows:
(12)
(12)
where the CC-SoC variables have been replaced by the standardized NEP score
with a coefficient
that represents the influence of pro-environmental attitude on the utility of an individual’s choice. We divide the standardized NEP scores into four categories by quartiles. The higher level means stronger pro-environmental attitude, which is similar to the CC-SoC levels. Then the utility function becomes:
(13)
(13)
where the second level of the NEP score is the base level.
Therefore, there are five models with different measures of environmental attitude: 1) GEB score, 2) GEB quartiles, 3) NEP score, 4) NEP quartiles, 5) CC-SoC. The model variables for these models are shown in .
Table 5. Model variables.
4. Results
4.1. Descriptive Statistics
To examine how the CC-SoC relates to different socio-economic variables and the other environmental measures (GEB and NEP), ANOVA and chi-squared tests of independence are conducted. Following a review by McCright et al. (Citation2016), a number of relevant socio-demographic variables were identified for testing to examine whether relationships between the CC-SoC and previous work are consistent. In this section, ANOVA is used where the dependent variable is a continuous variable, and chi-squared tests of independence are used when the variable is categorical or ordinal.
4.1.1. Sociodemographic relationships to CC-SoC
According to the results in , all the sociodemographic characteristics of the respondents affect CC-SoC. The implication of those findings and how they relate to previous findings are discussed in Section 5.2.
Table 6. Descriptive statistics between the climate change stage of change and social-demographic variables.
4.1.2. Relationships between GEB and NEP with CC-SoC
ANOVA using the Bonferroni multiple-comparison test method shows that the Stage of Change based question separates people into clearly defined groups according to their environmental attitudes and behaviors; each stage is distinct from the others. The cross distributions of environmental measures (NEP and GEB with CC-SoC) are shown in . These results follow the logic of the Stage of Change theory, as attitudes toward the environment must pass a certain threshold for individuals to consider action.
Table 7. Comparison of Climate Change-Stage of Change (CC-SoC) discrete groups with NEP and GEB measures.
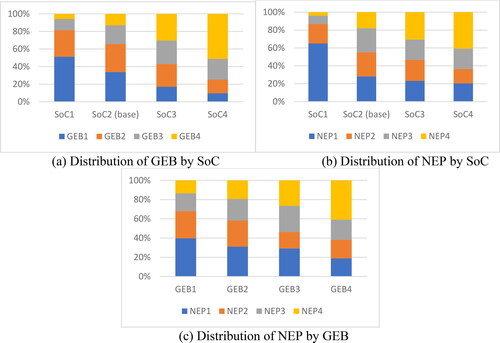
For the ordinal variables of GEB and NEP, the chi-squared tests show that the GEB and NEP measures have close relationships between the CC-SoC measure. In , the level (stage) distributions of CC-SoC by GEB and NEP categories are similar, although some stage levels do not match each other. For example, most of the people who do not perform a lot of environmental behaviors (GEB1) state that they are at CC-SoC Level 2 (SoC2), i.e. they are concerned about climate change, but do not know what to do.
Inversely, the level distributions of GEB and NEP by CC-SoC are shown in , as well as the cross distribution between GEB and NEP measures. The results show that people who are concerned about climate change will conduct more environmental behaviors and have higher environmental attitudes in general. We can also see that the majority of individuals in SoC1 are at the NEP1 and GEB1 levels, and under 10% are at the top levels of the two. However, between NEP and GEB, there is not this same level of agreement with less than 40% of GEB1 being in NEP1 and vice versa. This might be a result of the difference of NEP relating to beliefs and attitudes, whereas GEB focuses on behaviors. At the other end of the scale, we can see that for SoC4, the majority of individuals are at GEB4, and slightly over 40% at NEP4, with over 20% at NEP3.
Figure 3. Cross distribution of environmental measures.
4.2. Experiment-revealed WTP estimates inferred from the vehicle choice model
In this section, the results of mixed logit models with panel effects are presented. The logit models are identical except for how an individual’s environmental attitude is measured. There are five models in total: 1) GEB score, 2) GEB quartiles, 3) NEP score, 4) NEP quartiles, 5) CC-SoC. The GEB and NEP quartiles are used to make comparisons between the estimated WTP easier. This is considered reasonable as, if a population was studied for their climate-change relevant choices, they would most likely be grouped (as opposed to treated on a continuous scale) for use in an information campaign. Measures of the models’ fit, explanatory power, and the WTP estimates are used to judge whether the CC-SoC is a reasonable substitution in such analysis.
The five models were run for several times respectively with the same start values in Biogeme (Bierlaire Citation2020). The measures of models’ fit are shown in , which include the number of estimated parameters, final log likelihood, AIC, BIC, goodness of fit (Rho-square-bar), hypothesis testing (likelihood ratio test), etc. The best model results with maximum final log likelihood, minimum AIC and BIC are in bold, and the Rho-square-bar and likelihood ratio test were calculated based on the best results for each model. Since the five models were estimated on the same data and with the same set of alternatives, the initial log likelihood is the same for all models and the measures of the models’ fit are comparable. Comparing the goodness of fit (Rho-square-bar) for these five models, the results are essentially all the same (26.3%). Moreover, the changes of AIC and BIC along with the final log likelihood are all within 0.2% of each other. These results suggest the use of CC-SoC is a reasonable substitution for GEB and NEP in this context.
Table 8. Comparison with the measures of model fits of different models.
Based on the best model results, the willingness to pay estimates for the five models are shown in the Appendix. is a summary of these models on the WTP point estimates and their significance. Note that the estimates for all discrete choice analyses reflect the parameters of the WTP-space specification specified in EquationEquation (9)–(13). For the derivation of the point estimates, a logit choice model in WTP-space was assumed by imposing a type-1 extreme value taste shock (i.e.
Table 9. Comparison with estimates of Vehicle Choice CC-SoC model, Vehicle Choice GEB model and Vehicle Choice NEP model.
The parameter represents a marginal (dis-)utility that is subject to scale, all of the other parameters have a direct economic interpretation. For example, from the monthly discount rate estimate,
equals 10.9 for all models. It is possible to infer an annual subjective discount rate of 13.89%, which is slightly high providing evidence of impatient consumers (Daziano et al. Citation2017).
Further, is the reference variable directly interpreted as the maximum willingness to pay a premium in purchase price for a vehicle that saves 1 ton of CO2 by a consumer who saw the emission information in tons per year, and who is at pro-environmental level 2. All the
parameters are WTP additive variations with respect to
For the additional WTP of the environmental measures, the models with category measures (NEP quartiles, GEB quartiles, and CC-SoC) use the parameter
at different levels to represent the WTP additive variation with respect to
while the models with continuous measures (NEP score and GEB score) use
to represent the WTP additive variation. It can be seen that all of the parameters are similar for these five models, which means the CC-SoC measure might be sufficient as a substitute for the more complex measures of NEP and GEB to represent people’s environmental attitudes and behaviors.
and the square of θ is the mean value and variance of the random parameter
In , since the θ is significantly different from 0 for all models, that means the IIA restrictions are rejected and the mixed logit model with panel effects establishes greater realism than the MNL model.
thus summarizes the total WTP by framing and measure levels. It can be seen that under each information framing treatment the more concerned a respondent is about climate change, the higher their WTP for GHG emissions. Comparing the effects of different measures () shows that the three measures have similar WTP results under different information framings. Comparing the effects of information framings, the societal objective framing is the most effective with the highest WTP for all measures under different levels.
Figure 4. Revealed willingness-to-pay for CC-SoC/NEP/GEB measures levels under different information framings.
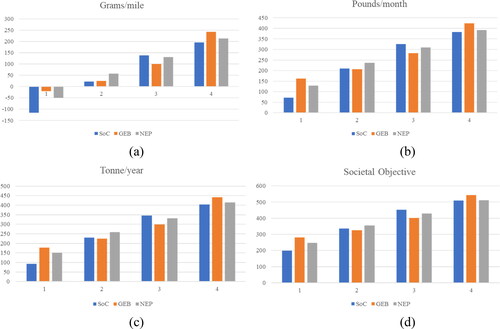
Table 10. Revealed willingness-to-pay for CO2 emissions by the format of CC-SoC, NEP and GEB values under different framings.
shows the WTP difference between CC-SoC and the NEP/GEB measures under different information framings, it can be seen that the largest relative differences are found for Level 1 and Level 4. This shows that: people identifying as not believing in climate change (SoC1) have a lower WTP than people who do not perform a lot of environmental behaviors (GEB1); people identifying as having done something to reduce GHG emissions (SoC4), do not have as high a WTP as people who perform many environmental behaviors (GEB4); People identifying as not believing in climate change (SoC1) have a lower WTP than people who have low environmental attitudes in general (NEP1); People identifying as having done something to reduce GHG emissions (SoC4) do not have as high a WTP as people who perform many environmental behaviors (NEP4). However, the WTP difference is generally small between the CC-SoC and the NEP/GEB measures.
Figure 5. Difference of willingness-to-pay for between CC-SoC and NEP/GEB measures under different information framings.
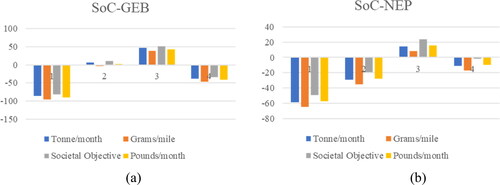
Therefore, all parameters are similar for these five models and WTP difference between CC-SoC and GEB/NEP measures is very small under different information framings, which means the CC-SoC measure can be sufficient as a substitute for the more involved and more complex measures of environmental behavior (GEB) and attitude (NEP).
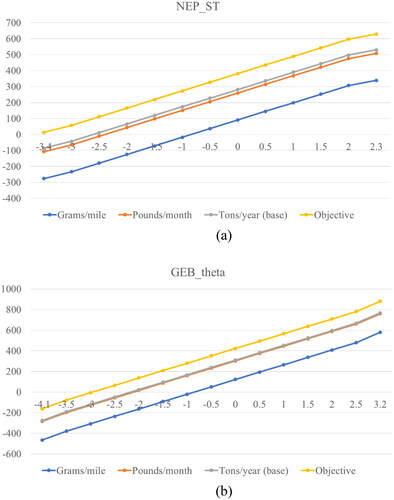
For the NEP (sum) and GEB (theta) continuous values, shows the WTP under different information framings. The distributions of NEP and GEB standardized values have similar trends with higher willingness-to-pay for CO2 emissions along with the increase in NEP/GEB values. One difference between these continuous values and the quartiles is that for the quartiles there is a non-linear increase from one stage to the next (i.e. the steps from quartile 1 to 2 and 3 to 4 are larger than from 2 to 3). The rank of WTP from high to low for different information framings is a societal objective, CO2 emissions as tons per year, CO2 emissions as pounds per month, and CO2 emissions as grams per mile. The WTPs under framing of tons per year and pounds per month are not statistically different. For the societal objective framing, the analysis by NEP shows that even those with very low environmental attitudes still have a higher WTP than people who have the stronger environmental attitudes when the information is framed by grams/mile. For the GEB, those who have the lowest theta values have a WTP of nearly $300 for the societal objective framing, whereas this is only achieved by those who conduct more (and more difficult) environmental behaviors when the grams per mile framing is used.
Figure 6. Revealed willingness-to-pay for summed NEP and GEB values under different information framings.
5. Discussion
This research aimed to examine whether a measure, CC-SoC, based on a single question of climate change concern and action, could be used in place of more complex measures such as the GEB and NEP. The results in suggest that the substitution of the CC-SoC in place of GEB and NEP measures whether as continuous variable or as quartiles produced models of the same explanatory power (R2 of 26.3%) and measures of model fit (<0.2% difference). In addition, the socio-demographic correlates found for CC-SoC were mostly in line with those reported in a review of climate change attitudes (McCright et al. Citation2016).
5.1. Substituting CC-SoC for GEB and NEP
As described above, the GEB and NEP measures are established measures of environmental attitudes, but require numerous questions (50 and 15 respectively) and further treatment before they can be used in analysis. This creates a burden for both the respondents and the researcher. Climate change is a specific environmental problem. In this study, we examined whether the use of a single question on climate change with four possible responses could be reasonably used as a substitute for a more complex measure of environmental attitude when estimating how people with different environmental attitudes might respond to information and climate-related consumer choices.
Examining first the overall explanatory factors (Rho-square-bar), we see that all the results are essentially the same (26.3%). Second, the measures of model fit such as AIC and BIC along with the final log likelihood are all within 0.2% of each other. These results suggest the use of CC-SoC is a reasonable substitute for GEB and NEP in the climate change context. Considering that the CC-SoC question is one single question with four response options, and that the two other measure have 15 (NEP) and 50 questions (GEB), we suggest that the CC-SoC question is an effective means (in terms of response burden and ease-of-analyses) of capturing an individual’s climate change concern, attitude, and behavior. Further tests between these measures for other climate-related behaviors should, however, be conducted.
The outcomes of the analysis, the WTP estimates, follow similar patterns and have WTP values that are similar (). Individuals at the lowest level of the CC-SoC were found to have lower WTP than those of the lowest quartile of the GEB and NEP respondents. This, however, is logical. The lowest CC-SoC contains only people who self-identified as not worrying about climate change. As can be seen in (figures on the GEB and NEP quartiles in each CC-SoC), one can find people who conduct more general environmental behaviors (GEB) or who report more positive environmental attitudes in general (NEP). This is not contradictory as an individual may not be concerned about climate change, but they may be concerned about local garbage, recycling, and toxic pollutants and conduct behaviors related to those. Further, we used quartiles for GEB and NEP, and thus, it represents a larger portion of the population (25.5% and 29.8% respectively; ) than was identified in our study as not being concerned about climate change (13.2%).
In comparison to the top GEB quartile, the top level of CC-SoC were also estimated to be less willing to pay for emissions (). The same argument as just presented for the other end of the scale (quartile) should not apply here. What may be happening is that the GEB is better at identifying people who really do act (they perform more environmental behaviors), whereas the individuals who say that they have reduced emissions may not be doing a sufficient number of changes. Further tests will be required to establish what type of behaviors are being conducted and if some further distinction could be made. Another possibility is that people in the top CC-SoC have declared that they have reduced emissions and are thus less motivated to take further action; they believe that they have already made sacrifices, so they are justified in relaxing for other choices.
The CC-SoC measure does not consider the impact of the behaviors. Recent research has highlighted that at least for governments, the focus is often on behaviors with little impact (Wynes and Nicholas Citation2017). An individual may simply recycle and believe that this is action for climate change and thus identify themselves at the top stage of change. Another individual may have stopped driving, moved to a location that supports that, and makes the physical effort to cycle places. According to Wynes and Nicholas (Citation2017); this latter action has much more impact. Such differences are not currently captured in the scale. Further steps in this research should look at the types of behaviors being undertaken, the cost (whether it be mental effort, physical effort, time costs, financial costs, etc.) with respect to their climate change impact.
5.2. Socio-demographic relationships
The socio-demographic relationships found for CC-SoC were in line with those reported in a review of climate change attitudes (McCright et al. Citation2016). However, some differences are noted and discussed here. Age does not have a consistent trend, though once someone is concerned, it seems to take time before action is taken which relates to previous findings that younger age is negatively associated (McCright et al. Citation2016). For politics, supporting previous findings (McCright et al. Citation2016), the trend finds that as people move away from the far political right, they are more likely to be further along the CC-SoC, though being strongly conservative does not eliminate people from the higher CC-SoC, with nearly half of them reporting that they are at those stages. Men are more likely to report being further along the CC-SoC, which is in contrast to some findings that show women being more concerned about the environment (McCright et al. Citation2016). The higher their education, the more likely they are to be further along the CC-SoC, which is in line with previous findings (McCright et al. Citation2016). Higher incomes are also associated with being further along the CC-SoC. However, there is the issue where people with higher incomes are likely to produce more emissions as they are able to purchase more items, take more long-distance flights, etc. Although not shown here, ethnicity was tested, but was not found to be significant when whites were compared to non-whites (which was previously found to be significant (McCright et al. Citation2016)), nor when the races were examined as White, Black/African American, Asian, and other.
5.3. Environmental attitudes and framings
In this section, how individuals with different environmental attitudes responded to the framings is discussed. As mentioned, in a previous study (Daziano et al. Citation2017) latent class modeling was used and it identified two groups. Membership in those groups was explained using mostly socio-demographic variables and environmental attitude factors. In this study, WTP by different measures of environmental attitudes was the focus. The WTP was roughly $300 between the lowest and the highest levels for these three environmental measures.
Individuals who reported not being concerned about climate change showed a negative willingness-to-pay when the information on CO2 emissions was presented as grams per mile. This would appear to say that those individuals are willing to spend more to pollute more. In this situation of next-to-no context, these individuals appeared to want to demonstrate that they are not at all concerned to the point that they are willing to pay extra just to pollute. However, when given some context, even these individuals had a willingness to pay to avoid emitting more. suggests the societal objective framing is the most effective with the highest WTP for all measures under different levels. CO2 emissions as tons per year and CO2 emissions as pounds per month have similar effects on WTP. For the societal objective framing, even those with very low environmental attitudes or having conducted fewer environmental behaviors still have a higher WTP than those people who have stronger environmental attitudes or conduct more (and more difficult) environmental behaviors when the information is framed by grams/mile.
6. Conclusions
The study demonstrated that with respect to the influence of climate change information on car purchases, a clear link with the individual’s environmental behaviors (here, car purchase choice) and attitudes can be found. The trend is logical as the more environmental behaviors one performs, or the more environmental attitudes one holds, the larger the WTP for CO2 emissions. An important point to make is that when the emissions information was presented as simply grams per mile (i.e. no context), the influence of the information was actually negative. This might suggest that as the information is so vague that individuals who are not concerned actually are motivated in the wrong direction. However, the research demonstrated that this can be overcome with better framing and that framing it with respect to society’s reduction target resulted in a significant and large influence ($510/tonne).
The study also demonstrated that the measure “climate change stage of change” (CC-SoC) produced very similar results to the General Ecological Behavior scale and the New Environmental Paradigm scale. The advantage of the CC-SoC is that it is a single question with four possible responses, whereas the GEB has 50 items and the NEP has 15. In addition, those latter two measures require that the data be transformed and summed before use in data analysis. Thus, the CC-SoC reduces respondent burden and there is no additional data treatment required for the data analyst. Considering that the measures for the models and the outcomes were highly similar, the use of CC-SoC could be an effective measure to use in similar research.
The research involved car-owning individuals from four major cities in the US, and as such does not necessarily represent people who do not yet own a vehicle, nor is the sample representative of the US population. This research applies to the presentation of CO2 emissions information and could be applied to various choice contexts where such emissions are, or could be, presented. The measure, climate change stage of change, appears to be an effective question to quickly gather information on an individual’s concern and motivation related to climate change.
Future research should examine these relationships for the general population and also make a link with different transport behaviors as some may be more important than others. An example would possibly be the difference between going car-free and switching to a hybrid or electric vehicle. This could also include behaviors such as avoiding flying to destinations. Finally, people may conduct compensatory behaviors such as making changes in other domains (residential energy efficiency, eating a vegetarian diet) may be more easily accomplished than transport changes.
6.1. Limitations
The CC-SoC is a self-reported measure and the actual behaviors of individuals are not known. However, it is perhaps more important to know how they view themselves, as opposed to what they have done or are doing. In addition, the idea here is to search for methods to reduce CO2 emissions that work across all stages and not just for those who are (highly) motivated to reduce their emissions. Further, an individual may also undertake energy conservation for economic reasons, so it is not clear whether such climate friendly behaviors are a result of concern for climate change or simply budgetary.
The sample was predominantly from individuals from North-Eastern States in the USA. Thus, the sample itself may not be representative of all Americans (differences in moral types, political views, economic contexts, exposure to climate change events, etc.). The politicization of climate change is different in the USA than in many other countries.
Supplemental Material
Download MS Word (39 KB)Supplemental data
Supplemental data for this article can be accessed online at https://doi.org/10.1080/09640568.2021.1913107.
Disclosure statement
No potential conflict of interest was reported by the author(s).
Additional information
Funding
References
- Achtnicht, Martin. 2012. “German Car Buyers’ Willingness to Pay to Reduce CO2 Emissions.” Climatic Change 113 (3-4): 679–697. doi:https://doi.org/10.1007/s10584-011-0362-8.
- Ajzen, Icek. 1991. “The Theory of Planned Behavior.” Organizational Behavior and Human Decision Processes 50 (2): 179–211. doi:https://doi.org/10.1016/0749-5978(91)90020-T.
- Anable, J., B. Lane, and T. Kelay. 2006. “Review of Public Attitudes to Climate Change and Transport: Summary Report.” The Department for Transport.
- Avineri, Erel, and E. Owen D. Waygood. 2013. “Applying Valence Framing to Enhance the Effect of Information on Transport-Related Carbon Dioxide Emissions.” Transportation Research Part A: Policy and Practice 48: 31–38. doi:https://doi.org/10.1016/j.tra.2012.10.003.
- Backor, K., S. Golde, and N. Nie. 2007. Estimating Survey Fatigue in Time Use Study, International Association for Time Use Research Conference. Washington, DC. Citeseer.
- Bliemer, Michiel C. J., John M. Rose, and Stephane Hess. 2008. “Approximation of Bayesian Efficiency in Experimental Choice Designs.” Journal of Choice Modelling 1 (1): 98–126. doi:https://doi.org/10.1016/S1755-5345(13)70024-1.
- Bierlaire, M. 2020. A Short Introduction to PandasBiogeme, Biogeme. Technical report TRANSP-OR 200605. Lausanne, Switzerland: Transport and Mobility Laboratory, ENAC, EPFL.
- Bond, Trevor. 2015. Applying the Rasch Model: Fundamental Measurement in the Human Sciences. London: Routledge.
- Brown, Katrina, W. Neil Adger, and Joshua E. Cinner. 2019. “Moving Climate Change Beyond the Tragedy of the Commons.” Global Environmental Change 54: 61–63. doi:https://doi.org/10.1016/j.gloenvcha.2018.11.009.
- Daziano, Ricardo A., and Martin Achtnicht. 2014. “Accounting for Uncertainty in Willingness to Pay for Environmental Benefits.” Energy Economics 44: 166–177. http://www.sciencedirect.com/science/article/pii/S014098831400070X. doi:https://doi.org/10.1016/j.eneco.2014.03.023.
- Daziano, Ricardo A., E. O. D. Waygood, Zachary Patterson, and Markéta Braun Kohlová. 2017. “Increasing the Influence of CO2 Emissions Information on Car Purchase.” Journal of Cleaner Production 164: 861–871. http://www.sciencedirect.com/science/article/pii/S0959652617314221. doi:https://doi.org/10.1016/j.jclepro.2017.07.001.
- Daziano, R., E. O. D. Waygood, Z. Patterson, M. Feinberg, and B. Wang. 2021. “Reframing Greenhouse Gas Emissions Information Presentation on the Environmental Protection Agency’s New-Vehicle Labels to Increase Willingness to Pay.” Journal of Cleaner Production 279:123669. doi:https://doi.org/10.1016/j.jclepro.2020.123669.
- Dunlap, R.E. 2008. “The New Environmental Paradigm Scale: From Marginality to Worldwide Use.” The Journal of Environmental Education 40 (1): 3–18. doi:https://doi.org/10.3200/JOEE.40.1.3-18.
- Dunlap, Riley E., Kent D. Van Liere, Angela G. Mertig, and Robert Emmet Jones. 2000. “New Trends in Measuring Environmental Attitudes: Measuring Endorsement of the New Ecological Paradigm: A Revised NEP Scale.” Journal of Social Issues 56 (3): 425–442. doi:https://doi.org/10.1111/0022-4537.00176.
- Fischer, Gerhard H., and Ivo W. Molenaar. 2012. Rasch Models: Foundations, Recent Developments, and Applications. New York: Springer-Verlag.
- Gaker, David, David Vautin, Akshay Vij, and Joan L. Walker. 2011. “The Power and Value of Green in Promoting Sustainable Transport Behavior.” Environmental Research Letters 6 (3): 034010. doi:https://doi.org/10.1088/1748-9326/6/3/034010.
- Gaker, David, and L. Joan Walker. 2013. “Revealing the Value of ‘Green’ and the Small Group with a Big Heart in Transportation Mode Choice.” Sustainability 5 (7): 2913–2927. doi:https://doi.org/10.3390/su5072913.
- Hawcroft, Lucy J., and Taciano L. Milfont. 2010. “The Use (and Abuse) of the New Environmental Paradigm Scale over the Last 30 Years: A Meta-Analysis.” Journal of Environmental Psychology 30 (2): 143–158. doi:https://doi.org/10.1016/j.jenvp.2009.10.003.
- Henn, Laura, Oliver Taube, and Florian G. Kaiser. 2019. “The Role of Environmental Attitude in the Efficacy of Smart-Meter-Based Feedback Interventions.” Journal of Environmental Psychology 63: 74–81. doi:https://doi.org/10.1016/j.jenvp.2019.04.007.
- Kaiser, Florian G., Katarzyna Byrka, and Terry Hartig. 2010. “Reviving Campbell’s Paradigm for Attitude Research.” Personality and Social Psychology Review: An Official Journal of the Society for Personality and Social Psychology, Inc 14 (4): 351–367. doi:https://doi.org/10.1177/1088868310366452.
- Kaiser, Florian G., and Mark Wilson. 2004. “Goal-Directed Conservation Behavior: The Specific Composition of a General Performance.” Personality and Individual Differences 36 (7): 1531–1544. doi:https://doi.org/10.1016/j.paid.2003.06.003.
- Kessels, Roselinde, Peter Goos, and Martina Vandebroek. 2006. “A Comparison of Criteria to Design Efficient Choice Experiments.” Journal of Marketing Research 43 (3): 409–419. doi:https://doi.org/10.1509/jmkr.43.3.409.
- Lange, F., and S. Dewitte. 2019. “Measuring Pro-Environmental Behavior: Review and Recommendations.” Journal of Environmental Psychology 63: 92–100. doi:https://doi.org/10.1016/j.jenvp.2019.04.009.
- McCright, Aaron M., Sandra, T. Marquart-Pyatt, Rachael L. Shwom, Steven R. Brechin, and Summer Allen. 2016. “Ideology, Capitalism, and Climate: Explaining Public Views about Climate Change in the United States.” Energy Research & Social Science 21: 180–189. doi:https://doi.org/10.1016/j.erss.2016.08.003.
- Merrell, C., and P. Tymms. 2005. “Rasch Analysis of Inattentive, Hyperactive and Impulsive Behavior in Young Children and the Link with Academic Achievement.” Journal of Applied Measurement 6 (1): 1–18.
- Milfont, Taciano L., and John Duckitt. 2010. “The Environmental Attitudes Inventory: A Valid and Reliable Measure to Assess the Structure of Environmental Attitudes.” Journal of Environmental Psychology 30 (1): 80–94. doi:https://doi.org/10.1016/j.jenvp.2009.09.001.
- Peytchev, A., and E. Peytcheva. 2017. “Reduction of Measurement Error Due to Survey Length: Evaluation of the Split Questionnaire Design Approach.” Survey Research Methods 11 (4): 361–368.
- Prochaska, James O., and Wayne F. Velicer. 1997. “The Transtheoretical Model of Health Behavior Change.” American Journal of Health Promotion: AJHP 12 (1): 38–48. doi:https://doi.org/10.4278/0890-1171-12.1.38.
- Prochaska, James O., and John C. Norcross. 2001. “Stages of Change.” Psychotherapy: Theory, Research, Practice, Training 38 (4): 443–448. doi:https://doi.org/10.1037/0033-3204.38.4.443.
- Prochaska, James O., Colleen A. Redding, and Kerry E. Evers. 2015. “The Transtheoretical Model and Stages of Change.” In Health Behavior: Theory, Research, and Practice, edited by K. Glanz, B. K. Rimer, and K. V. Viswanath, 125–148. San Francisco, CA: Jossey-Bass/Wiley.
- Rasch, Georg. 1993. Probabilistic Models for Some Intelligence and Attainment Tests. Chicago: MESA Press.
- Roczen, Nina, Florian G. Kaiser, Franz X. Bogner, and Mark Wilson. 2014. “A Competence Model for Environmental Education.” Environment and Behavior 46 (8): 972–992. doi:https://doi.org/10.1177/0013916513492416.
- Sun, Yilin, E. Owen D. Waygood, Kenichiro Fukui, and Ryuichi Kitamura. 2009. “Built Environment or Household Life-Cycle Stages: Which Explains Sustainable Travel More? Case of Kyoto–Osaka–Kobe, Japan, Built Area.” Transportation Research Record: Journal of the Transportation Research Board 2135 (1): 123–129. doi:https://doi.org/10.3141/2135-15.
- Swim, Janet, Clayton Susan, Doherty Thomas, Gifford Robert, Howard George, Reser Joseph, Stern Paul, and Elke Weber. 2009. Psychology and Global Climate Change: Addressing a Multi-Faceted Phenomenon and Set of Challenges: A Report by the American Psychological Association’s Task Force on the Interface Between Psychology and Global Climate Change. Washington, DC: American Psychological Association.
- Taube, O., A. Kibbe, M. Vetter, M. Adler, and F.G. Kaiser. 2018. “Applying the Campbell Paradigm to Sustainable Travel Behavior: Compensatory Effects of Environmental Attitude and the Transportation Environment.” Transportation Research Part F: Traffic Psychology and Behavior 56: 392–407. doi:https://doi.org/10.1016/j.trf.2018.05.006.
- Waygood, E.O.D., and E. Avineri. 2011. “Does ‘500g of CO2 for a Five Mile Trip’ Mean Anything? Towards More Effective Presentation of CO2 Information”, Paper presented at the Transportation Research Board 90th Annual Meeting, Washington, DC, July 23–27.
- Waygood, E. O. D., and E. Avineri. 2016. “Communicating Transportation Carbon Dioxide Emissions Information: Does Gender Impact Behavioral Response?” Transportation Research Part D: Transport and Environment 48: 187–202. doi:https://doi.org/10.1016/j.trd.2016.08.026.
- Waygood, E. Owen D., and Erel Avineri. 2018. “CO2 Valence Framing: Is It Really Any Different from Just Giving the Amounts?” Transportation Research Part D: Transport and Environment 63: 718–732. doi:https://doi.org/10.1016/j.trd.2018.07.011.
- Wynes, Seth, and Kimberly A. Nicholas. 2017. “The Climate Mitigation Gap: Education and Government Recommendations Miss the Most Effective Individual Actions.” Environmental Research Letters 12 (7): 074024. doi:https://doi.org/10.1088/1748-9326/aa7541.