
Abstract
Strategies applied by urban policy makers in order to achieve sustainable city development may be in conflict with each other because it crosses many disciplines and policy areas. This research focusses on the dilemma between compact city and urban greenspace policies and their influence on actual land-use change in Amsterdam and Brussels. These cases are selected because of their similar urban growth yet diverse policy and governance contexts. We contend that comparing how urban policies try to address this dilemma can provide a deeper understanding of how policy strategies affect land-use change. The results show that densification indeed decreases the quantity (Amsterdam: −4.7% Brussels: −11.9%), average size (A: −3.1% B: −25.6%) and connectivity of urban greenspaces. Observed land-use changes seem disconnected from purported urban greenspace policies, whereas urban development plans seem to dominate changes in greenspace quantity and form.
1. Introduction
Over recent decades, the topic of sustainable urban development has gained political momentum (Hansen et al. Citation2019). In 2015, the United Nations (UN) set 17 Sustainable Development Goals in which goal #11 is dedicated to “make cities and human settlements inclusive, safe, resilient and sustainable” (UN Citation2015, 14). Consequently, cities have developed policy strategies to meet this ambition (Karteris et al. Citation2016). These strategies, however, are multifaceted, cross several policy sectors and goals, and can be contradictory. One of the areas of friction is the dilemma between planning a compact and a green city. Both compact city development and urban greenspace (UGS) are argued to be important for sustainable development, yet densification within limited space is also shown to put green areas under pressure (Artmann et al. Citation2019; Delshammar Citation2014; Haaland and van den Bosch Citation2015). This means that there is a tension between these two sustainable development ambitions often explicated in urban planning policies, whereby it seems very difficult to achieve a more compact city without losing urban greenspace.
The compact city is an urban form characterized by high density development and mixed land-use. It aims for a clear separation between the city and the countryside with ample provision of services to urban dwellers (Russo and Cirella Citation2018). Advocates of this planning principle argue that it encourages more sustainable forms of transport – through more efficient public transport and environments amenable to walking and cycling – lower energy needs, and reduces land usage (Van Der Waals Citation2000; Rudolf, Kienast, and Hersperger Citation2018)). This latter point therefore allows greater preservation of natural land beyond the urban edges. It is further associated with higher degrees of social diversity and economic and cultural development (Burton Citation2002; Westerink et al. Citation2013; Adelfio et al. Citation2018). It is commonly assumed by local governments that a compact urban form is one of the best policy measures to counteract the negative effects of urban development on the environment and society (Artmann et al. Citation2019; Khoshkar, Balfors, and Wärnbäck Citation2018; Tappert, Klöti, and Drilling Citation2018).
Despite the positive connotations of compact city development, there has been concern among academics, politicians and the public on its potential negative consequences for greenspace within the city (Delshammar Citation2014). A growing body of literature addresses the provision of urban greenery as a pressing issue in compact city development (Byomkesh, Nakagoshi, and Dewan Citation2012; Haaland and van den Bosch Citation2015). Studies have shown that urban growth through redevelopment and infill strategies inevitably causes a decrease in greenspaces (Giezen, Balikci, and Arundel Citation2018; Jim and Chan Citation2016; Tian, Jim, and Wang Citation2014; Wang and Chan Citation2019). As a result, highly densified urban areas often lack the essential ecosystem services greenspace provides such as outdoor recreation, air purification, biodiversity, cooling, carbon storage, water infiltration and noise reduction (Ten Brink et al. Citation2016; Kabisch Citation2015; Zhang et al. Citation2017).
A lack of greenspace planning policies, such as a city-wide green plan, mandatory green requirements in developments or strict zoning, has been attributed as an important driver behind UGS deficiency in densified areas (Colsaet, Laurans, and Levrel Citation2018; Dallimer et al. Citation2011; Giezen, Balikci, and Arundel Citation2018; Khoshkar, Balfors, and Wärnbäck Citation2018). Nevertheless, limited empirical studies (primarily Dallimer et al. Citation2011; Giezen, Balikci, and Arundel Citation2018) have been conducted that investigate the influence of urban planning policies on the actual cumulative changes of greenspace development in relation to urban densification. In particular, case studies that compare the effects of local policies are rare (Colsaet, Laurans, and Levrel Citation2018; Haaland and van den Bosch Citation2015). There is a pressing need to understand how different policy approaches can contribute to mitigating or exacerbating tensions between compact city development and the provision of UGS (Gaigné , Riou, and Thisse Citation2012). Monitoring change in land use can also raise awareness amongst planners and policymakers of interconnected but potentially contradictory sustainability outcomes of urban development (Hansen et al. Citation2019; Khoshkar, Balfors, and Wärnbäck Citation2018). For example, analyzing net land-use changes over time can directly assess how planning policies, such as green space and urban densification principles, impact overall urban development and whether adjustments are needed to achieve the desired outcome.
The main focus of this article is in examining the relationship between compact city and UGS planning policies with changing land-use patterns of greenspace provision. To this end, this paper presents a comparative mixed-method case study of two cities both facing growing populations and a high demand for housing but exhibiting diverse policy contexts: Brussels and Amsterdam. A GIS analysis using remote sensing is performed to investigate land-use change from 2003 to 2016, focusing on trends in greenspace quantity, distribution and form. This is coupled with a policy analysis to assess how spatial planning policies over the period may explain observed changes. The study aims to give insights into the tension between the spatial planning goals of densification and UGS provision. The paper starts with an account of the literature on the compact city, UGS and the influence of planning policies on land-use change. This is followed by an introduction of the two cases, an outline of the methodology and data used for analysis, and a presentation of the results. The paper concludes with a discussion of the findings’ wider significance toward urban sustainability and planning policy.
2. The compact city, urban greenspace and the influence of planning policy
2.1. The compact city
As noted above, the compact city is a commonly applied concept toward achieving sustainable urban development (Burton Citation2002; Haaland and van den Bosch Citation2015). Its advocates argue that compact development is more sustainable and desirable than urban sprawl (Artmann et al. Citation2019). The decades following WWII were characterized by a scattered and patchy pattern of low density development surrounding the urban fringe that saw a rapid expansion of the spatial ‘footprint’ of cities and a rise of an automobile-dominant urban form (Patacchini and Zenou 2006). The compact city, on the other hand, presents a vision to counter urban sprawl through high-density urban growth that is seen to (1) lower energy use as higher densities commonly consume less energy per capita, (2) reduce vehicle and transport emissions through allowing more efficient public transport systems and an urban layout that promotes cycling and walking, and (3) promote conservation of greenspaces outside the urban boundaries by intensifying the use of existing urban land (Burton Citation2002; Westerink et al. Citation2013). Its proposed intensification can be achieved by the development of new buildings within urban areas which previously were not built-up (infill), replacement of lower-density buildings with high-rise buildings through redevelopment (Haaland and van den Bosch Citation2015), or revitalization of vacant properties (transformation) (Kremer and Hamstead Citation2015). As brownfield development and urban densification are associated with higher costs than greenfield development, strong planning policies are necessary in guiding market parties toward compact city growth (Colsaet, Laurans, and Levrel Citation2018; Patacchini and Zenou 2006). Conversely, this also means that urban sprawl is more likely to occur in cities with less directive policies and a weaker planning department.
Despite the positive claims associated with compact city growth, the concept has been increasingly debated since the 1990s (Haaland and van den Bosch Citation2015; Neuman Citation2005). The assumptions that it reduces energy usage and traffic, for example, have been challenged (e.g. Gray, Gleeson, and Burke Citation2010; Melia, Parkhurst, and Barton Citation2011). Moreover, while one of the main rationales behind the compact city paradigm has been its ostensible promise of conservation of greenspace beyond the urban edge, the loss of greenery inside the urban agglomeration due to densification has often been overlooked and is becoming an increasing matter of concern amongst scholars and policymakers (Dallimer et al. Citation2011; Jim and Chan Citation2016; Xu, Haase, and Pauleit Citation2018; Salvati and Lamonica Citation2020). Strategies to integrate ‘green-gray’ infrastructure, such as green roofs, front gardens, green balconies, pocket parks or vegetation on wires (Delshammar Citation2014), commonly lack the scale of impact to counter the tradeoff between urban greenspace and densification (Artmann et al. Citation2019; Irga et al. Citation2017).
2.2. Urban greenspace and causes of its loss
Haaland and van den Bosch (Citation2015) provide a valuable overview of growing evidence of the loss of UGS due to densification processes in contexts around the world (e.g. Byomkesh, Nakagoshi, and Dewan Citation2012; Pauleit, Ennos, and Golding Citation2005; Rafiee, Dias, and Koomen Citation2013). Densification – mainly infill development – is attributed as the primary cause of UGS removal (Colsaet, Laurans, and Levrel Citation2018). These processes have been found to affect the quantity, connectivity, accessibility, size and quality of greenspaces (Kabisch et al. Citation2016; Tian, Jim, and Wang Citation2014; Zhang et al. Citation2017).
The loss of greenspace has fundamental implications on the livability and sustainability of cities for urban dwellers and wildlife, as larger and more connected greenspaces offer important amenity and biodiversity values (Goddard, Dougill, and Benton Citation2010). Declining greenspace also has a negative impact on air quality and thermal comfort given the role of greenspace in improving fresh air circulation and mitigating the urban heat island effect (Artmann et al. Citation2019; Karteris et al. Citation2016). Less greenspace further entails lower carbon storage (Davies et al. Citation2011), reduced climate and water regulation (Bowler et al. Citation2010). These environmental consequences are coupled with greenspace’s role as a key societal amenity (Kabisch Citation2015). Accessibility to public greenspaces has been shown to be important for the mental and physical health of urban dwellers as it offers possibilities for stress restoration, physical activity and social interaction (Ten Brink et al. Citation2016). Independent from quantity, the quality of greenspace is also key to its usability and associated positive environmental effects (Zhang et al. Citation2017).
Studies that comprehensively attempt to explain why densification causes losses in UGS are rare (Artmann et al. Citation2019; Colsaet, Laurans, and Levrel Citation2018; Giezen, Balikci, and Arundel Citation2018). Previous studies have confirmed that densification processes negatively influence UGS by applying GIS methods (Giezen, Balikci, and Arundel Citation2018). Inquiries that have tried to explain this relationship have found several causes. Khoshkar, Balfors, and Wärnbäck (Citation2018) underlined a lack of new greenspace planning in the initial stages of the infill development process as an important cause. Their research has shown that planning for greenspace at the start of the planning process is crucial to more successful greenspace implementation. This is particularly the case when land costs are high. High land prices accompanied by strong housing demand make it financially less lucrative to develop/preserve greenspace, even where the positive impacts of UGS are recognized by municipal authorities. Additionally, developing UGS has been more successful in contexts where the local government owns a large amount of land (as it does not have the be bought first to develop UGS), alongside stronger regulatory potential for public space demands on development (Wang and Chan Citation2019; Gerber and Gerber Citation2017).
2.3. The influence of planning policies on UGS
While contextual factors such as demographic, economic, and social processes, as well as infrastructure and transport play an important role in the indirect loss of UGS, most studies on land-use change emphasize that it is greatly shaped by institutions and policies (Colsaet, Laurans, and Levrel Citation2018). Researchers have emphasized that concrete regulatory policies that take into account a long-term perspective on UGS needs, opportunities and strategies at a scale beyond singular development parcels are central to mitigating greenspace loss (Artmann et al. Citation2019; Irga et al. Citation2017; Jim and Chan Citation2016; Xu, Haase, and Pauleit Citation2018). For example, Dallimer et al. (Citation2011) have shown the extent that spatial patterns of greenspace in UK are responsive to changes to relevant national-level planning policies.
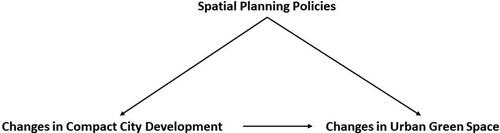
Nonetheless, empirical studies that explore the cumulative effects of spatial planning policies across different countries on land-use changes are rare (cf. Giezen, Balikci, and Arundel Citation2018). As a result, uncertainty exists on the causes of land-use change and their relationship to planning policies (Colsaet, Laurans, and Levrel Citation2018). A comparative approach across different policy contexts can help to enhance our understanding of the influence of policies on cities underdoing densification (Kabisch Citation2015). This offers policy-relevant insight into fostering a balance between compact growth and UGS provision (Jim and Chan Citation2016). This study therefore chooses to focus on how spatial planning policies relate to changes in compact city development and urban greenspace provision. illustrates the hypothesized relationships between the dependent outcome (changes in urban greenspace and compact city development) and independent variables (compact city and greenspace policies).
Figure 1. Conceptual scheme.
3. The case studies of Brussels and Amsterdam
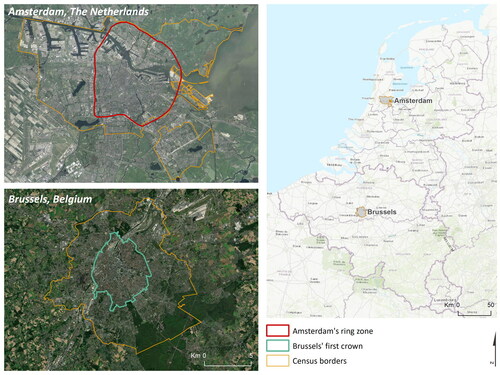
Two diverse cases are selected to investigate the influence of different spatial planning policies on land-use changes. Amsterdam (The Netherlands) is selected as a representative case of a city with a long tradition of compact city policies and a strong centralized planning governance (Westerink et al. Citation2013). Brussels (Belgium) is chosen as a representative case of a city with a tradition of suburbanization, more minimally-regulated central neighborhood redevelopment,Footnote1 and a more decentralized and fragmented planning governance (Boussauw, Allaert, and Witlox Citation2013; Poelmans and Van Rompaey Citation2009). Hence, the densification policies of these cities have been characterized as largely opposite approaches (Colsaet, Laurans, and Levrel Citation2018). Nevertheless, both are experiencing similar challenges in accommodating substantial population growth while ensuring the provision of greenspace (Boussauw, Allaert, and Witlox Citation2013). Comparing how their urban policies try to address this dilemma can provide a deeper understanding of how policy strategies affect land-use change (Kabisch Citation2015). Given its explicit compact city policies, it is expected that Amsterdam would have more development inside the urban core of the city than in Brussels. The urban core can be defined in Amsterdam by the area within the A10 highway ring, with the analogous boundary for Brussels being the ‘first crown’ (première couronne/eerste kroon), roughly representing in both cities the areas developed up to the early decades of the 20th century. Therefore, the analyses will additionally compare the spatial temporal changes within the ring/first crown to areas outside these. situates the case study locations.
Figure 2. Location of case studies.
Source: OIS (2018); Statbel (Citation2018); Esri (Citation2019). Design by author.
4. Methodology
4.1. Analysis and data
To explore the influence of spatial planning policies on land-use change, two research methods are applied: (1) GIS analysis, using quantitative census data and satellite imagery and (2) policy-analysis of policy documents complimented by in-depth interviews with key policymakers.
For the GIS analysis, census data is obtained from government statistics websites (CBS/OIS for Amsterdam; Statbel for Brussels). Satellite imagery is retrieved from Digital Globe, a commercial company that provides high-quality satellite images. UGS is often scattered and relatively small in size, making high spatial resolution imagery necessary to capture it adequately (Qian et al. Citation2015; W. Zhou et al. Citation2018; X. Zhou and Wang Citation2011). Satellite images from Worldview-2 (with a pixel resolution of 0.46 meters), GeoEye-1 (again, 0.46 meters) and Quickbird (0.64 meters) were used for the analysis. The selected images provided 0% cloud coverage and were taken in spring/summer months when vegetation is similarly prolific. Imagery resolution and quality requirements, the desire to cover more than a decade, and the need for maximum comparability across the cities, led to the selection of our analysis period of 2003 to 2016. The images do not quite cover the whole area with, for both cities, it being possible to capture 93% of the target study area. summarizes satellite imagery details.
Table 1. Satellite images and band information.
Remote sensing is an adequate and well-established tool to detect changes in land-use patterns (Byomkesh, Nakagoshi, and Dewan Citation2012; Dallimer et al. Citation2011; Giezen, Balikci, and Arundel Citation2018; Qian et al. Citation2015). Unfortunately, the use of remote sensing in empirical analysis of the effects of policies is difficult to find. Existing studies focus on describing the changes in the landscape without attempting to explain the observed phenomenon (cf. Karteris et al. Citation2016; Mahmoodzadeh Citation2007; Patino and Duque Citation2013). However, a limited body of work has shown that combining remote sensing with local policy knowledge can help explain observed land-use changes (Byomkesh, Nakagoshi, and Dewan Citation2012; Dallimer et al. Citation2011; Giezen, Balikci, and Arundel Citation2018). At the same time, a dynamic analysis of land-use patterns can crucially inform planning and policymaking allowing more rapid and appropriate responses to local context and needs, as well as policy evaluation at the macro-level of city land-use transformation (Hansen et al. Citation2019; Khoshkar, Balfors, and Wärnbäck Citation2018; Qian et al. Citation2015; X. Zhou and Wang Citation2011).
4.1.1. Land-use classification
The remote sensing analysis involved a process of supervised land-use classifications, using the geoprocessing software ArcGIS, to identify greenspace and non-greenspace. Greenspace in this study is understood as any vegetation found in the urban environment including parks, open spaces, residential gardens and street trees (e.g. Kabisch and Haase Citation2014). To ensure comparability of the images, all images were first processed to the same resolution of 0.64 meters per pixel. The bands panchromatic, blue, red green and Near Infrared (NIR) were composed to produce images for the supervised land-use classification. Following classification, a filtering procedure was applied to remove isolated pixels from the classification output as well as a ‘boundary clean’ in order to smooth ragged edges of class boundaries to increase spatial coherency. Given that some ambiguity arose in distinguishing water from shadows in the classification process, the output was then combined with a detailed shapefile of waterbodies to distinguish three final classes: greenspace, water, and all other urban land (including barren land). The data for the waterbodies is from 2017 (CBS) in Amsterdam and 2019 in Brussels (Statbel). The shapefile was corrected manually for any known changes in water between 2003 and 2016.
In addition, an assessment was undertaken to assess the accuracy of the classification results. This was done through generating 60 random control points per class (180 in total for each city per year). The original satellite images were used to carry out the ground-truth assessment with consultation via additional secondary sources, such as Google Maps imagery, if ambiguity arose. The derived classification output for Amsterdam has an overall accuracy and kappa coefficient of 98.33% and 0.975 respectively for 2003 and 98.33% and 0.975 for 2016 (see ). The overall accuracy and kappa coefficients for Brussels are similarly 98.33% and 0.975 for 2003 and 97.22% and 0.958 for 2016. (See ). This points to an amply sufficient level of accuracy in the classification process.
Table 2. Amsterdam classification accuracy assessments.
Table 3. Brussels classification accuracy assessments.
4.1.2. Change Analysis
The output of the land-use classification and analysis of the statistical census data served to determine changes in UGS and density. Existing literature has shown that densification can have an influence on the quantity, connectivity, size, quality and accessibility of UGS (Kabisch et al. Citation2016; Tian, Jim, and Wang Citation2014; Zhang et al. Citation2017). Based on the literature and available data, the dimensions of quantity, connectivity and size are operationalized to measure changes in UGS across Brussels and Amsterdam. Evaluation of quality and accessibility, while an important further avenue of research, is beyond the scope of this research. The study thus focusses on a holistic assessment of pressures on all urban greenspace, regardless of ownership/accessibility or individual quality characteristics.
Central to the concept of the compact city is densification, therefore, density is used as a primary indicator to measure compact city development (Haaland and van den Bosch Citation2015). Densification is commonly calculated in terms of population density, which is the number of inhabitants per spatial unit. However, this does not necessarily capture how densely an area is built up. Low population, industrial and commercial areas would be a clear example where dense built environments are not reflected in population counts. This is especially relevant in the case of greenspace conservation because development on land creates pressure on greenspace beyond the density of actual inhabitation (Burton Citation2002; Lin, Meyers, and Barnett Citation2015). One solution is to measure the Floor Area Ratio (total amount of floor space to total land area) as a more accurate calculation of built-up density (Abdullahi, Pradhan, and Jebur Citation2015). Unfortunately, no data on aggregate floor space is available for Brussels. Therefore, alongside population density, a measure of ‘building density’ (km2 of built-up area/km2 of total land area) was used an as alternative to indicate how much of the land consists of built-up area. All indicators are listed in .
Table 4. UGS and compact city indicators.
The indicators on total quantity, greenspace per capita, average size of greenspace areas, population density and building density were calculated using ArcGIS. Patch density was measured using the FRAGSTATS analysis software. Looking at patch density gives an insight into how connected or fragmented greenspaces are through an assessment of the average number of patches per 100 hectares (Tian, Jim, and Wang Citation2014; McGarigal Citation2015).
4.1.3. Policy analysis and interviews
In addition to the GIS investigation, an analysis of policy documents is carried out in assessing the local spatial planning context. This was complemented by in-depth interviews with key policymakers in the field of urban planning and greenspace development. Several policy documents were analyzed, including both cities’ Strategic Development plans. Additionally, six interviews with key policymakers (four with the Municipality of Amsterdam and three with the Brussels Capital-Region) were carried out. These interviews focused on urban development policies, urban greenspace policies and the interaction between those two policy fields. lists the interviewees and their occupation. Transcripts of the interviews were analyzed through classification into categories of ‘urban development’, ‘UGS development’ and ‘integration of both’. The same was applied in analyzing the policy documents. Using broader themes instead of more complex categorizations was chosen given the aim of providing context and identifying potential explanatory factors for the observed macro-level land-use changes.
Table 5. List of interviewees.
5. Land-use change results
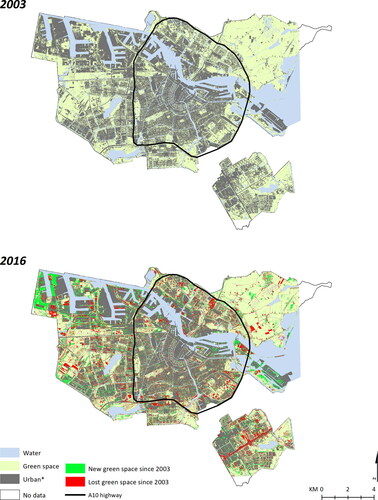
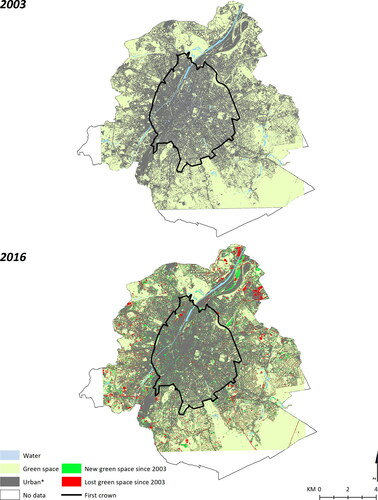
Our first empirical step looked at observed land-use changes between 2003 and 2016. and – for Amsterdam and Brussels, respectively – present changes across the three land-use classifications: water (blue), greenspace (green) and built-up area/barren land (grey). Changes in lost and new greenspace are highlighted in the 2016 images. As can be seen in , Amsterdam shows a dispersed pattern of new and lost greenspace. New greenspace in the harbor area and in the Western edges of the city are clearly noticeable. Other new greenspaces can be observed in the islands in the water channel to the East of the center. This area represents IJburg a significant new city development on reclaimed land. On the other hand, not many clearly visible new greenspaces are seen inside the ring. When it comes to loss of greenspace, areas can be observed throughout the city such as the removal of greenspace in the South-East exclave of Amsterdam. Several losses are seen along the areas bordering the A10 ring road. Turning to land-use changes in Brussels (), a smaller amount of new greenspace can be observed in comparison to the Amsterdam context. The 2016 change map for Brussels highlights a particularly widespread loss of greenspace areas. On the other hand, the most visible new greenspace is the development of a park in the North, along the canal. Furthermore, some minor new greenspaces can be seen scattered through the city. Most prevalent loss is apparent in the North/North-West of Brussels. Other loss can be viewed throughout the city, but in larger quantities along the edges of the city.
Figure 3. Land-use changes in Amsterdam.
Source: Digital Globe (Citation2003, Citation2016). Design and calculations are made by the authors.
*Urban land includes built-up space as well as non-vegetated barren land.
shows the statistics for the land-use variables and the change over the period from 2003 to 2016 in Amsterdam and Brussels at the city-level as well as separately for the area within and outside the ring zone/first crown boundary. The overall result is that there has been a clear decline in greenspace in both cities while, conversely, urban density has increased. At the city-level, greenspace has decreased in Amsterdam by 3.69 square kilometers. In Brussels, it has decreased by 9.19 square kilometers. This represents a relative decline in the total amount of urban greenspace of −4.7% for Amsterdam and −11.9% for Brussels over the 13-year period. Greenspace is also more fragmented and smaller in size within the central areas which, as expected, represent the part of the city with higher population and building densities.
Table 6. Land-use statistics.
Looking at developments in greenspace availability (), we see that while the quantity of greenspace decreased in Amsterdam, the average greenspace size did not substantially shrink. There are some clear differences, however, in developments inside and outside the ring zone. Greenspace within the Amsterdam ring zone decreased the most percentagewise at −8.7% compared to −3.0% outside the ring. Greenspace availability trends in Brussels show similar overall patterns but also some notable distinctions compared to Amsterdam. In Brussels, the absolute decrease in greenspace is many times higher outside the first crown. Nonetheless, when looking at percentage change, the decline was again stronger within the urban core area – at −13.9% versus −11.8% outside the first crown – reflecting the very small share of greenspace in the central area to begin with.
In terms of greenspace per capita, for both cities, this measure is substantially lower within the urban core. Brussels, however, consistently exhibits lower greenspace per capita values than in Amsterdam. Furthermore, in contrast to Amsterdam, the highest relative decrease in UGS percentagewise occurred outside the inner city of Brussels. This difference may be explained by the already existing much denser urban pattern inside the first crown, with densification potential occurring through redevelopment of already built land. At the same time, absolute greenspace loss and change in building density point to loss of greenspace particularly in the peripheral areas outside the first crown. This trend is also in line with the suburbanization tradition in Brussels that has promoted development outside the city center (Boussauw, Allaert, and Witlox Citation2013; Poelmans and Van Rompaey Citation2009).
When looking at the average size and connectivity (patch density) of greenspace we find some key differences between the cases. While both cities saw declines in average greenspace size, the decline in Brussels was more pronounced both in absolute and percentage declines, particularly regarding the latter. In Brussels, the findings further reveal that the average size of greenspace has decreased the most outside the first crown. For both cities, the relative declines are strongest inside the urban cores; however, the differentiation for Brussels is minimal. The strongest change in patch density is also apparent inside the ring zone, indicating that greenspace has become more fragmented in these central areas. While Amsterdam displayed a marginal increase in patch density, this measure has increased substantially more in Brussels, indicating a particularly strong trend toward greenspace fragmentation.
Looking at density, population measures have increased quite substantially across both cities. In Amsterdam, population density has risen substantially overall, but this is especially true within the ring zone which saw an increase of +818 people per square kilometer (versus +273 outside the ring). In Brussels, population densities are both higher overall and have increased even more strongly in than in Amsterdam. On the other hand, building density has increased more strongly in Amsterdam (by 27.5% overall) with once again the increase being more pronounced inside the ring zone (+32.7%). These density trends appear in line with the compact city development and the policy of densification. As our findings show, Brussels’ increase in building density has primarily occurred outside the first crown, reflecting both the already dense urban pattern within the core of Brussels and apparent stronger trends of suburban sprawl relative to the findings for Amsterdam. Yet it is also clear that Brussels follows a compact city development, as the population density increased strongly relative to the building density.
Our findings thus suggest that a key difference between the cities lies in the decline and fragmenting of greenspace as a consequence of their densification processes. Compared to Amsterdam, the decline in greenspace in Brussels is both more extensive in quantity and starkest in terms of shrinking average size and decreasing greenspace connectivity. Furthermore, Brussels exhibits relatively greater decline in the periphery than in the Amsterdam case reflecting a stronger pattern of suburban sprawl over the period.
6. Relating land-use changes to municipal policies and governance structure
6.1. Municipal urban greenspace and development policies
The second step of the research was to relate the observed land-use changes to relevant policy developments over the period and municipal governance structure. lists the key relevant policy instruments associated with UGS and urban development over the research period for Amsterdam and Brussels. We identify here key policies in each of the cities for the relevant policy areas related to urban greenspace and development. A structured approach across generalizable policy areas both facilitates comparison between the cases and provides a useful tool for future comparative research across other municipal contexts.
Table 7. Key policy instruments for urban greenspace and development.
The land-use changes that we observed are less reflected in key policies related to UGS than in those on urban development. Greenspace decreased in both cities (as reported in ) despite existing policies to preserve and promote them. This appears to contravene the greenspace policies we have identified in both cities (see ) which include explicit regulations to protect existing greenspaces as well as those in place to require and promote new greenspace creation through facilitating legal approval, providing subsidies, or setting minimum thresholds for greenspace area. It is quite striking that despite the apparent legal protection of UGS and policies for the promotion of additional greenspace, our land-use analysis has shown clear overall declines in both cities over the period. It seems that in both cities, the legal protection of UGS does not, in practice, translate to a halting of any development within green spaces. It appears that in the face of pressure to provide housing, developments are allowed to take place in some green areas. With larger protected areas, our mapping of greenspace change pointed to development particularly taking place at the edges, suggesting incremental adjustments to the zoning.
When looking into specific details of the policies, we can observe clear geographical links between urban development plans and where loss of greenspace is observed, supporting a causal link. For example, in the ‘Structure vision Amsterdam 2040’, the municipality put forth an emphasis on development along the ring road (Municipality of Amsterdam Citation2011). This can be clearly related to the pattern of substantial loss of greenspace following the route of the ring road visible in . Similarly, significant areas of greenspace loss in Brussels can be traced back to urban development plans. For example, the areas in the North and North-West of Brussels where a substantial decline in greenspace is apparent in , have been designated for urban development since the ‘Regional Development Plan’ of 1995.
Figure 4. Land-use changes in Brussels.
Source: Digital Globe (Citation2003, Citation2016). Design and calculations are made by the authors.
*Urban land includes built-up space as well as non-vegetated barren land.
Further policies related to the form of greenspace also seem to be contradicted by the developments on the ground. One of the main greenspace policies in Brussels is to realize a network of connected greenspaces throughout the city. Conversely, our data () reveals that overall connectivity has decreased significantly, as indicated by evidence of increasing fragmentation measured through patch density. On the other hand, policies in Amsterdam that emphasize the importance of quality over quantity are beyond the scope of our assessment. In other words, we are not able to determine to what extent decline in the ‘quantity’ of greenspace in the city can be compensated by increasing ‘quality’ of remaining UGS. Furthermore, the Amsterdam municipality also aims to promote the creation of small greenspaces by means of green roofs and pocket parks. This could, on the one hand, partially explain the increase in patch density. On the other hand, it also is a symptom of densification in which larger greenspace areas may be broken up into smaller patches.
When comparing changes in urban development between the two cities, the policies of the Municipality of Amsterdam centered on compact city goals might account for the fact that Amsterdam has increased more in building density within the urban core than Brussels. Conversely, Brussels shows a strong increase outside the inner city. These differentiated trends are in line with the strong compact city policy of Amsterdam to densify in existing urban areas versus the lack of any clear policy emphasis on development inside the inner city for Brussels. Of course, we also recognize the lower potential, relatively-speaking, for inner-city development in Brussels given that density levels were already a lot higher than in Amsterdam.
6.2. Municipal governance structure
While there are variations in where development has been promoted in the two cities, the identified differences in greenspace changes between the two cities cannot sufficiently be explained by municipal policies. As apparent from , there are, in fact, many similarities between the cities in their stated policies. However, further examination of governance structure and the interviews undertaken with policymakers in each city revealed several key contextual factors that can help to explain observed differences in land-use trends.
A key difference lies in the centralized or decentralized nature of the municipal governance structure. Amsterdam has a more centralized structure responsible for the entire area within the municipal borders, whereas Brussels has a complex decentralized governance system involving a set of different hierarchical levels of governance (Boussauw, Allaert, and Witlox Citation2013; Poelmans and Van Rompaey Citation2009). The policymakers interviewed in Brussels stressed that institutional fragmentation is one of the main constraints toward implementing greenspace and urban development regulation. “The problem is that urban and greenspace development needs to be viewed on so many different institutional levels that plans many times get lost in bureaucratic processes” (RB1 2019). The Capital-Region of Brussels takes the lead in policies and plans for the whole city region which is, in turn, comprised of 19 separate municipalities. While plans are ostensibly developed at the regional level, these municipalities remain to some extent independent authorities with leeway in their implementation. This results in more abstract policies and plans, allowing the municipalities and private initiatives space to adapt plans to local needs. Overall, as referenced by the interviewees in Brussels, the numerous municipalities interpreting regional policies results in substantial incoherence and inconsistency in their implementation: “The policies do not provide any direction” (RB3 2019).
Until 2010, Amsterdam reflected some similarly decentralized institutional arrangements. The city was divided into 15 wards (stadsdelen) that had sufficient authority to administratively function as quasi-municipalities in some domains, with the Municipality of Amsterdam acting as a ‘higher authority’ for coordination of these wards. After 2010, mergers reduced the number of wards to 7 and more authority was concentrated at the municipal level. Interviewed policymakers in Amsterdam contended that centralizing the administration had a positive effect on the coherence of urban greenspace development. A concrete example of more coherence in UGS plans is the policy document ‘The Green Agenda’ (2015), which represented the first citywide greenspace plan. While the governance structure in Amsterdam was more centralized and coordinated throughout the research period than in the case of Brussels, the Amsterdam municipal reforms of 2010 strongly increased this.
In the case of Brussels, institutional fragmentation is not only present vertically, but also horizontally. Urban development and greenspace regulation are managed through separate departments, making integration of UGS plans and urban development projects more challenging. This is a key difference from Amsterdam where UGS and urban development are managed within the same department. While this presented a hurdle in the Brussels case for coordinated development, interviewed policymakers also pointed to improvements in the situation, as members of the department responsible for greenspace (Environment Brussels) have been, in recent years, more often included in plan-making processes carried out by the department responsible for urban development (Perspective Brussels).
Land ownership is another crucial factor that influences urban and greenspace development with ownership structure varying greatly between the two cases. In Amsterdam, the Municipality has direct ownership of 80% of the land within its borders. Due to this high land-ownership, it is easier for local authorities to guide and regulate development, including the creation of new greenspace on their properties. In contrast, policymakers in the Capital-Region of Brussels highlighted that the desire to develop new public greenspaces might be present but that the implementation is constrained by the need to buy the land for such projects.
Despite this difference, both cities indicate that it is not financially attractive to develop greenspaces in areas with high land values. In those areas, which often are more central places that also currently lack sufficient greenspace, it is frequently chosen to sacrifice greenspace for the development of apartment complexes and offices because of their profitability. At the same time, however, it is stressed that high densities allow the development of UGS through their generation of higher profits that make it financially possible to develop greenspace. This once again highlights the underlying tension between high-density urban development and greenspace creation or preservation.
In sum, looking at land-use developments and the policy and governance context of the two cases uncovers some key similarities and differences (see ). Both cities seem to have experienced a simultaneous loss of greenspace and increase in urban density. This means that, in principal, both cities seem to adhere to compact city development, although it is more embedded in planning policy in Amsterdam. A key difference between the cities seems to be in terms of the degree of institutional fragmentation, which, in the Brussels case, implies a less centralized and less effective planning of urban development. This, in turn, leads to more fragmented urban growth and the associated fragmentation of greenspace.
Table 8. Summary of differences and similarities between Amsterdam and Brussels.
7. Discussion and conclusion
The results of the analysis of Amsterdam and Brussels’ land-use changes coincide with assessments across global contexts showing that densification processes put pressure on UGS (Haaland and van den Bosch Citation2015). Our results support claims that densification can indeed affect the quantity, connectivity and average size of greenspaces (Kabisch et al. Citation2016; Tian, Jim, and Wang Citation2014; Zhang et al. Citation2017). In addition, exploring policy documents on spatial planning and interviews with key policymakers has provided insights on similarities and differences in policy and institutional contexts between the two cases and how these relate to the observed land-use changes over the period.
While the observed greenspace loss can frequently be traced back to concrete urban development plans, the trends and differences between the cities are difficult to relate to specific greenspace policies. Despite purported legal protections for greenspace, as well as initiatives to promote UGS and increase its connectivity, our land-use analysis revealed a clear decline in greenspace at the macro-level and increasing fragmentation across both cities. This seems to support claims that greenspace policies often lack the impact to compensate loss due to urban development (Artmann et al. Citation2019; Irga et al. Citation2017). Our analysis thus points to the apparent more dominant impact of development plans over greenspace initiatives. At the same time, differences in the governance structure and planning context appear be crucial. Several factors emerged from our study of the two contexts and interviews with key policymakers. Firstly, municipal land ownership, as dominant in Amsterdam, appears to play an important role in the potential for regulation, land-use guidance, and overcoming land-price barriers. Land ownership is highlighted as an important factor by Wang and Chan (Citation2019) in mitigating the cost burden of greenspace development in areas with high land-prices. Secondly, the more centralized governance structure in Amsterdam compared to Brussels may explain lower rates of greenspace loss, through more coordinated city-wide policy. Conversely, the decentralized structure in Brussels has been related to varied and potentially competing interpretations of regional greenspace policies among the numerous municipalities. Thirdly, relevant differences in horizontal institutional fragmentation was also apparent, with Amsterdam benefitting from UGS and urban development being managed within the same municipal department, compared to the separate agencies in Brussels. Such differences may impact the potential for early and integrated planning of greenspace in urban development, something which Khoshkar, Balfors, and Wärnbäck (Citation2018) underline is key in promoting UGS.
Looking at the geography of greenspace loss, the observed higher levels of urban development in the urban core for Amsterdam compared to more peripheral development in Brussels, is in line with the suburbanization tradition of Brussels and stronger compact city policies of Amsterdam. The higher rate of urban development outside the inner city in Brussels seems to affirm the notion that compact city policies indeed protect greenspace outside the city center (Westerink et al. Citation2013). Furthermore, this finding is also in line with the idea that urban sprawl is more likely to occur when planning is more decentralized (Colsaet, Laurans, and Levrel Citation2018; Patacchini and Zenou 2006). Our results support the assertion that urban planning cultures influence the extent and distribution of urban greenspace loss.
There are nonetheless limitations to the scope of the undertaken research. Firstly, differences in density could be further examined. Brussels was already denser with potentially less space left for development in the urban core. Secondly, this research lacked the ability to directly quantify increases in floor area. Thirdly, necessary choices on scale and boundary impact land-use measures. Within the urban core, Brussels shows higher degrees of compactness in terms of densities. On a regional scale, however, it also exhibits strong dynamics of urban sprawl and is a prime example in Europe of a sprawling and fragmented urban region (Poelmans and Van Rompaey Citation2009). Nonetheless, the attempt was to capture an analogous urban core and peripheral region across the two cases to minimize scale and boundary impacts. Finally, the study recognizes that an examination of additional dimensions such as quality and accessibility of greenspace are of further relevance. Indeed, quality of greenery impacts its usability and the extent of positive environmental effects (Zhang et al. Citation2017), whereas accessibility to greenspaces is key to understanding their specific mental and physical wellbeing potential for the local population (Ten Brink et al. Citation2016; Houlden et al. Citation2018).
Overall, the identified trends in loss of greenspace and the inability of green land-use policies to reconcile urban development pressures has substantial negative implications on the livability and sustainability of cities. Compact city development can contribute to sustainable urban development by lowering energy use, implementing more environmentally friendly transport and conserving greenspaces outside the urban boundaries. However, this study has shown that urban densification processes put increasing pressure on urban greenspaces, as they reduce the abundance and size of greenery in both cities. The additions of green space were insufficient to compensate for the loss of green space through new developments. A clear indication of this is the decrease of available green space per capita of 15.7% in Amsterdam and 26.5% in Brussels. Subsequently, greenspace becomes more fragmented. Especially in the face of ongoing climate change, urban greenspace plays a valuable role in mitigating the effects of more extreme weather events such as heat waves and heavy rainfall (Ten Brink et al. Citation2016; Yang and Lee Citation2021). The results echo those of Eichhorn, Rusche, and Weith (Citation2021), that the densification processes associated with compact city development often lead to conflicts with climate adaptation ambitions. Attentive and integrative policy measures seem necessary to overcome these conflicts. Moreover, greenspace plays crucial roles toward the local ecosystem, biodiversity and the mental and physical well-being of urban dwellers. Our study points to salient examples of greenspace loss within two contexts having stated policies to preserve and expand urban greenspace. We highlight here the difficulty in reconciling the competing pressures of urban growth and greenspace provision in urban contexts of scarce and competing land resources. Without strong planning principles that mandate the provision of green space, its loss is inevitable to densification processes (Khoshkar, Balfors, and Wärnbäck Citation2018). As the focus of urban planning practices still, and even increasingly, focus on densification (Rudolf, Kienast, and Hersperger Citation2018), finding strategies to balance growth with UGS provision are crucial. A macro-level assessment of land-use change, such as through remote sensing, is very effective to show the net effect of a wide range of policies that affect urban green space. Understanding this can stimulate coherent policy making between often fragmented municipal policies and departments.
Acknowledgements
We would like to thank the team of Green City Watch and Digital Globe for providing the satellite imagery and help in the development of the project.
Disclosure statement
No potential conflict of interest was reported by the author(s).
Notes
1 The term ‘Brusselization’ has been coined to refer to indiscriminate, ‘haphazard’ and often disconnected redevelopment of lower-density parcels into modernist high-rise buildings under regimes of minimal zoning regulation, as characteristic of Brussels, particularly in the 1960s and 70s but continuing to a certain extent in the decades since (see Wellburn Citation2016). Maps throughout this article were created using ArcGIS® software by Esri. ArcGIS® and ArcMap™ are the intellectual property of Esri and are used herein under license. Copyright © Esri.
References
- Abdullahi, S., B. Pradhan, and M. N. Jebur. 2015. “ GIS-Based Sustainable City Compactness Assessment Using Integration of MCDM, Bayes Theorem and RADAR Technology.” Geocarto International 30 (4): 365–387. doi:10.1080/10106049.2014.911967.
- Adelfio, M., J.-H. Kain, L. Thuvander, and J. Stenberg. 2018. “Disentangling the Compact City Drivers and Pressures: Barcelona as a Case Study.” Norsk Geografisk Tidsskrift - Norwegian Journal of Geography 72 (5): 287–304. doi:10.1080/00291951.2018.1547788.
- Artmann, M., M. Kohler, G. Meinel, J. Gan, and I. C. Ioja. 2019. “How Smart Growth and Green Infrastructure Can Mutually Support Each Other: A Conceptual Framework for Compact and Green Cities.” Ecological Indicators 96: 10–22. doi:10.1016/j.ecolind.2017.07.001.
- Boussauw, K., G. Allaert, and F. Witlox. 2013. “Colouring Inside What Lines? Interference of the Urban Growth Boundary and the Political–Administrative Border of Brussels.” European Planning Studies 21 (10): 1509–1527. doi:10.1080/09654313.2012.722952.
- Bowler, D. E., L. Buyung-Ali, T. M. Knight, and A. S. Pullin. 2010. “Urban Greening to Cool Towns and Cities: A Systematic Review of the Empirical Evidence.” Landscape and Urban Planning 97 (3): 147–155. doi:10.1016/j.landurbplan.2010.05.006.
- Burton, E. 2002. “Measuring Urban Compactness in UK Towns and Cities.” Environment and Planning B: Planning and Design 29 (2): 219–250. doi:10.1068/b2713.
- Byomkesh, T., N. Nakagoshi, and A. M. Dewan. 2012. “Urbanization and Green Space Dynamics in Greater Dhaka, Bangladesh.” Landscape and Ecological Engineering 8 (1): 45–58. doi:10.1007/s11355-010-0147-7.
- Colsaet, A., Y. Laurans, and H. Levrel. 2018. “What Drives Land Take and Urban Land Expansion? A Systematic Review.” Land Use Policy 79: 339–349. doi:10.1016/j.landusepol.2018.08.017.
- Dallimer, M., Z. Tang, P. R. Bibby, P. Brindley, K. J. Gaston, and Z. G. Davies. 2011. “Temporal Changes in Greenspace in a Highly Urbanized Region.” Biology Letters 7 (5): 763–766. doi:10.1098/rsbl.2011.0025.
- Davies, Z. G., J. L. Edmondson, A. Heinemeyer, J. R. Leake, and K. J. Gaston. 2011. “Mapping an Urban Ecosystem Service: Quantifying Above‐Ground Carbon Storage at a City-Wide Scale.” Journal of Applied Ecology 48 (5): 1125–1134. doi:10.1111/j.1365-2664.2011.02021.x.
- Delshammar, T. 2014. “Urban Greening Strategies for Compact Areas-Case Study of Malmö, Sweden.” Nordic Journal of Architectural Research 26 (2): 161–178.
- Digital Globe. 2003. Satellite Imagery. www.digitalglobe.com
- Digital Globe. 2016. Satellite Imagery. www.digitalglobe.com
- Digital Globe. 2019. Satellite Imagery. www.digitalglobe.com
- Eichhorn, S., K. Rusche, and T. Weith. 2021. “Integrative Governance Processes towards Sustainable Spatial Development: Solving Conflicts between Urban Infill Development and Climate Change Adaptation.” Journal of Environmental Planning and Management 64 (12): 2233–2225. doi:10.1080/09640568.2020.1866509.
- Esri. 2019. Municipal borders and background map. www.esri.com
- Gaigné, C., S. Riou, and J.-F. Thisse. 2012. “Are Compact Cities Environmentally Friendly.” Journal of Urban Economics 72 (2–3): 123–136. doi:10.1016/j.jue.2012.04.001.
- Gerber, J. D., and J. F. Gerber. 2017. “Decommodification as a Foundation for Ecological Economics.” Ecological Economics 131: 551–556. doi:10.1016/j.ecolecon.2016.08.030.
- Giezen, M., S. Balikci, and R. Arundel. 2018. “Using Remote Sensing to Analyse Net Land-Use Change from Conflicting Sustainability Policies: The Case of Amsterdam.” ISPRS International Journal of Geo-Information 7 (9): 381. doi:10.3390/ijgi7090381.
- Goddard, M. A., A. J. Dougill, and T. G. Benton. 2010. “Scaling Up from Gardens: Biodiversity Conservation in Urban Environments.” Trends in Ecology & Evolution 25 (2): 90–98. doi:10.1016/j.tree.2009.07.016.
- Gray, R., B. Gleeson, and M. Burke. 2010. “Urban Consolidation, Household Greenhouse Emissions and the Role of Planning.” Urban Policy and Research 28 (3): 335–346. doi:10.1080/08111146.2010.490618.
- Haaland, C., and C. K. van den Bosch. 2015. “Challenges and Strategies for Urban Green-Space Planning in Cities Undergoing Densification: A Review.” Urban Forestry & Urban Greening 14 (4): 760–771. doi:10.1016/j.ufug.2015.07.009.
- Hansen, R., A. S. Olafsson, A. P. van der Jagt, E. Rall, and S. Pauleit. 2019. “Planning Multifunctional Green Infrastructure for Compact Cities: What Is the State of Practice?” Ecological Indicators 96: 99–110. doi:10.1016/j.ecolind.2017.09.042.
- Houlden, V., S. Weich, J. Porto de Albuquerque, S. Jarvis, and K. Rees. 2018. “The Relationship between Greenspace and the Mental Wellbeing of Adults: A Systematic Review.” PLoS One 13 (9).
- Irga, P. J., J. T. Braun, A. N. J. Douglas, T. Pettit, S. Fujiwara, M. D. Burchett, and F. R. Torpy. 2017. “The Distribution of Green Walls and Green Roofs throughout Australia: Do Policy Instruments Influence the Frequency of Projects?” Urban Forestry & Urban Greening 24: 164–174. doi:10.1016/j.ufug.2017.03.026.
- Jim, C. Y., and M. W. Chan. 2016. “Urban Greenspace Delivery in Hong Kong: Spatial-Institutional Limitations and Solutions.” Urban Forestry & Urban Greening 18: 65–85. doi:10.1016/j.ufug.2016.03.015.
- Kabisch, N. 2015. “Ecosystem Service Implementation and Governance Challenges in Urban Green Space Planning: The Case of Berlin, Germany.” Land Use Policy 42: 557–567. doi:10.1016/j.landusepol.2014.09.005.
- Kabisch, N., and D. Haase. 2014. “Green Justice or Just Green? Provision of Urban Green Spaces in Berlin, Germany.” Landscape and Urban Planning 122: 129–139. doi:10.1016/j.landurbplan.2013.11.016.
- Kabisch, N., M. Strohbach, D. Haase, and J. Kronenberg. 2016. “Urban Green Space Availability in European Cities.” Ecological Indicators 70: 586–596. doi:10.1016/j.ecolind.2016.02.029.
- Karteris, M., I. Theodoridou, G. Mallinis, E. Tsiros, and A. Karteris. 2016. “Towards a Green Sustainable Strategy for Mediterranean Cities: Assessing the Benefits of Large-Scale Green Roofs Implementation in Thessaloniki, Northern Greece, Using Environmental Modelling, GIS and Very High Spatial Resolution Remote Sensing Data.” Renewable and Sustainable Energy Reviews 58: 510–525. doi:10.1016/j.rser.2015.11.098.
- Khoshkar, S., B. Balfors, and A. Wärnbäck. 2018. “Planning for Green Qualities in the Densification of Suburban Stockholm: Opportunities and Challenges.” Journal of Environmental Planning and Management 61 (14): 2613–2635. doi:10.1080/09640568.2017.1406342.
- Kremer, P., and Z. Hamstead. 2015. “Transformation of Urban Vacant Lots for the Common Good: An Introduction to the Special Issue.” Cities and the Environment (CATE) 8 (2): 1.
- Lin, B., J. Meyers, and G. Barnett. 2015. “Understanding the Potential Loss and Inequities of Green Space Distribution with Urban Densification.” Urban Forestry & Urban Greening 14 (4): 952–958. doi:10.1016/j.ufug.2015.09.003.
- Mahmoodzadeh, H. 2007. “Digital Change Detection Using Remotely Sensed Data for Monitoring Green Space Destruction in Tabriz.” International Journal of Environmental Research 1 (1): 35–41.
- McGarigal, K. 2015. Fragstats Help Document. University of Massachusetts, Amherst: Department of Environmental Conservation.
- Melia, S., G. Parkhurst, and H. Barton. 2011. “The Paradox of Intensification.” Transport Policy 18 (1): 46–52. doi:10.1016/j.tranpol.2010.05.007.
- Municipality of Amsterdam. 1996. Open Stad. Amsterdam, The Netherlands: Municipality of Amsterdam.
- Municipality of Amsterdam. 2011. Structuurvisie Amsterdam 2040: Economisch Sterk en Duurzaam. Amsterdam, The Netherlands: Municipality of Amsterdam.
- Municipality of Amsterdam. 2015. Agenda Groen. Amsterdam, The Netherlands: Municipality of Amsterdam.
- Municipality of Amsterdam. 2016. Koers 2025: Ruimte Voor de Stad. Amsterdam, The Netherlands: Municipality of Amsterdam.
- Municipality of Amsterdam. 2018a. Woningbouwplan 2018-2025. Amsterdam, The Netherlands: Municipality of Amsterdam.
- Municipality of Amsterdam. 2018b. Amsterdamse Referentienorm Voor Maatschappelijke Voorzieningen, Groen en Spelen. Amsterdam, The Netherlands: Municipality of Amsterdam.
- Neuman, M. 2005. “The Compact City Fallacy.” Journal of Planning Education and Research 25 (1): 11–26. doi:10.1177/0739456X04270466.
- Patino, J. E., and J. C. Duque. 2013. “A Review of Regional Science Applications of Satellite Remote Sensing in Urban Settings.” Computers, Environment and Urban Systems 37: 1–17. doi:10.1016/j.compenvurbsys.2012.06.003.
- Patacchini, E., and Y. Zenou. 2009. “Urban Sprawl in Europe.” Brookings-Wharton Papers on Urban Affairs 2009: 125–149.
- Pauleit, S., R. Ennos, and Y. Golding. 2005. “Modeling the Environmental Impacts of Urban Land Use and Land Cover Change: A Study in Merseyside, UK.” Landscape and Urban Planning 71 (2–4): 295–310. doi:10.1016/S0169-2046(04)00083-0.
- Poelmans, L., and A. Van Rompaey. 2009. “Detecting and Modelling Spatial Patterns of Urban Sprawl in Highly Fragmented Areas: A Case Study in the Flanders–Brussels Region.” Landscape and Urban Planning 93 (1): 10–19. doi:10.1016/j.landurbplan.2009.05.018.
- Qian, Y., W. Zhou, W. Yu, and S. T. Pickett. 2015. “Quantifying Spatiotemporal Pattern of Urban Greenspace: New Insights from High Resolution Data.” Landscape Ecology 30 (7): 1165–1173. doi:10.1007/s10980-015-0195-3.
- Rafiee, A., E. S. Dias, and E. Koomen. 2013. “Between Green and Grey: Towards a New Green Volume Indicator for Cities.” In Proceedings of the 13th International Conference on Computers in Urban Planning and Urban Management (CUPUM), edited by Stan Geertman, John Stillwell and Fred Toppen, 1–18. Utrecht: CUPUM.
- Region Brussels. 1993. Houdende Organisatie Van de Herwaardering Van de Wijken. Brussels: Region Brussels.
- Region Brussels. 1995. Gewestelijke Ontwikkelingsplan. Brussels: Region Brussels.
- Region Brussels. 2001. Het Gewestelijk Bestemmingsplan. Brussels: Region Brussels.
- Region Brussels. 2002. Gewestelijk Ontwikkelingsplan. Brussels: Region Brussels.
- Region Brussels. 2016. Gewestelijk Natuurplan 2016-2020 Voor Het Brusselse Gewest. Brussels: Region Brussels.
- Region Brussels. 2018. Gewestelijk Plan Voor Duurzame Ontwikkeling. Brussels: Region Brussels.
- Rudolf, S. C., F. Kienast, and A. M. Hersperger. 2018. “Planning for Compact Urban Forms: Local Growth-Management Approaches and Their Evolution over Time.” Journal of Environmental Planning and Management 61 (3): 474–492. doi:10.1080/09640568.2017.1318749.
- Russo, A., and G. T. Cirella. 2018. “Modern Compact Cities: How Much Greenery Do We Need.” International Journal of Environmental Research and Public Health. 15 (10). doi:10.3390/ijerph15102180.
- Salvati, L., and G. R. Lamonica. 2020. “Containing Urban Expansion: Densification vs Greenfield Development, Socio-Demographic Transformations and the Economic Crisis in a Southern European City, 2006–2015.” Ecological Indicators 110: 105923. doi:10.1016/j.ecolind.2019.105923.
- Statbel. 2016. Statistics Brussels. https://statbel.fgov.be/nl
- Statbel. 2018. Statistics Brussels. https://statbel.fgov.be/nl
- Statbel. 2003. Statistics Brussels. https://statbel.fgov.be/nl
- Tappert, S., T. Klöti, and M. Drilling. 2018. “Contested Urban Green Spaces in the Compact City: The (Re-) Negotiation of Urban Gardening in Swiss Cities.” Landscape and Urban Planning 170: 69–78. doi:10.1016/j.landurbplan.2017.08.016.
- Ten Brink P., K. Mutafoglu, J-P. Schweitzer, M. Kettunen, C. Twigger-Ross, J. Baker, Y. Kuipers, et al. 2016. The Health and Social Benefits of Nature and Biodiversity Protection: A Report for the European Commission (ENV.B.3/ETU/2014/0039). London/Brussels: Institute for European Environmental Policy.
- Tian, Y., C. Y. Jim, and H. Wang. 2014. “Assessing the Landscape and Ecological Quality of Urban Green Spaces in a Compact City.” Landscape and Urban Planning 121: 97–108. doi:10.1016/j.landurbplan.2013.10.001.
- UN (United Nations). 2015. The 2030 Agenda for Sustainable Development. New York: United Nations.
- Van Der Waals, J. 2000. “The Compact City and the Environment: A Review.” Tijdschrift Voor Economische en Sociale Geografie 91 (2): 111–121. doi:10.1111/1467-9663.00099.
- Wang, A., and E. Chan. 2019. “Institutional Factors Affecting Urban Green Space Provision–from a Local Government Revenue Perspective.” Journal of Environmental Planning and Management 62 (13): 2313–2329. doi:10.1080/09640568.2018.1541231.
- Wellburn, P. 2016. “Historical Dictionary of Brussels.” Reference Reviews 30 (4): 47–49. doi:10.1108/RR-02-2016-0058.
- Westerink, J., D. Haase, A. Bauer, J. Ravetz, F. Jarrige, and C. B. Aalbers. 2013. “Dealing with Sustainability Trade-Offs of the Compact City in Peri-Urban Planning across European City Regions.” European Planning Studies 21 (4): 473–497. doi:10.1080/09654313.2012.722927.
- Xu, C., D. Haase, and P. Pauleit. 2018. “The Impact of Different Urban Dynamics on Green Space Availability: A Multiple Scenario Modeling Approach for the Region of Munich, Germany.” Ecological Indicators 93: 1–12. doi:10.1016/j.ecolind.2018.04.058.
- Yang, B., and D. K. Lee. 2021. “Planning Strategy for the Reduction of Runoff Using Urban Green Space.” Sustainability 13 (4): 1–13.
- Zhang, Y., A. E. Van den Berg, T. Van Dijk, and G. Weitkamp. 2017. “Quality over Quantity: Contribution of Urban Green Space to Neighborhood Satisfaction.” International Journal of Environmental Research and Public Health 14 (5): 535. doi:10.3390/ijerph14050535.
- Zhou, W., J. Wang, Y. Qian, S. T. A. Pickett, W. Li, and L. Han. 2018. “The Rapid but "Invisible" Changes in Urban Greenspace: A Comparative Study of Nine Chinese Cities.” The Science of the Total Environment 627: 1572–1584. doi:10.1016/j.scitotenv.2018.01.335.
- Zhou, X., and Y. C. Wang. 2011. “Spatial-Temporal Dynamics of Urban Green Space in Response to Rapid Urbanization and Greening Policies.” Landscape and Urban Planning 100 (3): 268–277. doi:10.1016/j.landurbplan.2010.12.013.