
Abstract
This research brings together insights from the literature on the measurement of transaction costs related to agri-environmental schemes (AES) and formulates a conceptual framework for measuring these transaction costs. The framework is then applied to the Dutch AES in which farmer collectives act as a mediator between farmer-members and the Dutch government. In particular, we study the distribution of private transaction costs in the collective scheme and compare this to the distribution under the former individual approach. Results show that transaction costs have increased substantially for the collective, while they decreased for public actors. Moreover, the execution of the Dutch AES depends for a large part on volunteers, whose costs are not accounted for in official records. Although the Dutch AES appears successful in terms of coordination, we conclude that it carries substantial transaction costs for the collectives and its dependency on volunteers makes it fragile in the long term.
1. Introduction
Market failures result in the undersupply of environmental public goods in Europe (e.g. Kleijn et al. Citation2011; Mettepenningen, Beckmann, and Eggers Citation2011; Organisation for Economic Co-Operation and Development (OECD) Citation2013; Runhaar and Polman Citation2018). In rural areas, farmland has to provide sufficient environmental services to preserve diversity in plant and animal species (Cormont et al. Citation2016). Payments for environmental services emerged in the 1990s as an instrument for conservation, especially of tropical forests (Pesche et al. Citation2013). Adoption of such payments in agricultural policy was boosted by the FAO and the European Common Agricultural Policy (CAP), which both acknowledge the multifunctionality of agriculture and the role of farmers as providers of environmental services (Food and Agriculture Organisation (FAO) Citation2017). Environmental services in the context of agricultural production comprise the conservation and protection of natural habitats, biodiversity and rural landscapes through the use of sustainable agricultural practices (Muradian et al. Citation2010).
Agri-environmental schemes (AES) under Pillar II of the CAP are an example of payments for environmental services. AES entail contracts between individual farmers (as providers of environmental services) and the government (as the buyer of environmental services). More recently, AES also involve collective contracts between farmer groups and the public buyer (OECD Citation2013). In the Netherlands, the collective approach (Dutch: ANLb) was made obligatory in 2016 with the aim of reducing transaction costs and increasing spatial coordination (Terwan et al. Citation2016). Transaction costs are distinct from agricultural production costs (McCann et al. Citation2005; Mack et al. Citation2019). Production costs include the investment in equipment, foregone income and the labour spent making adjustments to the farming system (Beckmann Citation1996; Mettepenningen, Verspecht, and Van Huylenbroeck Citation2009; Coggan et al. Citation2015; Mack et al. Citation2019). Transaction costs include the costs that are made in the search, contract and post-contract phase of delivering a product or service (North Citation1992). In AES, for example, transaction costs are incurred by farmers when they apply to the scheme and by the public agency responsible for contracting and controlling the activities carried out by the farmers.
Collective AES may operate with lower transaction costs than individual schemes because of economies of scale and scope (Falconer Citation2000). Moreover, farmer groups, as beneficiaries of a collective contract, can cultivate shared norms and trust and thus reduce the need to monitor (i.e. lower transaction costs) (Ostrom Citation1990; Slangen et al. Citation2008). However, collective schemes may also lead to additional transaction costs, for instance, because of the complexity of coordination and the introduction of additional governance layers (OECD Citation2013). Furthermore, these costs may not be distributed evenly among private and public actors. Ignoring transaction costs will not only affect the cost-effectiveness of the schemes, but also their outcome (Jongeneel, Polman, and Slangen Citation2012). An evaluation of the cost-effectiveness of the European AES, and in particular the collective schemes, is needed to enhance their design and to allow comparisons with alternative ways of delivering environmental public goods (McCann et al. Citation2005; Pattanayak, Wunder, and Ferraro Citation2010; OECD Citation2013).
Transaction costs in the collective AES are borne by public and private actors, at national, regional and local level. An evaluation of the Dutch collective AES by Boonstra et al. (Citation2021) concludes that transaction costs have decreased for most public actors with the introduction of the collective scheme. Jongeneel and Polman (Citation2018) hypothesize that this may have coincided with a shift in transaction costs to private actors, especially to the farmer collectives that fulfil a key role in the collective AES. To assess this claim, our objective is to investigate the distribution of private transaction costs in the collective AES as well as the change in transaction costs in the collective vis-à-vis the individual approach. We use the case of AES as implemented by farmer collective Noardlike Fryske Wâlden (NFW), which has experience with both the collective and the individual AES approach.
Our contribution is twofold. First, we develop a conceptual model for measuring transaction costs for AES. Our focus will be on the transaction costs generated during the implementation of AES by the collective, while we take the development of the programme at the EU and at the Dutch national level as given (Wang Citation2003). We use insights from the literature on the measurement of transaction costs and from the theory of Transaction Cost Economics, as developed by Williamson (Citation1981, Citation1985, Citation1996, Citation1998) and extended by North (Citation1992) to study the transaction between buyers and sellers of environmental public goods and the relationship-specific arrangements typical of such transactions. In addition, we draw on insights from studies on payments for environmental services that measure transaction costs, for example Hearne and Easter (Citation1997) and Colby (Citation1990) on transaction costs in water markets and Kuperan et al. (Citation2008) in co-managed fisheries. Compared to previous studies, we provide a more comprehensive conceptual framework that includes transaction cost types for both public and private actors. Although the past two decades have seen an increase in studies on the effectiveness of and participation in AES, the ones that measure transaction costs usually address only specific categories of transaction costs. Exceptions are Falconer and Whitby (Citation1999, Citation2000), Falconer and Saunders (Citation2002), Mettepenningen, Verspecht, and Van Huylenbroeck (Citation2009) and Weber (Citation2014, Citation2015).
Second, we investigate whether the transaction costs incurred by private actors have changed due to the introduction of the collective AES. We therefore apply our conceptual model to the Dutch AES case. Measuring transaction costs is difficult because definitions are often not explicit and costs sometimes have to be constructed based on indirect observations (Mettepenningen and Van Huylenbroeck Citation2007). We follow the approach of other scholars and conduct interviews with government officers from the province and key informants from a farmer collective, and supplement this information with administrative records where possible (e.g. Falconer and Saunders Citation2002; McCann and Easter Citation2000; Mettepenningen, Verspecht, and Van Huylenbroeck Citation2009). Furthermore, we conduct interviews with farmers and a volunteer to estimate the private transaction costs related to their involvement in the scheme. Apart from the estimation of transaction costs, the interviews are also used to give an overview of the main implementing actors, their responsibilities and how they interact with each other in the collective scheme.
The paper is organized as follows. The next section develops the conceptual framework for transaction costs in AES. Section 3 introduces the Dutch case study, the study area and the methodology. Next, we discuss the application of the conceptual model to the case study. In the final Sections 5 and 6 we provide a discussion and conclusions.
2. Conceptual framework of transaction costs in AES
The aim of this section is to develop a clear concept of transaction costs associated with AES that can be operationalised in the empirical research. We will (1) define the transaction of relevance in AES; (2) establish broad categories of transaction costs (1st and 2nd level); (3) relate these broad categories to specific activities (3rd level); and (4) provide examples of indicators of transaction costs (4th level). provides an overview of the conceptual framework of transaction costs and the different levels of aggregation.
Table 1. Conceptualisation of transaction costs.
2.1. The transaction in AES
Since 1992, the AES has been a policy instrument under the second pillar of the CAP (European Commission (EC) Citation2005). It facilitates the transaction between a farmer or farmer group as the seller of agri-environmental services, and the government that acts on behalf of society as the buyer of the agri-environmental services (Mettepenningen, Beckmann, and Eggers Citation2011). The AES contract has a duration of six years and is entered voluntarily by the seller. The contract specifies yearly compensation to the seller for foregone income and costs due to carrying out the scheme’s environmental measures. The basis for the compensation depends on the scheme. Result-based schemes pay participants conditional on environmental results (i.e. on environmental indicators), whereas action-based schemes pay participants conditional on the contract measures executed. Because of this, an important part of any scheme is the monitoring of environmental results and/or of the seller’s activities. Monitoring occurs in the form of audits of farms and administrative checks. Finally, sanction mechanisms are agreed in the contract beforehand. For instance, if farmers are found not to comply, the payment can be reduced.
Implementation of the AES requires that member states have to comply with EU administrative regulations, such as providing correct spatial information and payment statements, to be eligible for the AES subsidy (Weber Citation2014). Hence, before the actual transaction can take place, member states need to go through a stage of setting up the AES system (Falconer and Whitby Citation2000; McCann et al. Citation2005; Vatn Citation2010). In this paper, we abstract from this initial stage and study the transaction that takes place between buyers and sellers once the AES is operational.
Actors who implement the AES involve multiple governance levels. The granting of the subsidy and reporting back to the EU is the task of the central and/or regional government. The government is also the controlling body, as this is required by the EU (Terwan et al. Citation2016). The seller is responsible for carrying out the scheme’s activities, which include monitoring and reporting to the government (Jongeneel and Polman Citation2018). Sellers can be assisted by a farmer organisation with administration. In addition, local private organisations such as environmental organisations are known to assist (OECD Citation2013; Westerink et al. Citation2017).
2.2. Level 1 and 2: broad definition of transaction costs
Transaction costs are defined by North (Citation1992), building on the work of Coase (Citation1960), as the costs of i) contact, finding partners and the product; ii) contract, negotiating an agreement; and iii) control, monitoring the effort of the contract partner (, 1st column). This broad categorisation helps in observing the different stages of the transaction. In the second column of , we differentiate the three phases of the transaction in the AES scheme into broad types of transaction costs. In the contact phase, producers and buyers face information costs: they learn about the policy programme and search for partners. For the buyer, or the agency that acts on behalf of the buyer, this also means finding participants. The sellers may develop a strategy and test out practices before contracting (Royer Citation2011). Mettepenningen, Verspecht, and Van Huylenbroeck (Citation2009) refer to the latter as the producer’s initial decision-making costs and argue that this includes the cost of making the wrong decision due to bounded rationality.
The contract phase involves costs that occur during negotiation sessions between the buyer and the seller; negotiation costs. Strategy development may also occur during the contract phase. This phase can be divided into further steps, depending on the type of institutional arrangement that is used for providing the good. If sellers exhibit bargaining power, they may negotiate about the contract terms with their buyer. In other cases, the public actor (the state), the buyer of the environmental service, draws up the contract terms and producers may “take it or leave it” (Royer Citation2011). In this case, we speak of application costs rather than negotiation costs. In the case of AES, the conditions from the government are stringent: although the participants can choose from various (packages of) measures, the specifics of the measures and the payment per measure are pre-determined.
The control phase consists of monitoring, enforcement of the contract and conflict resolution, or contract termination if conflicts are not resolved (Royer Citation2011). The need for effort in enforcing the contract terms results from the actors’ bounded rationality and their behaviour, such as mistakes that are being made or shirking. We define monitoring costs, adaptation costs, and enforcement costs as the broad types of transaction costs in this phase. Enforcement costs also include fees for premature termination of the contract. In addition, Peerlings and Polman (Citation2008) argue that when farmers want to exit the AES this requires switching costs, i.e. costs to make the necessary changes to the farming system for switching to other or former production systems. Although these are considered production costs, they imply that at the end of the AES programme cycle contract termination can be costly to the participants.
A relevant distinction to make is that between fixed and variable transaction costs. Variable transaction costs are the costs linked to scheme scale; for example, they depend on the amount of hectares entered (Falconer and Whitby Citation2000, 196). Fixed transaction costs are independent of the production of agri-environmental services (Falconer and Whitby Citation2000). They include, for example, yearly membership fees of the farmer collective and one-off investments. High fixed transaction costs can hamper a farmer’s participation in AES (e.g. Falconer Citation2000; Ducos and Dupraz Citation2007; Mettepenningen and Van Huylenbroeck Citation2007; Mettepenningen, Verspecht, and Van Huylenbroeck Citation2009; Royer Citation2011).
2.3. Level 3: differentiation of transaction costs for specific activities
Next, we list for each broad cost type the corresponding activities for the public and private actors in AES (3rd column in ). Most activities in the contact phase present fixed transaction costs. They are incurred before the farmer engages in the production of environmental services. The activities in the contract phase are related to application to the AES programme, negotiation and signing the contract. Although typically incorporated in the control phase, costs of conflict resolution may also occur during contracting, for instance, if buyer and seller do not agree on the outcome of the application. Costs of contracting are also fixed transaction costs. In the control phase, the activities are related to carrying out the contractual agreement. In this phase, the farmer’s costs for resources and time spent can be expressed as variable costs, for example, per ha contracted. The implementation of AES requires that the seller’s activities are monitored and that mechanisms are in place for sanctioning and conflict resolution. If sellers have been found non-compliant, sanctioning may take the form of discounts (malus) on their payment. In addition, actors have the opportunity in the control phase to adapt their strategy and/or the contract. Hence, activities are also included that relate to evaluation and strategy development.
2.4. Level 4: examples of indicators
Finally, we list examples of indicators of transaction costs that correspond to the activities in level 3 (4th column in ). The examples are not exhaustive. For instance, for the activity “Organising information meetings” the indicator reads “Costs related to information materials and postage,” but one could also measure the time spent by the actors on this activity as an alternative indicator.
There are two strands in the literature with respect to the measurement of transaction costs: indicators are formulated to measure either the size of transaction costs or the actors’ perception of the size. An example of the latter is from Mack et al. (Citation2019), who ask farmers about their “perceived administrative workload” using a three-point Likert scale. An example of the former is “the percentage of working time the individual respondents spend on an activity per year” (Mettepenningen, Beckmann, and Eggers Citation2011). Scholars commonly report the size of transaction costs relative to the total costs of a programme, as this is usually more informative than an absolute number. For a community forestry programme, Adhikari and Lovett (Citation2006) use both household surveys and secondary data to estimate “the number of transaction cost days spent in activities that recur yearly.” To understand the size of these transaction costs in the total costs, they convert the transaction cost days into monetary terms.
3. Application: the Dutch collective agri-environmental scheme
3.1. Introduction Dutch case
The basis for the collective approach in the Netherlands was formed by local agri-environmental co-operatives that already existed before the introduction of the collective AES (Franks Citation2011; Termeer et al. Citation2013). As a first step in the implementation of the collective AES, the agri-environmental cooperatives were merged into farmer collectives. At present, 40 farmer collectives are spread across the Netherlands and cover the whole territory of the twelve provinces. Farmers are not obligated to become a member, but do have to be a member if they want to participate in the collective AES. It is the task of the farmer collectives to select and contract with the participants. The collective scheme identifies four management areas: open grassland, wet infrastructure (and water), dry infrastructure, and open arable land. This division is based on achieving an optimal habitat for key species and only areas with the highest ecological potential were selected (Terwan et al. Citation2016). Farmers outside the designated areas cannot participate in the scheme.
The farmer collective Noardlike Fryske Wâlden (NFW) is one of the seven collectives in the northern province Friesland. Before 2016, NFW was already an experienced and professional agri-environmental cooperative (Termeer et al. Citation2013; Van der Windt and Swart Citation2018). With the introduction of the collective scheme, NFW merged with five other agri-environmental cooperatives in the province resulting in one collective with five departments and a general board. With this merger it acquired the certificate for carrying out the collective AES (Farmer collective 1, board member, October 29, 2020). Currently, its members consist of farmers, citizens and private land managers; 692 members participated in the AES in 2020 (). The collective is active in all four management areas of the Dutch AES (). It covers an area of 53,551 ha, of which the largest part is devoted to the dry infrastructure scheme (i.e. landscape management, maintaining landscape elements) and about 3,000 ha to the open grassland habitat (i.e. the meadow bird scheme). On a smaller scale, it is also involved in arable bird management (58 ha) and water management, including the maintenance of ditches (98 ha). The largest share of participants, 60%, is contracted for the dry infrastructure management area (). The meadow bird scheme, water and wet infrastructure, and arable bird management take up 29%, 9% and 1% of participants, respectively. Besides these, NFW carries out a diverse range of other activities, for example, private agri-environmental management, the maintenance of 1,600 ha of geese habitat, and pilots concerned with innovative farm management such as circular farming.
Figure 1. The Netherlands and NFW’s working area. Source: Author’s representation.
The marked area is NFW’s working area.
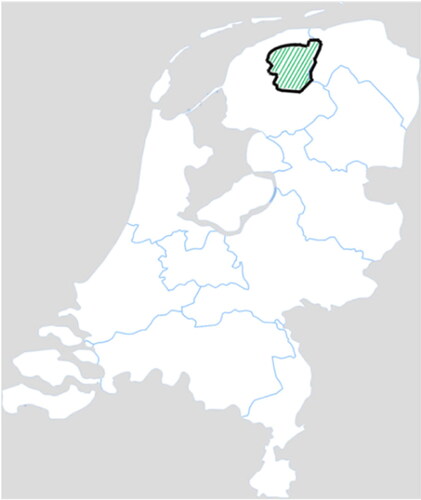
Table 2. Overview contracted participants and budget.
3.2. Method
We apply the conceptual framework developed in Section 2. We specifically address private transaction costs, to add insights to the evaluation by Boonstra et al. (Citation2021), which focused on public transaction costs. We analyse the scheme throughout its implementation period of six years but abstract from investigating the set-up process that includes interaction between EU, national and regional governments. An overview of the detailed steps of the transaction is necessary to ensure that all transaction costs are included (Kuperan et al. Citation2008). We therefore develop an inventory of the scheme’s stages and the associated activities involving both public and private actors (Hearne and Easter Citation1997).
A first source of information is the public executive organisation BIJ12, which supports the provincial government in the AES. It also supports the farmer collectives and provides information on its website.Footnote1 The website lists all the public and private stakeholders involved in the scheme and their corresponding responsibilities. This information was a first step in identifying the relevant stakeholders and the scheme’s timeline. Second, we conducted interviews to establish the scheme’s timeline and complete the list of activities carried out by each actor. Between October 2020 and March 2021, semi-structured interviews were conducted with the following anonymous stakeholders:
Two representatives of the Frisian province (where the collective NFW is located), one who was involved in the individual AES and one who is currently involved in the collective approach;
Two representatives from the Netherlands Enterprise Agency (RVO, the paying agency), one policy advisor who was involved in the design of the collective approach, and one who is currently involved in running the AES;
A former board member and director of the collective NFW;
Another key informant from the collective, the theme coordinator for meadow bird management;
Three dairy farmers who have a meadow bird scheme contract with the collective NFW;
A volunteer, so-called bird management director, connected to NFW.
Due to the COVID-19 crisis, travelling and meeting in person was restricted and therefore each stakeholder was asked for their preference for an online or offline interview. This resulted in two in-person interviews with farmers and one with the NFW board member, telephone interviews with one farmer and one representative of the province, and all other interviews being conducted online via Microsoft Teams. The interviews were recorded, when possible, but not transcribed and we did not perform a comprehensive content analysis. Appendix A (online supplementary material) provides an overview of the interviews.
Additionally, the interviews were used to collect data on the transaction costs of the collective, farmers and bird management directors. We considered the total transaction costs that the collective declares at the province, including the budgets for bird management directors. For more insight into these private transaction costs, we additionally questioned a bird management director. summarises how the transaction costs of the private actors were estimated. The measurement of transaction costs is not straightforward (Williamson Citation1996; Mettepenningen and Van Huylenbroeck Citation2007). Therefore, we proceeded as follows. First, we listed all the actors’ known activities according to broad cost types as found in the contact, contract and control stages. We then questioned the actors on the distribution of transaction costs according to their involvement in each of the stages. We posed questions such as “How much time is spent on this particular activity as a percentage of the total labour time in the scheme?”, and “How much more or less time is spent on this particular activity compared to the individual approach, in percentage terms?” (see Appendix B for the questionnaires that were used [online supplementary material]). Since the percentage of time was often difficult for respondents to recall, they were asked instead to estimate their labour hours for each activity. Nevertheless, it remained challenging, for farmers especially, to quantify the time spent on a particular activity. One farmer explained that he viewed his involvement in the scheme as part of his spare time and not in terms of labour hours. Therefore, some details on transaction cost types are missing for the bird management director and the farmers.
Table 3. Measuring private transaction costs hours.
Mettepenningen, Verspecht, and Van Huylenbroeck (Citation2009) point out that when actors have to recall costs, data can be less accurate. Cross-checking data with official records is one way to overcome biased estimates (Adhikari and Lovett Citation2006). For this reason, we complemented the information from the interviews with secondary data, if available. The bird management director provided a copy of his labour administration and we obtained data from NFW’s administrative records on budgets and labour hours. Furthermore, we used data on public transaction costs from Boonstra et al. (Citation2021) when possible.
Finally, to understand the distribution of the private transaction cost hours across the actors, we extrapolate our findings to all farmer-members and volunteers in the collective scheme as executed by the collective NFW, for which we make a few simple assumptions. We use the total number of participants (692), bird directors (16) and an estimated number of other volunteers (for each bird director 40 volunteers in total). We assume the volunteers put in the same hours as their bird management director when checking on the birds and talking to the farmers. We use the average transaction cost hours of the interviewed farmers for all other participants.
4. Results
4.1. The scheme’s lifecycle
This section explains how the Dutch collective scheme is implemented. We illustrate the Dutch collective approach and its main actors in . The collectives are the beneficiaries who are contracted by the provincial government, at “the front door” for a six-year subsidy period. The collectives submit a subsidy application to the province during the application period (the first application period was June-September 2015). The application shows which goals the collective wants to achieve at area level, how these contribute to the province’s nature conservation plan, and which financial resources are required for this (Province 1, policy officer, 13 October, 2020). The collectives align the application with their own area management plan for their assigned territory. Transaction costs are acknowledged as key costs in the collective scheme and may be charged to the province for up to 20% of the AES budget.
Figure 2. Schematic view of the Dutch collective approach. Source: Own representation based on Terwan et al. (Citation2016).
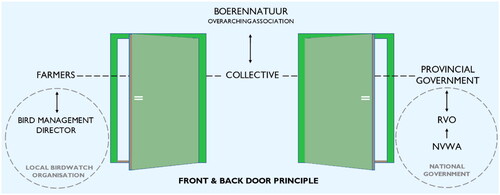
The national government is involved through its primary actor RVO, the paying agency. RVO is responsible for the administration and the reporting to the European Commission. The Netherlands Food and Consumer Product Safety Authority (NVWA), which is part of the Ministry of Agriculture, Nature and Food Safety, performs the field checks on behalf of RVO. At “the back door,” the collectives contract with the farmers who are responsible for carrying out the scheme. The fine-tuning of the measures happens between the farmers and the collective (Terwan et al. Citation2016). The collective AES is a typical example of Dutch collaboration: around 30-40 regional and local stakeholders are involved as partners of both the collective and the province, such as the Association of Frisian Birdwatchers, terrain management organizations, hunters and regional water boardsFootnote2 (Farmer collective 1, board member, 29 October 2020). In the field, the farmers are assisted by volunteers of local birdwatching organisations. Key volunteers are the bird management directors, who coordinate the measures in the field and instruct other volunteers. Finally, the national association BoerenNatuur was formed during the design of the collective AES. The association does not directly implement the AES but supports its members, the collectives, with activities related to knowledge sharing and development. Among others, it is responsible for developing and managing the ICT-tool that the collectives use to report to RVO on the measures carried out in the fields (Province 1, policy officer, 13 October 2020).
4.1.1. Timeline management year
The activities of the main public and private actors that incur transaction costs have been summarized in a timeline (see ). The management year runs from January to December and can be roughly divided into the three phases of contact, contract, and control. This cycle is repeated every year until the scheme ends after six years.Footnote3 With the opening of the AES, the search for participants and contracting between the collectives and participants has been partly dealt with. However, for each new management year the collectives have the opportunity to adapt their strategy. In this way, an annual transaction is repeated in which farmers make agreements with the collective and, in turn, the collective with the province.
Figure 3. Timeline of management year. Source: Authors’ own representation.
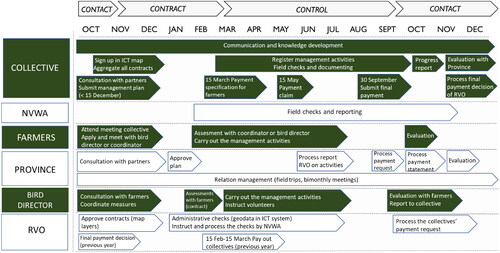
The start of the management year is preceded by a contact and contract phase, but some contact and contract costs continue throughout the year. In the meadow bird scheme, the contracting of additional participants is not uncommon during the management year, for example, because birds are mobile species. In addition, in the years after the start of the scheme, more budget became available so that additional farmers could be contracted (Farmer collective 2, theme co-ordinator, 24 February 2021). Each year in December, the collectives have to submit an area management plan to the province for the next management yearFootnote4 (Farmer collective 1, board member, 29 October 2020). This requires aggregating all the farmers’ contracts in a digital map and uploading this into the ICT tool to RVO. The collectives provide RVO with the aggregated contracts map three times a year; before the start of the management year, at the 15th of May for the payment claim (as required by the EU), and for confirmation at the end of September (RVO 2, policy advisor, 25 March 2021).
Most of the scheme’s activities are carried out during the control phase because the participants, the collectives as beneficiaries of the subsidy, and ultimately the Dutch government are accountable to the EU for carrying out the collective AES (Boonstra and Nieuwenhuizen Citation2019). During this period, the collectives have to register all field measures as carried out by the farmers in the ICT tool. The steps are the same for all four management areas, although specifically for the two bird schemes, the activities are checked during the breeding season (which starts February-March and continues until July). Throughout the year, RVO assesses the map data on the activities including the changes in activities. For this purpose, RVO relies heavily on ICT; error codes are automatically given and personnel judges whether the error is of concern (RVO 1, policy advisor, 27 October 2020). The main task of the NVWA throughout the management year is to give the collectives notice of their planned field checks and to document the results and send these to the collectives and to RVO. RVO checks the map data provided by the collectives and prepares the payment statement. The payment statement may include penalties because of non-compliance. After the collectives receive the payment from RVO (the latest on March 15th the following year) they pay out to the participants.
Besides the checks by NVWA, each collective has a control and assessment protocol to check their members. The collective uses the monitoring data to write a progress report for the evaluation talk with the province, which takes place in November. This evaluation focuses on both the ecological monitoring and management, including any sanctions and adjustments made. The collective’s management plan serves as a benchmark for the evaluation (Province 1, policy officer, 13 October 2020). Annually, in October, the farmers evaluate the management year one-on-one with the bird management directors or other coordinators, with the opportunity to renew and adjust contracts (on the basis of the established list of measures). With these evaluations the timeline has reached the contact phase again, and the actors begin preparations for the next management year.
4.2. Transaction costs for the province, RVO and NVWA
4.2.1. Province
Before the collective approach, the province had individual negotiations with farmers to figure out where agri-environmental management practices should be carried out. Under the collective approach, this has become the task of the collective and the province’s main task has become to facilitate the process, through rules, checks and adjustments, and to assign the subsidies. The province therefore steers the collectives in broad terms only (Province 1, policy officer, 13 October 2020). Other tasks of the province are “policy monitoring” and “learning how to manage,” namely, to help the collectives become more professional. This is an important but complex task because the current collectives have been established through mergers of existing agri-environmental co-operatives, which poses a challenge of organisation (Province 2, policy officer, 23 February 2021).
Moreover, the registration of parcels in the ICT tool is not yet fully functional and the province has to deal with the complaints about these errors. The government officer from the Frisian province mentioned that building a trust relationship was necessary and it took some time and effort at the start of the scheme. Currently, the government officer spends on average 25% of the time on facilitating and 75% on relationship management with the collectives. However, he explained that NFW has a good network with its farmers, and for this reason, the managerial aspects with NFW take less time in comparison to the other Frisian collectives. Moreover, its farmers are familiar with the scheme’s measures (Province 1, policy officer, 13 October 2020).
The Frisian province has seen its transaction costs decrease with the introduction of the collective scheme, because it went from 1,500 to 7 beneficiaries to be contracted. When in the individual scheme approximately 40 cents of every euro spent on the scheme could be attributed to bureaucracy, this has now decreased to 15 cents (Province 1, policy officer, 13 October 2020). According to the two government officers interviewed, it is also evident that the collectives are spending more time on the scheme.
4.2.2. RVO
Due to the shift from the individual to the collective approach, RVO’s transaction costs decreased from 15.1 million euro in 2015 to 7.0 million euro in 2019 (Boonstra et al. Citation2021). The obvious reason is that instead of 10,000 contracts, RVO has to oversee only 40 contracts. Other reasons are: 1) each collective has become a manager of a designated area, making communication easier 2) fewer errors are made, because RVO’s ICT system is designed in such a way that registering measures invokes fewer faults and individual farmers are not entering data themselves but are assisted by the collective (RVO 1, policy advisor, 27 October 2020).
4.2.3. NVWA
According to EU regulations, the NVWA has to perform checks on a sample of 5% of the AES contracts. While in the past a representative sample could be drawn from a large pool of individually contracted farmers, this is not doable for the group of 40 collectives. Instead, the checks are carried out by drawing a sample from the registered AES activities (RVO 1, policy advisor, 27 October 2020). Consequently, the checks for NVWA have increased. Moreover, the ability to adapt measures during the season has increased the number of checks. NVWA’s transaction costs have therefore increased from 2.0 to 3.1 million euro (Boonstra et al. Citation2021). Yet, Boonstra et al. (Citation2021) report that, in total, public transaction costs decreased from 42% to 19% of the total AES budget.
4.3. Transaction costs for the collective, farmers and volunteers
4.3.1. Farmer collective NFW
Before the collective, NFW became a certified farmer collective, it was an association for agri-environmental management in the North-East of the province Friesland. While before 2016 its role was mainly to assist land managers with AES and other environmental regulations, after 2016 the collective fully executes the AES. This involves many new tasks: (1) applying to the scheme, (2) contracting with the participants, which includes using the ICT tool, (3) coordinating participants’ activities, (4) monitoring, (5) controlling, preparing checks, and instructing its own inspection committee, as well as facilitating and responding to the checks by NVWA, and (6) paying the participants, which includes a one-on-one check with the administration of RVO and addressing participants’ objections (Farmer collective 1, board member, 29 October 2020). At the start in 2016, the NFW coordinated the collective AES for three management areas (open grassland, dry infrastructure, wet infrastructure), but since 2018 it expanded its activities to include arable land, mainly for arable bird management (Farmer collective 2, theme coordinator, 24 February 2021). Given NFW’s new responsibilities and expansion of tasks, it created a financial department for the collective AES, and four “theme groups,” reflecting the four management areas within the scheme, each with their own coordinator.
shows the breakdown in transaction costs of the collective NFW in the final year of the individual AES approach (2015), the first year of the collective approach (2016), and the most recent year for which data were available (2020). Two main conclusions can be drawn based on these numbers.
Table 4. Distribution of NFW’s transaction cost hours.
First, the introduction of the collective approach has led to higher transaction costs overall for the collective. shows that the collective’s total transaction costs have increased since the start of the collective approach from 3,657 to 8,473 h. Since NFW’s administration differed before the collective approach, we could not trace back all the data to the transaction cost types and thus cannot compare these types before and after the collective scheme. We can, however, state that (1) enforcement costs increased almost tenfold and (2) collaboration increased between the collective and partners; with policy makers and other actors, at policy level, and with implementing partners, at field level (Farmer collective 1, board member, 29 October 2020).
Second, transaction costs have decreased slightly since the first year of the implementation of the collective approach. Overall transaction costs decreased by 8% between 2016 and 2020. This can be explained by the learning costs of becoming acquainted with the new scheme’s conditions. For example, decision-making costs decreased by 43% and application costs by 26%. In fact, all interviewees acknowledged that at the start of the scheme its implementation took more time, as the actors had to understand the new way of working and their role within the scheme. Nevertheless, some costs have increased compared to the first year. These are the costs spent on knowledge development and communication, adaptation and enforcement. This can be explained by increased adaptation of measures (due to weather conditions, for example) and an increase in the number of participants, which, in turn, requires more administration and checks. Since the start of the scheme, the number of participants has increased from 562 in 2016 to 692 in 2020 (), because more subsidies were provided. This has led to more contiguous areas under management (for a map see Appendix C [online supplementary material]).
It should also be noted that transaction costs can differ substantially between management areas. NWF’s administration reveals that the average transaction costs were 17.7% and 16.4% of the total AES subsidy received in 2016 and 2020, respectively. It is estimated that for the bird schemes the collective manages to stay below the 15% target line, but for the other management areas costs go up to 20%. This difference can be particularly attributed to the application costs for the different schemes, which include registering the natural elements on the digital map of the RVO. This takes more time and is more prone to cause errors for the management of the wet and dry infrastructure. In contrast, whole plots are registered for the bird schemes, which is easier and faster. The board member concludes: “So if you compare that, the landscape management [ref. wet and dry infrastructure], the costs of landscape management overhead are maybe a third higher than for the bird management.” The board member emphasised that collectives that execute the dry infrastructure only, have 20% of the total subsidy amount spent on transaction costs, while those that participate in bird management only need between 11-12% of the subsidy to cover transaction costs (Farmer collective 1, board member, 29 October 2020).
4.3.2. Farmers
The estimated time spent by farmers on the scheme is 1-10% of their annual labour time. The farmers were positive about the collective, because it supports them by doing most of the work, such as the application, monitoring, providing information and sorting out issues with the government controllers. They also stipulate the role of the volunteers, especially the bird management directors. One farmer explained that two volunteers come at least twice a week during the bird season and that he would never have the ecological results that he has without them.
The farmers mentioned no change in transaction costs, or the time they spend, related to the scheme’s activities since the introduction of the collective approach, except for a bit more time needed at its start. A farmer commented: “It has more to do with emotion, because in one season you are busier [with the dairy farm] than in another” (Farmer 1, dairy farmer, 29 October, 2020). The farmers also stipulated that it is their choice to put in a few extra hours, like coming along with the NVWA controllers. In addition, one farmer reimburses the fuel costs of his two volunteers and he is engaged in a theme group for which he attends quarterly meetings. These activities are, however, not mandatory in the scheme. The farmers emphasise that the packages of measures they can choose from have increased, “the choice is broad” (Farmer 3, dairy farmer, 29 December 2020). These changes due to the collective approach are ascribed to a targeted use of the budget for management and are viewed as positive by the farmer-members. The farmers do foresee a risk in getting a contract for the new 6-year scheme period, in the sense that it is uncertain because of possible changes in local policy plans and in the CAP.
4.3.3. Volunteers and bird management directors
The meadow bird scheme seems largely dependent on volunteers devoted to meadow bird management. Interviews with one of NFW’s theme coordinators and one bird management director confirmed this hypothesis. This creates a major concern because these volunteers are becoming older and scarcer. The key contact points for both the farmers and the collective are the bird management directors, in 2021 sixteen in total. These citizens are intrinsically motivated to contribute to the scheme and it is known by the collective that they invoice only a fraction of their true working hours and travel costs (Farmer collective 2, theme coordinator, 24 February 2021).
The bird management director who was interviewed is responsible for an area of about 350 ha where two Frisian collectives reside, one being NFW. According to the administration, the bird management director puts on average 306 h per year into meadow bird management. About half of this time is spent in communication with farmers, the collective and other stakeholders and the other half is spent in the field. About one sixth of his labour hours is related to activities for the collective NFW, such as visiting the members and having one-on-one reviews, but only 15% of the (time and travel) costs are declared to the collective. The rest of the 306 h is spent for the local birdwatching organisation – from which the collective also benefits. Moreover, the bird management director coordinates 40 volunteers from the local birdwatching organisation (Volunteer, bird management director, 15 January 2020). If we assume these volunteers put in the same hours as their bird management director, a calculation of the voluntary hours (excluding fuel costs) on NFW’s meadow bird management area amounts to 16*41*306 = 200,736 h annually. These hours are not shown in the official administration for the collective.
The bird management director has volunteered with the collective since 2013. Therefore, he was a reliable source to discuss the changes since the implementation of the collective scheme. Since the collective scheme, 80% of the bird management director’s activities have remained the same. New tasks are one-to-one talks with farmers on contracting in February, early on in the scheme’s yearly cycle, and more intense evaluations with farmers for the collective around October. The bird management director also recruits farmers, makes agreements with them based on trust, and instructs them during the meadow bird season on the measures. However, the bird management director’s coordination costs have increased only by a couple of hours (<5%) because the collective scheme has not influenced his way of coordinating, apart from being given the choice between more measures and the ability to adapt when needed. The director cited this as a cause for increased interaction time with farmers, but stipulated that another cause for more time input is the fact that volunteers are becoming scarcer.
4.3.4. Comparison of private transaction cost hours
Next, we compare the distribution of hours between the private actors. When we add all hours of the collective, farmers and volunteers together, we get a total of 8,743 + 27,680 + 200,736 = 236,889 transaction cost hours per year. Although this is a rough estimation, it clearly displays the relative shares of the private actors (). The hours spent by volunteers make up by far the bulk of the transaction costs in the scheme.Footnote5 These hours remain to a large extent undeclared, but it shows how much the Dutch collective scheme depends on the devotion of volunteers and that its real costs are higher than the budgets display.
Table 5. Comparison hours study case NFW in 2020.
4.3.5. Shift from public to private
Finally, we want to check whether total transaction costs have changed due to the collective scheme. Boonstra et al. (Citation2021) estimated that all public transaction costs together reduced from 42% to about 19% of the subsidy, which is an underestimate, as not all transaction costs could be retrieved. When we add up our estimate of the collective’s transaction costs of 16-17% and that of the public’s transaction costs, the total is close to the 42% from the previous approach. Boonstra et al. (Citation2021) therefore report that a shift of public transaction costs to the collectives is apparent, but that it cannot be concluded that total transaction costs have been reduced in the collective approach.
5. Discussion
In this paper we set out to measure the private transaction costs in the Dutch collective AES. The main private actors responsible for implementing the scheme are the farmer collectives, bird management directors and other citizens volunteering, and the farmers contracted by the collectives. We focused on one scheme, as implemented by the farmer collective Noardlike Fryske Wâlden (NFW) since 2016. Due to its new role, the collective NFW has seen an increase in its tasks, resulting in an increase in transaction costs. We find that private transaction costs remained about the same for the bird management director and farmers, but more than doubled for the collective NFW. Furthermore, the farmer collective’s transaction costs decreased by 8% from 2016 to 2020. This points to a learning effect that was acknowledged by all actors interviewed. NFW’s transaction costs are around 16% of its AES budget, although the exact level depends on the management area. This difference between management areas can be explained by the difference in application costs. Working in the digital map (in the ICT system) takes more time and is more prone to cause errors for the management of the wet and dry infrastructure schemes, leading to a share of 20% of the AES budget, while transaction costs only account for 15% or less of the budget for the bird schemes.
Our findings show that the bird management directors devote much time coordinating the measures, adapting and checking the whereabouts of the birds. When we extrapolate our findings to all farmers and volunteers in the scheme as executed by NFW, it becomes clear that the transaction cost hours spent by volunteers make up by far the bulk of the private transaction costs in the scheme. The local birdwatching organisations and other voluntary organisations are thus important partners of the collectives and farmers in the Dutch collective scheme. However, labour and travel costs are mostly undeclared by the bird management directors, and completely undeclared by the other volunteers. Therefore, we can speak of “hidden” transaction costs in the Dutch collective scheme. At least for the bird schemes, it holds that their real costs are higher than the budgets display.
The execution of the Dutch collective scheme relies on the collaboration of multiple local and regional stakeholders, among which the farmer collectives take a key position. Its successful execution therefore depends on the professionalisation of the collectives (Dik et al. Citation2021). It is expected that not all farmer collectives have the ambition and capacity to continue and will stop their activities or merge with others for the next AES subsidy period (Farmer collective 1, board member, 13 May 2022). In principal, collective AES contracts can solve contractual issues related to individual contracts and, therefore, lower the transaction costs associated with agri-environmental service delivery (Slangen et al. Citation2008; Franks Citation2011). Thus, having professional farmer collectives could, in the long term, reduce private transaction costs associated with the Dutch collective scheme. However, in the current set-up with 50% financial support from the CAP this reduction is limited, since government controls on the prescribed management activities are still required, meaning farmers are checked both by their collective and the government. This leads to double work for the collective and does not promote trust among the actors. Entrusting the collective entirely with the task of controlling, instead of NVWA, could enhance the Dutch “front and backdoor” approach to the collective AES (Farmer collective 1, board member, 29 October 2020). This, however, requires a major change at the CAP level.
We place some critical notes on our method. First, we were constrained by the administrative data to which we had access and therefore the transaction costs we considered consisted of labour hours (time spent) and travel costs (which were also converted to labour hours). We thus equated farmers’ opportunity costs for time to labour hours. We refrained from measuring transaction costs in more detailed ways, such as costs of materials, electricity bills, phone bills, computer costs, etc. Besides, since farmers are reimbursed by the collective for materials, such costs are already included in the collective’s transaction costs (the average 16% share of the AES budget referred to above). Second, the number of interviews we conducted with private actors was restricted due to the COVID-19 pandemic. We interviewed three of NFW’s farmer-members, who were heterogeneous farmers, and took the average of their transaction cost hours. In addition, we took the transaction costs of one bird management director and extrapolated these to the other fifteen directors and other volunteers. Yet, we think that the farmers’ and director’s longstanding association with NFW and experience with local agri-environmental management, provides us with a minimum number for the actual transaction costs incurred by most private actors in the Dutch collective AES. Third, one of our aims was to compare the transaction costs of the private actors before and after the introduction of the collective AES, in which we only partly succeeded. Since the collective’s administration differed before the collective approach, we could only compare the total transaction cost hours. We expect that, having a close look at the sub-categories in NFW’s administration, most transaction cost types have increased substantially, but since we could not determine the exact numbers, we chose not to display them. Finally, farmer collective NFW already assisted their members with agri-environmental management before the collective approach, which explains why the farmers we interviewed barely noticed any changes in transaction costs. Had we interviewed farmers linked to other collectives, we may have heard a different story and found a change in farmers’ transaction costs. This suspicion was confirmed by our key informant from NFW. Thus, the result we get that farmers’ transaction costs have not changed, is an outcome of this particular case study.
6. Conclusions
Our findings support the hypothesis that part of the public transaction costs of the Dutch AES have shifted to the farmer collectives. Although we have examined only one case of a farmer collective that implements the scheme, we expect similar findings among the other collectives. We have several reasons for this: (1) the activities of the collectives have increased as beneficiaries of the AES subsidy, (2) the involvement of volunteers is also high at other farmer collectives, and (3) the NFW is one of the most professional and experienced agri-environmental associations in the Netherlands, which likely gives a lower bound of transaction costs related to the scheme’s implementation.
Given the multifunctionality of agriculture and the role of farmers as providers of environmental services, it is important to research and discuss the ways in which these environmental services can be delivered. The EU AES as part of the CAP, combined with the notion of collective action, is one example of a policy instrument targeting this objective. Although the Dutch scheme may appear successful in terms of coordination, we conclude that it carries huge private transaction costs. It also depends greatly on volunteers, which makes it fragile in the long term as an instrument for providing public environmental goods.
Because of its historical embeddedness and the high involvement of volunteers (the development of agri-environmental cooperatives started in the Netherlands in the early 1990s), the Dutch collective scheme may be difficult to replicate in other European contexts. Policy makers are advised to first study local conditions, such as existing social networks and organisational structures, to assess the feasibility of collectively providing agri-environmental services via farmer collectives. In addition, the investment in setting up the scheme, which includes the development of ICT infrastructure, needs consideration. We want to highlight that this study focused on transaction costs, but a comprehensive evaluation – of any environmental policy – should consider the balance of the costs and environmental effect. Therefore, future research on the Dutch AES should appreciate the costs (including transaction costs) in relation to its environmental impact.
Supplemental Material
Download MS Word (1.1 MB)Acknowledgements
We thank the staff members of Noardlike Fryske Wâlden for their collaboration and the provision of data and relevant contacts. In particular, we thank the two key informants from the collective for sharing their knowledge. Any mistakes or inconsistencies still remaining are the authors’ responsibility.
Disclosure statement
No potential conflict of interest was reported by the authors.
Supplemental data
Supplemental data for this article can be accessed here.
Additional information
Funding
Notes
2 A water board is a government agency with the task to regulate water management in a specific Dutch region.
3 Since the new CAP started as of 2023, the original period of six years has been extended. See
https://ec.europa.eu/info/food-farming-fisheries/key-policies/common-agricultural-policy_en.
4 Note that this plan is different from the subsidy application, which is submitted only once for a 6-year cycle.
5 In the previous individual approach, volunteers’ transaction costs were also present, but they have never been measured. Because of the required checks through the collective’s inspection committees, volunteers are becoming even more important in the collective approach (since mostly volunteers are used for this). These checks have to be carried out for every management area, so they are not specific to bird management.
References
- Adhikari, B., and J. C. Lovett. 2006. “Transaction Costs and Community-Based Natural Resource Management in Nepal.” Journal of Environmental Management 78 (1): 5–15. doi:10.1016/j.jenvman.2005.04.005.
- Beckmann, V. 1996. “Transaction Costs and Institutional Choice in Agriculture: The Example of Family vs. Hired Labour.” Paper Presented at the VIIIth EAAE Congress, Edinburgh, Scotland, September 3–7.
- Boonstra, F. G., and G. Nieuwenhuizen. 2019. Voortgangsrapportage Agrarisch Natuur en Landschapsbeheer [Progress Report Agri-Environmental Management]. Wageningen: Wageningen Environmental Research. https://edepot.wur.nl/478233.
- Boonstra, F. G., G. Nieuwenhuizen, T. Visser, T. Mattijssen, F. F. Van der Zee, R. A. Smidt, and N. Polman. 2021. Stelselvernieuwing in Uitvoering. Tussenevaluatie Van Het Agrarisch Natuur- en Landschapsbeheer [System Renewal in Progess. Midterm Evaluation of Agri-Environmental Management]. Wageningen: Wageningen Environmental Research. https://www.wur.nl/nl/Publicatie-details.htm?publicationId=publication-way-353831303935.
- Coase, R. H. 1960. “The Problem of Social Cost.” The Journal of Law and Economics 3: 1–44. https://www.jstor.org/stable/724810.
- Coggan, A., M. Van Grieken, A. Boullier, and X. Jardi. 2015. “Private Transaction Costs of Participation in Water Quality Improvements Programs for Australia’s Great Barrier Reef: Extent, Causes and Policy Implications.” Australian Journal of Agricultural and Resource Economics 59 (4): 499–517. doi:10.1111/1467-8489.12077.
- Colby, B. G. 1990. “Transactions Costs and Efficiency in Western Water Allocation.” American Journal of Agricultural Economics 72 (5): 1184–1192. doi:10.2307/1242530.
- Cormont, A., H. Siepel, J. Clement, T. C. P. Melman, M. F. Wallis de Vries, C. A. M. Van Turnhout, L. B. Sparrius, et al. 2016. “Landscape Complexity and Farmland Biodiversity: Evaluating the CAP Target on Natural Elements.” Journal for Nature Conservation 30: 19–26. doi:10.1016/j.jnc.2015.12.006.
- Dik, L., H. A. C. Runhaar, and C. J. A. M. Termeer. 2021. “Farmer Collectives for More Effective Agri-environmental Schemes? An Assessment Framework Based on the Concept of ‘Professionalization’.” International Journal of Agricultural Sustainability 20 (4): 543–557. doi:10.1080/14735903.2021.1950389.
- Ducos, G., and P. Dupraz. 2007. “The Asset Specificity Issue in the Private Provision of Environmental Services: Evidence from Agri-Environmental Contracts.” Working Paper 07-02. Rennes: Institut National de la recherche Agronomique. hal-02816519.
- European Commission (EC). 2005. Agri-Environment Measures: Overview on General Principles, Types of Measures, and Application. Brussels: EC, Directorate General for Agriculture and Rural Development, Unit G-4.
- Falconer, K. 2000. “Farm-Level Constraints on Agri-Environmental Scheme Participation: A Transactional Perspective.” Journal of Rural Studies 16 (3): 379–394. doi:10.1016/S0743-0167(99)00066-2.
- Falconer, K., and M. Whitby. 1999. “The Invisible Costs of Scheme Implementation.” In Countryside Stewardship: Farmers, Policies and Markets, edited by G. Van Huylenbroeck and M. Whitby, 67–88. Amsterdam: Pergamon.
- Falconer, K., and M. Whitby. 2000. “Untangling Red Tape: Scheme Administration and the Invisible Costs of European Agri-Environmental Policy.” European Environment 10 (4): 193–203. doi:10.1002/1099-0976(200007/08)10:4 < 193::AID-EET231 > 3.0.CO;2-D.
- Falconer, K., and S. Saunders. 2002. “Transaction Costs for SSSIs and Policy Design.” Land Use Policy 19 (2): 157–166. doi:10.1016/S0264-8377(02)00007-8.
- Falconer, K., P. Dupraz, and M. Whitby. 2008. “An Investigation of Policy Administrative Costs Using Panel Data for the English Environmentally Sensitive Areas.” Journal of Agricultural Economics 52 (1): 83–103. doi:10.1111/j.1477-9552.2001.tb00911.x.
- Food and Agriculture Organisation (FAO). 2017. The State of Food and Agriculture 2017. Rome: FAO. http://uni-sz.bg/truni11/wp-content/uploads/biblioteka/file/TUNI10042440(1).pdf
- Franks, J. R. 2011. “The Collective Provision of Environmental Goods: A Discussion of Contractual Issues.” Journal of Environmental Planning and Management 54 (5): 637–660. doi:10.1080/09640568.2010.526380.
- Hearne, R. R., and K. W. Easter. 1997. “The Economic and Financial Gains from Water Markets in Chile.” Agricultural Economics 15 (3): 187–199. doi:10.1111/j.1574-0862.1997.tb00431.x.
- Hobbs, J. E. 1997. “Measuring the Importance of Transaction Costs in Cattle Marketing.” American Journal of Agricultural Economics 79 (4): 1083–1095. doi:10.2307/1244266.
- Jongeneel, R., and N. Polman. 2018. “Farmer Groups as a Device to Ensure the Provision of Agri-Environmental Services in The Netherlands: A Procurement Perspective.” Paper Presented at the 92nd Agricultural Economics Society Annual Conference, Warwick, April 16–18. https://library.wur.nl/WebQuery/wurpubs/543615.
- Jongeneel, R., N. Polman, and L. Slangen. 2012. “Cost-Benefit Analysis of the Dutch Nature Policy: Transaction Costs and Land Market Impacts.” Land Use Policy 29 (4): 827–836. doi:10.1016/j.landusepol.2011.12.010.
- Kleijn, D., M. Rundlo, J. Scheper, H. G. Smith, and T. Tscharntke. 2011. “Does Conservation on Farmland Contribute to Halting the Biodiversity Decline?” Trends in Ecology &. Evolution 26 (9): 474–481. doi:10.1016/j.tree.2011.05.009.
- Kuperan, K., N. M. R. Abdullah, R. S. Pomeroy, E. L. Genio, and A. M. Salamanca. 2008. “Measuring Transaction Costs of Fisheries Co-Management.” Coastal Management 36 (3): 225–240. doi:10.1080/08920750701681991.
- Mack, G., A. Kohler, K. Heitkämper, and N. El-Benni. 2019. “Determinants of the Perceived Administrative Transaction Costs Caused by the Uptake of an Agri-Environmental Program.” Journal of Environmental Planning and Management 62 (10): 1802–1819. doi:10.1080/09640568.2018.1515311.
- McCann, L., and K. W. Easter. 1999. “Transaction Costs of Policies to Reduce Agricultural Phosphorous Pollution in the Minnesota River.” Land Economics 75 (3): 402–414. doi:10.2307/3147186.
- McCann, L., and K. W. Easter. 2000. “Estimates of Public Sector Transaction Costs in NRCS Programs.” Journal of Agricultural and Applied Economics 32 (3): 555–563. doi:10.1017/S1074070800020642.
- McCann, L., and R. Claassen. 2016. “Farmer Transaction Costs of Participating in Federal Conservation Programs: Magnitudes and Determinants.” Land Economics 92 (2): 256–272. doi:10.3368/le.92.2.256.
- McCann, L., B. Colby, K. W. Easter, A. Kasterine, and K. V. Kuperan. 2005. “Transaction Cost Measurement for Evaluating Environmental Policies.” Ecological Economics 52 (4): 527–542. doi:10.1016/j.ecolecon.2004.08.002.
- Mettepenningen, E., A. Verspecht, and G. Van Huylenbroeck. 2009. “Measuring Private Transaction Costs of European Agri-Environmental Schemes.” Journal of Environmental Planning and Management 52 (5): 649–667. doi:10.1080/09640560902958206.
- Mettepenningen, E., and G. Van Huylenbroeck. 2007. “Factors Influencing Private Transaction Costs Related to Agri-Environmental Schemes in Europe.” In Multifunctional Rural Land Management, Economics and Policies, edited by F. Brouwer, and C. M. Van der Heide, 145–168. London: Earthscan.
- Mettepenningen, E., V. Beckmann, and J. Eggers. 2011. “Public Transaction Costs of Agri-Environmental Schemes and Their Determinants: Analysing Stakeholders’ Involvement and Perceptions.” Ecological Economics 70 (4): 641–650. doi:10.1016/j.ecolecon.2010.10.007.
- Muradian, R., E. Corbera, U. Pascual, N. Kosoy, and P. H. May. 2010. “Reconciling Theory and Practice: An Alternative Conceptual Framework for Understanding Payments for Environmental Services.” Ecological Economics 69 (6): 1202–1208. doi:10.1016/j.ecolecon.2009.11.006.
- Nilsson, F. O. L. 2009. “Transaction Costs and Agri-Environmental Policy Measures.” Journal of Environmental Planning and Management 52 (6): 757–775. doi:10.1080/09640560903083723.
- North, D. C. 1992. Transaction Costs, Institutions, and Economic Performance. San Francisco, CA: ICS Press.
- Organisation for Economic Co-Operation and Development (OECD). 2013. Providing Agri-Environmental Public Goods through Collective Action. Paris: OECD Publishing. doi:10.178/9789264197213-en.
- Ostrom, E. 1990. Governing the Commons: The Evolution of Institutions for Collective Action. Cambridge: Cambridge University Press.
- Pattanayak, S. K., S. Wunder, and P. J. Ferraro. 2010. “Show Me the Money: Do Payments Supply Environmental Services in Developing Countries?” Review of Environmental Economics and Policy 4 (2): 254–274. doi:10.1093/reep/req006.
- Peerlings, J. H. M., and N. B. P. Polman. 2008. “Agri-Environmental Contracting of Dutch Dairy Farms: The Role of Manure Policies and the Occurrence of Lock-In.” European Review of Agricultural Economics 35 (2): 167–191. doi:10.1093/erae/jbn022.
- Pesche, D., P. Méral, M. Hrabanski, and M. Bonnin. 2013. “Ecosystem Services and Payments for Environmental Services: Two Sides of the Same Coin?” in Governing the Provision of Ecosystem Services. Studies in Ecological Economics, Volume 4, edited by R. Muradian and L. Rival, 67–86. Dordrecht: Springer.
- Rørstad, P. K., A. Vatn, and V. Kvakkestad. 2007. “Why Do Transaction Costs of Agricultural Policies Vary?” Agricultural Economics 36 (1): 1–11. doi:10.1111/j.1574-0862.2007.00172.x.
- Royer, A. 2011. “Transaction Costs in Milk Marketing: A Comparison between Canada and Great Britain.” Agricultural Economics 42 (2): 171–182. doi:10.1111/j.1574-0862.2010.00506.x.
- Runhaar, H., and N. Polman. 2018. “Partnering for Nature Conservation: NGO-Farmer Collaboration for Meadow Bird Protection in The Netherlands.” Land Use Policy 73 (Apr): 11–19. doi:10.1016/j.landusepol.2018.01.033.
- Slangen, L. H. G., R. A. Jongeneel, N. B. P. Polman, J. A. Guldemond, E. M. Hees, and E. A. P. Van Well. 2008. “Economische en Ecologische Effectiviteit Van Gebiedscontracten.” [Economic and Ecological Effectiveness of Collective Nature and Wildlife Conservation Contracts]. WOt-Report 84, Statutory Research Tasks Unit for Nature and the Environment. Wageningen: Wageningen University and Research. https://edepot.wur.nl/29634.
- Termeer, C. J. A. M., M. Stuiver, A. Gerritsen, and P. Huntjens. 2013. “Integrating Self-Governance in Heavily Regulated Policy Fields: Insights from a Dutch Farmers’ Cooperative.” Journal of Environmental Policy & Planning 15 (2): 285–302. doi:10.1080/1523908X.2013.778670.
- Terwan, P., J. G. Deelen, A. Mulders, and E. Peeters. 2016. The Cooperative Approach under the New Dutch Agri-Environment-Climate Scheme. Background, Procedures and Legal and Institutional Implications. The Hague, Netherlands: Ministry of Economic Affairs. Accessed 2 August 2021. https://ec.europa.eu/enrd/sites/default/files/w12_collective-approach_nl.pdf.
- Van der Windt, H. J., and J. A. A. Swart. 2018. “Aligning Nature Conservation and Agriculture: The Search for New Regimes.” Restoration Ecology 26 (S1): S54–S62. doi:10.1111/rec.12570.
- Vatn, A. 2010. “An Institutional Analysis of Payments for Environmental Services.” Ecological Economics 69 (6): 1245–1252. doi:10.1016/j.ecolecon.2009.11.018.
- Wang, N. 2003. “Measuring Transaction Costs: An Incomplete Survey.” Ronald Coase Institute Working Papers. Number 2. http://www.coase.org/workingpapers/wp-2.pdf.
- Weber, A. 2014. “How Are Public Transaction Costs in Regional Agri-Environmental Schemes Delivery Influenced by EU Regulations?” Journal of Environmental Planning and Management 57 (6): 937–959. doi:10.1080/09640568.2013.776950.
- Weber, A. 2015. “Implementing EU Co-Financed Agri-Environmental Schemes: Effects on Administrative Transaction Costs in a Regional Grassland Extensification Scheme.” Land Use Policy 42: 183–193. doi:10.1016/j.landusepol.2014.07.019.
- Westerink, J., R. Jongeneel, N. Polman, K. Prager, J. Franks, P. Dupraz, and E. Mettepenningen. 2017. “Collaborative Governance Arrangements to Deliver Spatially Coordinated Agri-Environmental Management.” Land Use Policy 69: 176–192. doi:10.1016/j.landusepol.2017.09.002.
- Williamson, O. E. 1981. “The Economics of Organization: The Transaction Cost Approach.” American Journal of Sociology 87 (3): 548–577. https://www.jstor.org/stable/2778934.
- Williamson, O. E. 1985. The Economic Institutions of Capitalism. New York: Free Press.
- Williamson, O. E. 1996. The Mechanism of Governance. New York: Oxford University Press.
- Williamson, O. E. 1998. “Transaction Cost Economics: How It Works; Where It is Headed.” De Economist 146 (1): 23–58. doi:10.1023/A:1003263908567.