Abstract
Although theory strongly suggests that liberal democracies should perform better than autocracies on sustainability indicators, the empirical evidence is unclear. Using multivariate statistical techniques, political factors such as the stability of the system, public opinion, the nature of the party system and other institutional features such as presidentialism are considered. Liberal democracy is given qualified endorsement: it typically promotes weak sustainability, and stable core autocracies perform worse on strong sustainability measures than stable core democracies. Presidentialism generally is bad for sustainability. However, there is no compelling evidence that public opinion matters, even allowing for the intervening effects of the party system and institutional structure, which raises questions about the nature of the democratic process.
Introduction
Do liberal democracies perform better than autocracies on sustainability indicators? Theory strongly suggests that they should, but the empirical evidence is ambiguous. The contradictory answers provided by existing statistical studies could be due to using narrowly defined rather than broad indicators of sustainability, failure to control for public opinion and failure to model institutions that intervene between public opinion and outcomes. Using multivariate statistical techniques to try to resolve these problems, I conclude that liberal democracy typically promotes weak sustainability while stable core autocracies perform worse on strong sustainability measures than stable core democracies.
Theoretical claims
Green political theorists' critique of the claim that authoritarian solutions to environmental problems are necessary (Hardin Citation1968; Ophuls and Boyan Citation1992) has focused on hypothetical eco-authoritarian futures. Is centralisation of power necessary to overcome self-interest (Walker Citation1988)? Would eco-guardianship collapse into corruption (Stretton Citation1976, pp. 26–34)? Would it undercut deliberation favouring environmental ends (Dryzek Citation1996)? Would it further encourage unsustainable competitive, inegalitarian economic relations and ‘hard’ technologies (Carter Citation1993)? Would green democracy better deliver the security and liberty that could compensate for moving beyond abundance (Barry Citation1999, pp. 194–202)? My focus here, however, is upon existing authoritarian systems.
Viewed from a rational choice perspective, authoritarian rulers do not have incentives to adopt, or to stick with, sustainable policies. They prioritise rapid economic development to gain legitimacy and to bolster external security, as the Soviet regime did (Porritt Citation1984, p. 48). Their control of a high fraction of society's resources encourages them to pay off members of their relatively small support coalition by allowing them to pillage the ecosystem, as there is less political advantage in providing public goods such as environmental quality (Bueno de Mesquita et al. Citation2003). They under-regulate environmental harm because, as controllers of a bigger share of national income, they would disproportionately pay the costs of tighter rules (Congleton Citation1992, p. 416). They tend to ignore the interests of future generations, because their control of power is often precarious (Congleton Citation1992, p. 417). Wars are often environmentally devastating, and democracies fight each other less (Russett and Oneal Citation2001). Authoritarian systems are more prone to civil wars, and civil wars may also be associated with the ‘looting’ of renewable and non-renewable resources (Collier and Hoefler Citation2004). In contrast to these rational choice arguments, the case for liberal democracy is often based on arguments about deliberation and discourse. Concerned citizens can influence political outcomes through the ballot box, pressure groups, social movement activity, the free media and through local political structures, but these channels are to a greater or lesser extent closed in autocracies (Payne Citation1995). To a limited extent virtuous circles exist in liberal democracies between ecological modernisation, active involvement of citizens and international bargaining (Eckersley Citation2004). Democratisation gives political voice to the poor, and if this helps to alleviate poverty it may aid sustainability (UNDP Citation2003, p. 17).
Empirical literature
While the theoretical case is clear, existing empirical evidence is ambiguous. The methodological requirements for making inferences about the impact of authoritarianism include: the sample of countries varying on the authoritarian to democratic dimension; a determinate research design where the number of cases exceeds the number of possible influences on sustainability; the use of the same conceptual categories and measurement methods over all cases. These are essential whether statistical techniques or small-n/comparative ones are used (King et al. Citation1994). While small-n comparative studies are potentially very useful, it is hard to think of any study that satisfies all three requirements. While there are well-designed comparative studies of particular regions such as the EU (e.g. Weale et al. Citation2000, part II) and studies that use a strong theoretical framework to analyse all cases (Dryzek et al. Citation2000), most do not include authoritarian alongside democratic systems. An exception is Jänicke and Weidner's volume on capacity building, which includes Chile, China, Nigeria and Russia alongside core democracies, coding capacity-building in the same way for each case, and finding convergence between the cases and a remarkable increase in capacity over a 25-year period (Jänicke and Weidner Citation1997, pp. 311–12). While the implementation gap may be larger in authoritarian systems (ibid., p. 312), they do not really stand out. Transitions to democracy seem to constitute a natural experiment, and studies exist of the environmental effects of transitions in eastern Europe. However it is difficult to disentangle the effects of post-transition environmental policy from the collapse in heavy industry due to neo-liberal economic policies (Pavlinek and Pickles Citation2000, pp. 246–8). Many of these countries tried to improve environmental quality before transition, partly to obtain Western loans (ibid., p. 57), and, in pursuit of EU membership many had to adopt higher standards. It is hard to isolate the effect of transitions per se.
If the small-n comparative literature gives few answers, the statistical literature gives unclear ones. Results appear to depend on the performance indicators used, what other variables are controlled for, how democracy and liberal freedoms are measured, and the sample. Midlarsky (Citation1998) finds that scores on three standard democracy indexes sometimes do and sometimes do not correlate positively with measures of environmental quality. Grafton and Knowles (Citation2004), using a series of composite indicators rather than individual indicators like Midlarsky, find no evidence that democracy effects environmental performance. Barrett and Grady (Citation2000) specifically examine the effect of political and civil freedoms while allowing for the possibly non-linear effects of wealth. While they find that freedom scores do mostly positively impact on measures of air pollution, the results for water pollution are mixed and some coefficients are even negative. Dasgupta et al. (Citation2001) report similar results using indicators based on coding national environmental reports to the UN's Rio Earth Summit. Fredriksson et al. (Citation2005) find that national limits on the lead content of petrol go down with the number of environmental pressure groups and with the degree of political competition, so long as political participation is high enough. In contrast, Grafton and Knowles (Citation2004) find no evidence that participation in civil associations matters and add that other measures of social capital have no apparent effect either. Neumayer (Citation2002; Gates et al. Citation2003) finds that democracies sign more multilateral environmental treaties, belong to more environmental inter-governmental organisations and comply more fully with international obligations. However, many international environmental regimes are ineffective. Consistent with this, Congleton (Citation1992) found that democracies were more likely to sign international agreements to limit the use of CFCs, but produced more of them.
Although the theoretical case against authoritarian systems is markedly stronger than the empirical one, this may be due to problems with the existing statistical literature. First, it typically examines a single environmental indicator, or a small set of indicators considered separately. This gives little insight into the relationship between sustainability and democracy. As diverse as concepts of sustainability are, they typically allow for some trade-offs between different dimensions of environmental performance. Scruggs (Citation2003) makes a strong case for using broad measures of sustainability, but his analysis covers only OECD countries, which vary little in their democracy scores.
Second, most of the existing literature does not control for the degree of public support for environmental cleanup. Although Congleton (Citation1992) suggests that environmental quality in a democracy will be a function of what the median voter wants, he controls for neither this factor nor for broader measures of public opinion. Similarly Grafton and Knowles (Citation2004) use broad measures of sustainability and a sample including both democracies and autocracies, but they fail to control for public opinion. While Scruggs (Citation2003, pp. 78–121) does investigate links between public opinion and broad sustainability indicators, his sample is limited. Using a bigger sample, I can allow for the possibility that the degree to which public opinion matters depends on how democratic a country is.
Third, the literature largely ignores type of democracy. Lijphart (Citation1999, pp. 295–7) claims that there is a strong correlation between whether a country is a consensus democracy and its environmental performance, but this is based on bivariate correlations over a sample of 36 democracies, with no attempt to control for confounding factors. In contrast, Scruggs (Citation2003, pp. 162–90) only finds that democracies with more unified power structures perform better (ibid., p. 184). I distinguish stable from unstable systems, investigate the effects of the party system, distinguish presidential from parliamentary systems and consider the impact of federalism.
Research design
Here I consider the conceptualisation and measurement of sustainability and liberal democracy before discussing why I had to adopt a cross-sectional design and visually presenting the bivariate relations between the democracy and sustainability indicators. The discussion of the figures raises issues about control variables, covered in the final part of this section.
Sustainability
Sustainability is a complex, contested concept (Dobson Citation1998; Neumayer Citation2003). While some go beyond consideration of human welfare, others follow the Brundtland Commission, emphasising ability to meet the needs of current generations without compromising future generations' ability to meet theirs (WCED Citation1987). Some emphasise that there are natural systems which cannot be eroded or destroyed without compromising future generations' interests (strong sustainability), while others believe that it is possible to offset such destruction by investing in man-made substitutes (weak sustainability).
I use two well-known measures. Footnote1 Footprint is the area in hectares necessary to sustain the lifestyle of an average citizen, standardising land areas for their carrying capacity (Wackernagel et al. Citation2002). I regard footprint as a measure of strong sustainability. While it does not allow for substitution between natural capital and man-made capital, in deploying a common unit of account to measure various environmental impacts it implicitly allows substitution between different forms of natural capital; so it is open to the objection that it does not recognise that some are irreplaceable (Opshoor Citation2000). Also, by geographical averaging, it ignores local hotspots (Van Kooten and Bulte Citation2000).
Second, I use the World Bank's genuine (adjusted net) saving measure. Gensav attempts to measure the true rate of saving in a national economy as a percentage of gross national income, allowing for differences in purchasing power (Bolt et al. Citation2002). After putting a shadow price on depletion of natural capital, this is subtracted from net economic investment plus education spending, using the latter as a proxy for building human capital. Pollution damage is allowed for by pricing the effects of climate change, because it is difficult to deal with other forms of pollution. Genuine saving measures weak sustainability, for it is based on the assumption that there are substitutes for all forms of natural capital. Objections include the limited environmental data employed (Dietz and Neumayer Citation2004). Because of considerable short-term fluctuation in some countries, I took the average over the years 1995–2001. The correlation between footprint and gensav is only 0.18 (n = 107), emphasising the difference between strong and weak sustainability.
Liberal democracy
The polity scale focuses on competition for political office and whether the executive is constrained by the legislature (Gurr et al. Citation1990). Coders' judgements are weighted, then combined into an 11-point democracy and an 11-point autocracy scale. Then latter is subtracted from the former to give a 21-point score, democracy. The scale excludes measures of civil and human rights, making it less useful for some purposes than the Freedom House scale. However, the scales are highly correlated; it makes little difference which is used (cf. Neumayer Citation2002).
Cross-sectional analysis
While bringing in the time dimension would help (Damania et al. Citation2003), data limitations force me to adopt a cross-sectional approach with variables measured as close to 2000 as possible. Of the two sustainability indicators used, time series data are only available by country for gensav, and in this case limitations of country coverage and the need to smooth short-term fluctuations push one towards a cross-sectional approach. Public opinion data for a large sample was only available cross-sectionally.
Bivariate relationships between democracy and sustainability
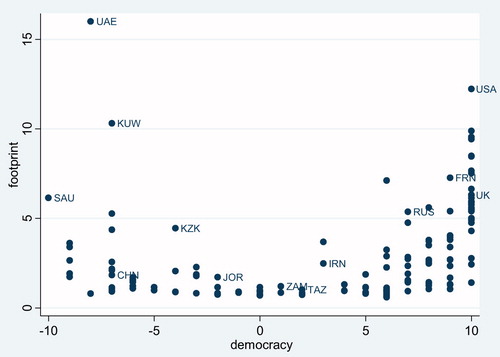
In both autocracies with large negative scores and core liberal democracies with high positive scores tend to have big per-capita footprints; the relationship is U-shaped. Countries at the midpoint of the scale, such as Jordan (JOR), Zambia (ZAM) and Iran (IRN), have low footprints compared with the USA, France (FRN), the UK and many authoritarian systems. Apparently both autocracy and democracy are bad for strong sustainability.
Figure 1. The bivariate relationship between footprint and democracy.
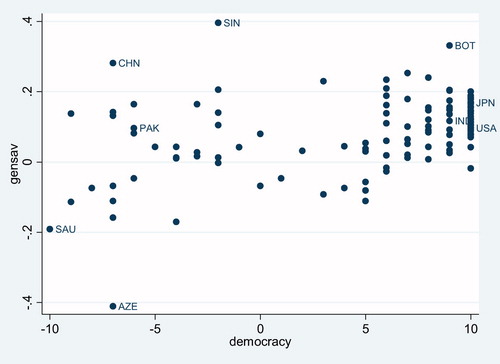
On the other hand, countries with larger democracy scores tend to have higher genuine saving rates, as shown in . For instance Azerbaijan (AZE) has a genuine savings rate of –4 per cent and a democracy score of –7. On the other hand India (IND), with a not dissimilar level of income per capita, has a savings rate of 1.1 per cent and a democracy score of 9. Although the trend is visible, China (CHN), Singapore (SIN) and Botswana (BOT) all have high genuine savings levels despite varying greatly in their democracy scores. Pakistan (PAK) and Azerbaijan have very similar democracy scores but quite different genuine savings rates. and both indicate that there is considerable variation that is not explained by democracy, indicating the need to include control variables.
Figure 2. The bivariate relationships between gensav and democracy.
Control variables
In subsequent sections, I introduce a range of additional political variables, but it is better to discuss these as the logic of the empirical analysis dictates. Here I discuss other control variables. In choosing them, I drew on prior statistical research, outlined above, and examination of bivariate relationships, starting from a larger set than those discussed here. Some argue that as countries get richer, environmental quality first deteriorates then eventually starts to improve, though the evidence is limited (Grossman and Krueger Citation1995). Two factors could be at work: movement from agriculture into relatively dirty manufacturing and finally into a cleaner economy; or, with increased income, growing demand for a clean environment. Although it was once widely believed that as countries become richer they eventually would become more democratic, democracy actually emerges randomly but is more likely to survive in richer countries (Przeworski and Limongi Citation1997). Either way, the apparent U-shaped relationship between footprint and democracy might arise because the effects of democracy and increased wealth are confounded when wealth is not controlled for. To do so, I started with gnicap – gross national income per capita in year 2000 dollars allowing for differential purchasing power, from the World Bank development tables. Given non-linear effects, I controlled for either the square of income, gnicapsq, or its natural logarithm, lngnicap, depending on statistical power.
I also controlled for population in millions, pop; population growth, popgrow; and population density, density. These are appropriate controls, because population pressures interact with consumption growth to increase environmental impact, and because high density may produce political pressure to do something (Scruggs Citation2003). Latitude is the number of degrees north or south of the equator of the capital city of a country, harsher climates possibly leading to higher energy consumption.
Because poor, undemocratic countries often have partly pre-modern or dual economies, there is a danger of spuriously assigning to autocracy the effects of such structures. Also we need to consider domestic industrial and associated labour interests that might oppose environmental cleanup (Sprinz and Vaahtoranta Citation1994). I tried measures of the percentage of GDP produced by agriculture, manufacturing, the service sector and government, but these were far from significant. Looking at the autocracies with high footprints in , many of them are oil and gas producers, e.g. the United Arab Emirates (UAE). It is possible that part of the U-shaped relationship is spurious: oil-rich states tend to be autocracies and to have high footprints due to oil production. Energy, the value of fossil fuel production as a percentage of GDP (International Energy Agency) proved highly significant. While some suspect that trade liberalisation will lead to regulatory races to the bottom and lower standards, this is contingent on a number of factors, and the opposite effect might occur (Damania et al. Citation2003). Trade in goods as a percentage of gdp, trade, is included to allow for this.
Multivariate models
I present a sequence of models, starting with a baseline model that does not include political variables. Then I successively introduce democracy scores, stability measures, public-opinion measures and institutional measures.
Democracy, stability and sustainability
Regression 1, , is the baseline model for footprint. As footprint is highly left-skewed and bounded below by zero, I log-transformed it to avoid heteroskedasticity. Thus the natural log of footprint, lnfootprint, is the dependent variable. As shown, a large percentage of the variance can be explained by controls. All variables are significant at the 95% level or above, as indicated by t-values in parenthesis. Examining the coefficients of gnicap and gnicapsq, footprint increases up to per capita incomes of $23,288, then starts to decrease. Population growth is associated with lower values of footprint, but this may be the effect of uncontrolled aspects of wealth or the wealth distribution. Footnote2 Density is associated with lower values of footprint. Latitude is positively related to footprint. Energy is associated with higher values of footprint.
Table 1. Initial models (t-values in parenthesis: ***p < 0.01; **p < 0.05; *p < 0.1).
As indicates a non-linear relationship between democracy and footprint, I added the square of the democracy score demsq to the baseline model. As shown in regression 2, this has a significant positive coefficient: the U-shaped relationship in survives when we control for other factors. Footnote3
While in democracies social stability might give politicians the breathing space to tackle environmental issues, in autocracies it might allow elites to carry on with unsustainable practices. The positive effects of stability on sustainability might not operate unless a country was beyond some democratic threshold, which suggests employing a dichotomous concept of democracy (Przeworski et al. Citation1996). Footnote4 In regression 3 I add demdichot, which takes on the value 1 if a nation's score on the polity scale was 7 or above and zero otherwise. To allow for stability, I add the World Bank's scale, stability, which combines measures of political stability and the absence of violence (Kaufmann et al. Citation2004). Footnote5 Finally I add the interaction term stability_demdichot = stability * demdichot to test the possibility that only under democratic conditions will stability be advantageous. The overall estimated slope of stability is (0.156 – 0.225 * demdichot). Thus if a country is not democratic (demdichot = 0), stability has a positive impact on footprint. Taking into account interaction effects, the coefficient for non-democracies is significantly different from zero. However, although the central estimate for democracies is that stability reduces footprint, this effect is not significant.
Regression 4 is the baseline model for gensav. Footnote6 Similar wealth and population variables to those in the model for footprint are included, though not all the effects are in the same direction and the basic model explains a considerably lower proportion of the variance. Notably, energy again proves to be a significant problem while trade has a significant and positive impact on weak sustainability, though it was not significant in models for strong sustainability.
In regression 5, democracy is added to the baseline model, having a significant positive effect on weak sustainability. Footnote7 I found no evidence that stability had a conditional effect on gensav, but in regression 6, stability is marginally significant, with a positive coefficient.
In summary, initial indications are that: there may be a non-linear relationship whereby the most autocratic and the most democratic countries perform worse on strong sustainability, but stable autocracies perform particularly badly; democracy favours weak sustainability. Before this is confirmed, we need to look at the links between public opinion and policy.
Public attitudes, democracy and sustainability
Until recently, cross-nationally comparable measures of public opinion about the environment were only available for rich democracies. However, the fourth wave of the World Values Survey (1999–2001) covered a wider sample of countries. Although making use of this data reduces the sample size to under 60, it provides a unique opportunity to asses the impact of public opinion. Footnote8 Depending on the country, several relevant measures can be calculated:
envmem: proportion reporting they belonged to an environmental group;
envtaxsup: average level of support for tax increases for environmental cleanup;
envincsup: proportion who said they would give part of their income for environmental cleanup. Footnote9
Questions making clear the price to be paid, such as those on income and tax, help to avoid false responses. The correlation between envincsup and envtaxsup is high, at about 0.91 (n = 54). Because the relevant question about tax was asked in more countries (n = 67), I use envtaxsup.
In regressions 1 and 2 in I add envtaxsup and envmem, respectively, to the baseline model for lnfoootprint. Neither variable is significant, and envmem is wrongly signed; if anything, footprint goes up with membership of environmental groups, other things being equal. Public opinion ought to have more impact in democracies, so in regression 3 I include demdichot and the interaction term envtaxsup_demdichot = envtaxsup * demdichot. Paradoxically, the results suggest that envtaxsup has a marginally significant negative effect on footprint in non-democracies but no significant effect in democracies.
Table 2. Public attitudes (t-values in parenthesis: ***p < 0.01; **p < 0.05; *p < 0.1).
Regressions 4 to 6 are models for gensav. Entaxsup is correctly signed but insignificant in regression 4. In regression 5, envmem is significant but has a negative sign where theory suggests a positive one. In regression 6, in non-democracies envtaxsup has a marginally significant positive relationship with gensav, paralleling the results on strong sustainability; but it is insignificant when demdichot = 1.
Summarising, there is little to suggest that supportive public opinion impacts on outcomes and, to the extent that there is evidence, the effects seem paradoxical. In the next two sections I address the possibility that this is because political institutions intervene between public opinion and outcomes.
The party system and sustainability
The existence of an effective green party might help, by voicing green concerns, participating in government or pushing other parties to adopt greener policies. Countries were coded 1 on greenparty if there was a national affiliate of the Global Greens in existence in 2001 and zero otherwise. Greenoffice takes on the value 1 for countries scoring 1 on greenparty in which a green party had held a ministerial portfolio at any time between 1980 and 2000. For cases scoring 1 on greenparty, I calculated the percentage of elected seats in the national legislative chamber(s) that had been won over the period 1980 to 2000, greenseat. Footnote10 I found greenseat to be the more powerful predictor of footprint, having a marginally significant negative coefficient in regression 1, . In developed countries, social corporatism promotes ecological modernisation (Crepaz Citation1995; Jänicke Citation1997; Scruggs Citation2003, pp. 122–61). Greenseat may act as a proxy for social corporatism, because the greens have generally done better in electoral terms in corporatist western European nations. The several attempts to measure corporatism extend only to around 18 OECD member states. In regression 2, I add the Hicks/Kenworthy measure, corporatism (Kenworthy Citation2003). Because there is no variation in democracy scores across these cases, I removed democracy scores and other extraneous variables. In regression 2, greenseat is no longer significant, suggesting that the results from regression 1 could be spurious.
Table 3. The party system (t-values in parenthesis: ***p < 0.01; **p < 0.05; *p < 0.1).
It is difficult for green parties to make national-level electoral breakthroughs in first-past-the-post electoral systems. In the absence of a green threat, major parties are less likely to emphasise green themes. In line with this, while some mainstream European parties have increasingly emphasised environmental issues, visual inspection suggests that the degree to which they have done so depends on the existence of a green threat (Weale et al. Citation2000, pp. 246–50). Thus we might expect better performance where the party system is more open to green entrants, or there exist small left-libertarian parties capable of bearing the green message.
Fractionalisation is the probability that any two members of the legislature picked at random will belong to different parties, increasing with number of parties and with the equality of spread of seats across parties. Footnote11 This measure is positively correlated with other indicators of openness of the party system, such as the effective number of parties, district magnitude and proportional representation. I took the average of Keefer's (Citation2005) legislative fractionalisation index for the period 1980 to 2000, frac, as an indicator. In regression 3, I add frac, which proved insignificant and had the opposite sign to that expected on theoretical grounds. It is possible that the openness argument only applies in democracies. In regression 4, I add the interaction term frac_demdichot = frac * demdichot. Allowing for the interaction, frac has a positive and significant impact on footprint in non-democracies, but it is insignificant when demdichot = 1. Finally, in regression 5, I add the interaction envtaxsup_frac = envtaxsup * frac, to test the possibility that openness only helps if there is demand for environmental cleanup; there were no significant effects.
There is little evidence that the strength of green parties or the openness of the party system matters to gensav. When green party variables are added to the model they are not always correctly signed, and even when they are so signed they are insignificant, as shown in regression 6. When frac is added to the basis model it is correctly signed but insignificant. Probing further, I included the interaction frac_demdichot in regression 7. Frac is still not significant. Moreover, openness is less helpful to weak sustainability in democracies, as suggested by the sign of the coefficient on the interaction term.
In summary, there is little to suggest that the openness of the political system to the green message helps. It is possible, however, that other constitutional structures are significant.
Constitutional structure and sustainability
Presidential systems may produce lower rates of taxation but also lower supplies of public goods, which suggests that they may be less sustainable. The confidence requirement in parliamentary systems produces stable patterns of party voting and a coalition whose re-election chances depend on delivering benefits the majority desires, including public goods. In contrast, given the checks and balances in presidential systems, the need for logrolling often leads to particularistic policies serving powerful minorities (Persson and Tabellini Citation2005, pp. 24–5). I used Keefer's (Citation2005) coding of presidential systems, presidential = 1, versus parliamentary and mixed systems, presidential = 0. As shown in regression 1, , this variable was correctly signed but not significant in a model for footprint. Regression 2 includes demdichot and the interaction term presidential_demdichot = presidential * demdichot. The interaction effect shows that footprint is significantly higher in presidential democracies, but there is no significant effect from presidentialism in non-democracies.
Table 4. Institutions (t-values in parenthesis: ***p < 0.01; **p < 0.05; *p < 0.1).
It is hard to use existing measures to capture the degree of devolution of environmental policy-making, but federalism might be relevant (Fredrikkson and Gaston Citation2000). Keefer (Citation2005) reports a number of measures. Inserting these into the model generally produced non-significant results and/or coefficients with signs opposite to those expected on theoretical grounds. Regression 3 reports one such model, where auton is a dummy variable taking on the value 1 if a country has autonomous regions and zero otherwise, proving to be correctly signed but insignificant.
Regression 4 includes presidential in a model for gensav. The coefficient is negative and approaches significance at the 90% level. I found no evidence for an interaction effect with democracy or that federalism matters.
In summary, there are indications that there is a specific problem with presidential systems.
Final models
I started by including all variables found to be significant, or close; some were clearly insignificant and were dropped. The final models were checked for multicolinearity, and robustness checks were carried out to ensure that results were not driven by observations that were outliers or had high leverage. To facilitate comparison, I report standardised regression coefficients (or beta weights). These indicate how many standard deviations the dependent variable shifts for a 1 standard deviation change in the independent variable.
Regression 1 in reports the final model for lnfootprint for the larger sample. Because of the non-linear term demsq and the interaction terms with demdichot, it is slightly complex to work out what the final conclusion should be over the effect of democracy. The most interesting contrasts are between stable core autocracies and stable core democracies. The baseline for comparison, 0, corresponds to a country at the neutral point of 0 on the democracy scale and the mean of the stability scale. In making comparisons, all other variables are assumed equal. For a country scoring minus 10 on the democracy scale and 1 standard deviation above the mean on the stability scale, the log of its footprint is 0.353 standard deviations above baseline. Noting that the stability effect is only significant if countries fall below 7 on the democracy scale, for a stable country scoring plus 10 on the democracy scale, the log of its footprint is 0.165 standard deviations above baseline. Countries can also fall below this baseline – e.g., a country 1 standard deviation below the mean on the stability scale and at the neutral point on the democracy scale is at minus 0.188. However, such cases may be gravitating towards stability at one or other end of the democratic spectrum. The other interesting effect concerns presidentialism, where the log of footprint is 0.095 standard deviations higher in a presidential democracy than in a non-presidential democracy, other things being equal. Footnote12 Turning to regressions 2, there is little evidence that public opinion influences footprint, the only thing to note being the marginally significant negative effect of envtaxsup in non-democracies.
Table 5. Final models (t-values in parenthesis: ***p < 0.01; **p < 0.05; *p < 0.1).
Regressions 3 is the final model for gensav. I dropped lngnicap, which was clearly non-significant in final models if stability was included. This could be the result of multicolinearity as these two variables have a bivariate correlation of around 0.72 (n = 148). I dropped democracy from final models since it was insignificant when demdichot was included. I highlight the way that the effects of demdichot are conditional on levels of frac. Frac ranges from 0 to 1. So long as it is less than around 0.55, or 0.37th of a standard deviation above its mean value, demdichot has a significant and positive relationship with gensav. At 1 standard deviation above the mean of frac, the effect of demdichot approximates zero and is non-significant. In other words, as long as the party system is not too open, democracies do better in relation to weak sustainability than non-democracies. In majoritarian systems, which are likely to have lower scores on frac, budget deficits and government spending as a proportion of GDP tend to be lower (Persson and Tabellini Citation2005, pp. 158–83). If smaller government is associated with higher capital accumulation in the private sector, higher values of frac might push down this component of gensav. Notice that envtaxsup does not appear in the final model for gensav; there is no evidence that public support has any effect. In line with the finding that presidentialism is bad for strong sustainability in democracies, presidential has a significant negative coefficient.
Conclusion
By focussing on sustainability and distinguishing stable and unstable systems, I get more definite results than those in the existing statistical literature. In line with theory, stable core autocracies perform worse on strong sustainability than stable core democracies. It is precisely in stable core autocracies, not subject to pressures for change and to internal challenges, that the idea that the regime will exploit the environment for immediate personal gain is most plausible. Many systems of this sort are also oil-producing states, but the effect I identify is distinct from that of fossil fuel production. On the evidence presented here, liberal democracy too generally promotes weak sustainability. The exception is where the party system is too open. The general pattern could easily be due to the fact that liberal democracy promotes investment in human and physical capital, while the exception could be due to the fact that political uncertainty consequent on large numbers of small parties reduces such investment.
As far as I am aware, no other statistical study controls for public opinion. What is puzzling is that I find little evidence that it matters. In democracies it does not seem clearly to impact on either strong or on weak sustainability. Apart from somewhat ambiguous evidence that green parties play a role, there is little to suggest that lack of openness of the party system is what blocks the transmission of public opinion into policy. It might well be that on the new issues such as the environment, elites form public opinion as much as respond to it, and should be willing to act in advance of public opinion. Better data will be required before we can be confident of this interpretation, because we lack comparative measures of elite opinion.
While decentralisation of the political system was not found to matter, it is too early to write off the idea that it is, as widely advocated by green political theorists, desirable from a green perspective. We need cross-nationally comparable measures of decentralisation of specifically environmental functions. From a green perspective, decentralisation is important partly because of the opportunities it gives for greater citizen involvement and for deliberation. Ideally, we also need cross-nationally comparable measures of such involvement to probe the ‘missing link’ between public opinion and sustainability.
Moving beyond the existing empirical literature, I find some evidence that presidential democracies score worse on strong sustainability and firm evidence that they perform worse on weak sustainability. This supports the idea that presidential bargaining with the legislature gives too many opportunities for economic special interests to scupper environmental initiatives, as some suggest has occurred in the US under George W. Bush's administration. This last example can be used to illustrate the general point that large-N statistical research needs to be complemented by more detailed qualitative and comparative research before we can interpret the correlations it uncovers.
Dryzek claims that ‘[if] two or more decades of political ecology yield any single conclusion, it is surely that authoritarian and centralised means for the resolution of environmental problems have been discredited rather decisively' (1996, p. 108). While Dryzek correctly summarised the theoretical debate, the existing empirical evidence is far more ambiguous. My analysis suggests that liberal democracy can be given the more positive report, although green theorists will no doubt remark on the numerous ways in which it could do better.
Notes
1. An alternative is the World Economic Forum's sustainability index (GLTETF Citation2002), but Ward (Citation2006) shows that it is inappropriate to add the components used as they do not satisfy the scalability criterion.
2. Popgrow has a correlation of 0.42 (n = 125) with a nation's Gini coefficient, reported closest to the year 2000 in World Bank development tables. However the cross-national comparability of inequality measures is doubtful.
3. If democracy is added alongside demsq to regression 1, the former variable is nowhere near significant whereas the latter is still highly significant. Various lagged value of a nation's democracy score were added to regression 1, but no significant effects showed up.
4. Across the analysis here interactions with the continuous version of the democracy variable are generally weaker.
5. Stabilility correlates highly with Kaufmann et al.' s (Citation2004) composite measure of efforts to deal with corruption (0.79, n = 141) and moderately highly with the World Economic Forum's (GLTETF Citation2002) measure of capacity for environmental governance (0.57, n = 141). So part of what is being captured here might concern the effect of good governance on sustainability.
6. Models for gensav generally suffered from heteroskedasticity, hence the reported significance scores are based on robust standard errors.
7. I found no evidence for non-linear or more powerful lagged effects.
8. The only comparable survey is the 2002 Gallup Voice of the People Poll carried out in 2002. The N is considerably lower at 31. Available from www.voice-of-the-people.net, accessed 24 April 2008.
9. Envtaxsup and envincsup are based on thermometer scales where respondents were asked whether they strongly agreed (=1), agreed (=2), disagreed (=3) or strongly disagreed (=4) with a statement that taxes or higher prices should be used to fund environmental cleanup. After averaging I inverted the scales by subtracting the scores from 5.
10. I used Szajkowski (2005), the Psephos election archive and Electionworld. Results were cross-checked with calculations on the Global Greens website and in Müller-Rommel, Citation2002. Minor discrepancies were resolved by averaging. When it was clear that a green party had re-emerged or had a clear successor party, electoral performance of earlier incarnations was included.
11. Fredriksson et al. (Citation2005) argue that the lack of competitiveness of a political system, measured by the vote share of the largest party, should matter; and they find some evidence that it does so in relation to one environmental indicator.
12. Presidential is only significant in democracies. Frac has a marginally significant positive effect in non-democracies, but this is hard to interpret.
Related Research Data
References
- Barrett , S. and Grady , K. 2000 . Freedom, growth and the environment . Environment and Development Economics , 5 ( 4 ) : 433 – 456 .
- Barry , J. 1999 . Rethinking green politics , Thousand Oaks , CA : Sage .
- Bolt , K. , Matete , M. and Clemens , M. 2002 . Manual for calculating adjusted net savings , Washington , DC : Environment Department, World Bank .
- Bueno de Mesquita , B. , Smith , A. , Silverson , R. M. and Morrow , J. D. 2003 . The logic of political survival , Cambridge , MA : MIT Press .
- Carter , A. 1993 . “ Towards a green political theory ” . In The politics of nature: Explorations in green political theory , Edited by: Dobson , A. and Lucardie , P. 39 – 62 . London : Routledge .
- Collier , P. and Hoeffler , A. 2004 . Greed and grievance in civil war . Oxford Economic Papers , 56 ( 4 ) : 563 – 595 .
- Congleton , R. D. 1992 . Political institutions and pollution control . Review of Economics and Statistics , 74 ( 4 ) : 412 – 421 .
- Crepaz , M. M.L. 1995 . Explaining national variation in air pollution levels: Political institutions and their impact on environmental policymaking . Environmental Politics , 4 ( 3 ) : 391 – 414 .
- Damania , R. , Frederiksson , P. G. and List , J. A. 2003 . Trade liberalization, corruption, and environmental performance: Theory and evidence . Journal of Environmental Economics and Management , 46 ( 4 ) : 490 – 512 .
- Dasgupta , S. , Mody , A. , Roy , S. and Wheeler , D. 2001 . Environmental regulation and development: A cross-country empirical analysis . Oxford Development Studies , 29 ( 2 ) : 173 – 187 .
- Dietz , S. and Neumayer , E. 2004 . Genuine savings: A critical analysis of its policy-guiding value . International Journal of Environment and Sustainable Development , 3 ( 3/4 ) : 276 – 292 .
- Dobson , A. 1998 . Justice and the environment: Conceptions of environmental sustainability and dimensions of social justice , Oxford : Oxford University Press .
- Dryzek , J. S. 1996 . “ Strategies of ecological democratisation ” . In Democracy and the Environment , Edited by: Lafferty , W. M. and Meadowcroft , J. 108 – 123 . Cheltenham : Edward Elgar .
- Dryzek , J. S. 2000 . Deliberative democracy and beyond , Oxford : Oxford University Press .
- Dryzek , J. S. , Downes , D. , Hunold , C. and Schlosberg , D. 2000 . Green states and social movements: Environmentalism in the United States, United Kingdom, Germany and Norway , Oxford : Oxford University Press .
- Eckersley , R. 2004 . The green state: Rethinking democracy and sovereignty , Cambridge , MA : MIT Press .
- Electionworld, available online at www.electionworld.org, accessed 22 March 2007
- Fredriksson , P. G. and Gaston , N. 2000 . Environmental governance in federal systems: The effects of capital competition and lobby groups . Economic Inquiry , 38 ( 3 ) : 501 – 514 .
- Fredriksson , P. G. , Neumayer , E. , Damania , R. and Gates , S. 2005 . Environmentalism, democracy, and pollution control . Journal of Environmental Economics and Management , 49 ( 4 ) : 343 – 365 .
- Gates , S. , Gleditsch , N. P. and Neumayer , E. 2003 . “ Environmental commitment, democracy, and inequality ” . In Background paper for World Development Report 2003 , Washington , DC : World Bank .
- Global Greens, available online at www.globalgreens.info, accessed 22 March 2007
- GLTETF (Global Leaders for Tomorrow Environment Task Force, World Economic Forum) . 2002 . 2002 Environmental Sustainability Index , New Haven , CT : Yale Centre for Environmental Law and Policy .
- Grafton , R. Q. and Knowles , S. 2004 . Social capital and national environmental performance: A cross sectional analysis . Journal of Environment and Development , 13 ( 4 ) : 336 – 370 .
- Grossman , G. and Krueger , A. B. 1995 . Economic growth and the environment . Quarterly Journal of Economics , 110 ( 3 ) : 353 – 377 .
- Gurr , T. R. , Jaggers , K. and Moore , W. H. 1990 . The transformation of the western state: The growth of democracy, autocracy, and state power since 1800 . Studies in Comparative International Development , 25 ( 1 ) : 73 – 108 .
- Hardin , G. 1968 . The tragedy of the commons . Science , 162 ( 8 ) : 1243 – 1248 .
- Jänicke , M. 1997 . “ Democracy as a condition for environmental policy success: The importance of non-institutional factors ” . In Democracy and the environment , Edited by: Lafferty , W. M. and Meadowcroft , J. 71 – 85 . Cheltenham : Edward Elgar .
- Jänicke , M. and Weidner , H. 1997 . National environmental policies: A comparative study of capacity-building , Berlin : Springer .
- Kaufmann, D., Kraay, A. and Mastruzzi, M., 2004. Governance matters 111: Governance indicators for 1996–2002. World Bank Working Papers
- Keefer , P. 2005 . “ DPI2004 database of political institutions: Changes and variable definitions ” . Washington , DC : World Bank .
- Kenworthy , L. 2003 . Quantitative indicators of corporatism . International Journal of Sociology , 33 ( 3 ) : 10 – 44 .
- King , G. , Keohane , R. O. and Verba , S. 1994 . Designing social enquiry: Scientific inference in qualitative research , Princeton , NJ : Princeton University Press .
- Lijphart , A. 1999 . Patterns of democracy: Government forms and performance in thirty-six countries , New Haven , CT : Yale University Press .
- Midlarsky , M. 1998 . Democracy and the environment: An empirical assessment . Journal of Peace Research , 35 ( 3 ) : 341 – 361 .
- Müller-Rommel , F. 2002 . The lifespan and the political performance of green parties in western Europe . Environmental Politics , 11 ( 1 ) : 1 – 17 .
- Neumayer , E. 2002 . Do democracies exhibit stronger environmental commitments?: A cross-country analysis . Journal of Peace Research , 39 ( 2 ) : 139 – 164 .
- Neumayer , E. 2003 . Weak versus strong sustainability: Exploring the limits of two opposing paradigms , Cheltenham : Edward Elgar .
- Ophuls , W. and Boyan , A. S. 1992 . Ecology and the politics of scarcity revisited: The unravelling of the American dream , San Francisco , CA : Freeman .
- Opschoor , J. 2000 . The ecological footprint: Measuring rod or metaphor . Ecological Economics , 32 ( 3 ) : 363 – 365 .
- Pavlinek , P. and Pickles , J. 2000 . Environmental transitions: Transformation and ecological defence in central and eastern Europe , London : Routledge .
- Payne , R. 1995 . Freedom and the environment . Journal of Democracy , 6 ( 1 ) : 41 – 55 .
- Persson , T. and Tabellini , G. 2005 . The economic effects of constitutions , Cambridge : Cambridge University Press .
- Porritt , J. 1984 . Seeing green: The politics of ecology explained , London : Blackwell .
- Przeworski , A. , Alvarez , M. , Cheibub , J. A. and Limongi , F. 1996 . What makes democracies endure . Journal of Democracy , 7 ( 1 ) : 39 – 55 .
- Przeworski , A. and Limongi , F. 1997 . Modernization: Theories and facts . World Politics , 49 ( 2 ) : 155 – 183 .
- Psephos, available online at http://psephos.adam-carr.net, accessed 22 March 2007
- Russett , B. and Oneal , J. R. 2001 . Triangulating peace: Democracy interdependence and international organizations , New York : W.W. Norton .
- Scruggs , L. 2003 . Sustaining abundance: Environmental performance in industrial democracies , Cambridge : Cambridge University Press .
- Sprinz , D. F. and Vaahtoranta , T. 1994 . The interest-based explanation of international environmental policy . International Organization , 48 ( 1 ) : 77 – 105 .
- Stretton , H. 1976 . Capitalism, socialism and the environment , Cambridge : Cambridge University Press .
- Szajkowski, B., 2005. Political parties of the world, 6th edn. London: John Harper
- UNDP (United Nations Development Programme) . 2003 . World resources 2002–2004 , Washington , DC : World Resources Institute .
- Van Kooten , G. C. and Bulte , E. H. 2000 . The ecological footprint: Useful science or politics . Ecological Economics , 32 ( 4 ) : 385 – 389 .
- Wackernagel , M. , Schulz , N. B. , Deumling , D. , Callejas-Linares , A. , Jenkins , M. , Kapos , V. , Monfreda , C. , Loh , J. , Myers , N. , Norgaard , R. and Randers , J. 2002 . Tracking the ecological overshoot of the human economy . Proceedings of the National Academy of Sciences , 99 : 9266 – 9271 .
- Walker , K. J. 1988 . The environmental crisis: A critique of neo-Hobbesian responses . Polity , 21 ( 1 ) : 67 – 81 .
- Ward , H. 2006 . International linkages and environmental sustainability: The effectiveness of the regime and IGO networks . Journal of Peace Research , 43 ( 2 ) : 149 – 166 .
- Weale , A. , Pridham , G. , Cini , M. , Konstandakopulos , D. , Porter , M. and Flynn , B. 2000 . Environmental governance in Europe , Cambridge : Cambridge University Press .
- WCED (World Commission on the Environment and Development) . 1987 . Our common future , Oxford : Oxford University Press .
- World Values Survey, available online at www.worldvaluessurvey.org, accessed 22 March 2007
