
ABSTRACT
Previous research has suggested that corporatist polities tend to enact more ambitious environmental policies than others. Here it is argued that the macro concept of corporatism can be dissected into three components: inclusiveness, consensualism and strength of tripartite organisations. These components of corporatism can be measured at the meso-level of policy networks. It is proposed that inclusiveness and consensualism are related to ambitious climate policy but exclusive tripartite coalitions can be detrimental for the ambitiousness of climate policy. This argument is backed by evidence from policy network surveys in two similar corporatist countries where climate change policies diverge: Sweden, where policies are ambitious, and Finland, where they are less so. It is found that in Sweden the climate change policy network is more consensual and slightly more inclusive, while in Finland tripartite organisations play a strong role.
Introduction
It is frequently argued that corporatism is generally good for the environment. Corporatist polities, it is claimed, tend to enact more ambitious environmental policies than others (for example, Christoff and Eckersley Citation2011). However, divergent voices argue that at least in some cases, corporatism may hinder rather than promote ambitious environmental policy (Dryzek et al. Citation2002).
We suggest that these contradictory arguments can be explained by a tendency in the literature to oversimplify corporatism, treating it either as a dichotomous macro structural variable – a category that a country either fits or not – or a continuum on which all countries can be placed depending on the degree of corporatism. Instead, we suggest that corporatism can be divided into three components: inclusiveness, consensualism and strength of tripartite organisations, and that these components are visible at the meso-level of policy networks. While inclusiveness and consensualism are indeed conducive to ambitious environmental policy, tripartite strength seems to have the opposite effect. Thus, by focusing on the meso-level of policy networks, our analysis takes the debate about corporatism and environmental policy beyond the sometimes contradictory findings of earlier macro comparative research. Our results show that variation not only between but also within political institutions can be significant. Based on this contribution, we suggest that ‘corporatism’ is too abstract a macro level variable to provide insight into the mechanisms of environmental policy outcomes.
We use a classical ‘most similar systems’ research design (Przeworski and Teune Citation1970), comparing Finland and Sweden, two similar countries that diverge in the ambitiousness of their climate policies. Both countries are examples of the Nordic corporatist polity type, and their natural environment and social organisation are in many ways very similar. But Finland’s per capita emissions are double those of Sweden, and climate policy output in Sweden is clearly more ambitious. Thus, while the two countries are similar in their macro-level social structures, we look for differences in their meso-level policy networks. Our main finding, as our analytical framework leads us to expect, is that in Sweden the climate change policy network is more inclusive and slightly more consensual, while in Finland tripartite organisations play a stronger role.
Our contribution is organised as follows. We begin by reviewing the literature on corporatism and environmental policy, drawing on the literature to formulate our analytical framework and hypotheses. We then present the case countries, summarising their similarities and also how their climate change policies differ. We then present the data, our network analytical methods, and results, before concluding with a discussion of the implications of our findings.
Analytical framework and hypotheses
Most literature on the relationship between corporatism and environmental policy argues that corporatist polities are pioneers of environmental policymaking (for reviews of relevant literature, see Fiorino Citation2011, Koch and Fritz Citation2014). For example, Liefferink et al. (Citation2009) found that corporatist institutional structures are favourable to the advancement of environmental regulation. Wälti (Citation2004) showed that corporatist countries perform better in reducing NO2 and SO2 pollution. Scruggs (Citation2003) argued that countries characterised by ‘neo-corporatist institutions have enjoyed better environmental performance than countries where economic groups are less comprehensively organised and policy making is less consensual’ (Scruggs Citation2003, p. 123).
Arguments explaining why corporatist countries fare better in environmental policy refer to characteristics often associated with the idea of corporatism, including broad participation in decision making, dialogue, and a consensual style of policy making. Jacob and Volkery (Citation2006, p. 84) argued that the environmental performance of corporatist countries is due to the ‘integrative capacity of a country, i.e. a style of governance that does not restrict participation to general elections but organises it in a broad and consensual way.’ Jänicke (Citation2005) came to similar conclusions in his framework for trendsetters in environmental policy. He sees a policy style centred on dialogue and consensus as one of the conditions for successful environmental policy.
Christoff and Eckersley (Citation2011) argued that the organisational structure of corporatist polities ensures that a small group of players can consensually work towards a common goal. Thus, implementation of policies that serve broader interests and overcome problems of collective action is made possible (see also Matthews Citation2001). Theories of ecological modernisation assume that ecological protection and business interests are not necessarily irreconcilable. It is possible that corporatist institutions facilitate ecological modernisation by bringing together diverse actors, thereby fostering a common understanding of the importance of environmental issues (cf. Zannakis Citation2009). Furthermore, it is sometimes suggested that corporatism reduces veto points where powerful interest groups can block climate policy initiatives (Karapin Citation2016, p. 54).
There are, however, divergent voices. Koch and Fritz (Citation2014) found that corporatist social-democratic welfare regimes are no better than liberal ones in introducing green dimensions into their policies. Karapin (Citation2012) argued that corporatist institutions may even be harmful for the environment if they institutionalise the power of producer groups who favour economic growth over environmental protection. Dryzek et al. (Citation2002) go so far as to argue that the Nordic variant of corporatism (they only analyse Norway and generalise from this) is bad for the environment because it tends to lead to co-optation of environmental non-governmental organisations (NGOs) by the government.
As noted above, we argue that these contradictory assessments of the relationship of corporatism and environmental protection can result from treating corporatism as a unitary, macro-structural variable (where a country is either corporatist or not) or as a continuum on which all countries can be placed according to their corporatist characteristics (Lijphart Citation2012). Such analyses lump together all features of corporatism without considering the possibility that some of these features may strengthen environmental policy performance while others hinder it. We argue that it is useful to distinguish, in particular, between consensualism, inclusiveness and strength of tripartite organisations.
Consensualism, inclusiveness and tripartite strength are variables that can be difficult to measure at the macro-level. We propose to measure consensualism, inclusiveness and tripartite strength as features of meso-level social organisation. This means that while these characteristics might be difficult to measure as countries’ macro properties, they are reflected and visible in how policy networks in the climate change policy domain are organised. Following Jepperson and Meyer (Citation2011), when attempts at macro-level explanations seem too abstract to provide convincing answers, it makes sense to look for explanations at the meso-level of policy networks. Our objective here is therefore to add a new dimension to the mostly macro-comparative literature on corporatism and environmental policy by using meso-level concepts, methods, and materials from the field of policy network research.
Below, we draw four hypotheses concerning the differences of climate change policy networks in Finland and Sweden, combining ideas from the literature on corporatism and environmental policy with concepts from policy network analysis. The hypotheses concern the manifestations of the three components of corporatism we have outlined above – inclusiveness, consensualism and tripartite strength – at the policy network level. First, corporatist polities are inclusive. In this polity type, NGOs and the state are closely linked. The Nordic model, in particular, is characterised by the state traditionally being tightly integrated with civil society (Rothstein and Trägårdh Citation2007). The political opportunity structure is usually very open in the Nordic model (Ylä-Anttila Citation2010).
At the level of policy networks, we expect corporatist inclusiveness to manifest in relatively equal power distribution in the network (cf. Knoke Citation1994, Schneider Citation2015) and relatively equal access of different organisational sectors to governmental decision-making processes. Equal access provides no guarantee that power is distributed equally, but makes it more likely. Indeed, a central feature of corporatist polities is that they do not concentrate all power in the hands of the executive. Furthermore, it is likely that a balance of power between environmental organisations, business and labour interests would prevent economic policy objectives from overriding ecological ones and encourage responses aiming to reconcile both perspectives. If this assumption holds true, the more ambitious climate policy of Sweden would be associated with the Swedish policy network being more inclusive than the Finnish network. Our inclusiveness hypothesis, then, states:
H1: The Swedish policy network is more inclusive than the Finnish policy network regarding the distribution of influence between organisations and access to decision-making processes.
Second, corporatist polities are consensual. The inclusive nature of the political system, the self-understanding centred on closeness between state and civil society, and the extensive consultation processes organised to support policymaking supposedly translate, in the end, into a broad-based consensus on the course of action to be taken (Alapuro Citation2005, Ylä-Anttila Citation2010, Luhtakallio Citation2012). Indeed, consensualism is the feature of corporatism most often-mentioned by those who argue that corporatism strengthens environmental policymaking. For example, Jacob and Volkery (Citation2006) argue that corporatism entails an integrative style of governance. If it is true that consensualism is good for ambitious environmental policy, the more ambitious country – Sweden – should be more consensual. Our consensualism hypothesis, then, states that:
H2: There is a stronger consensus on climate change policy in the Swedish policy network than in the Finnish policy network.
Third, in corporatist polities there is a strong tripartite bargaining system made up of trade unions, business peak organisations, and state organisations. This bargaining system extends beyond collective bargaining over wages into areas such as environmental policy. Karapin (Citation2012) argues that this characteristic of corporatism may not be good for the environment. Echoing the classic Treadmill of Production theory (Schnaiberg and Gould Citation1994), he observes that corporatist institutions may be harmful for environmental quality if producer groups’ power is institutionalised and favours an economic growth agenda at the expense of environmental concerns (Karapin Citation2012, p. 48; see also Hukkinen Citation1995). If the strength of tripartite organisations is indeed a hindrance to ambitious environmental performance, we expect to find these organisations to be stronger in the less well performing of the two countries – Finland. Thus, our tripartite strength hypothesis states:
H3: Industry and labour peak organisations are more influential in the Finnish than in the Swedish policy network.
Finally, it may be that the strength of tripartite organisations is a function of their alliances with other organisations in the policy network. One of the most prominent theoretical approaches within the policy network literature, the Advocacy Coalition Framework (ACF), argues that it is not the influence of individual organisations that is crucial in determining policy output but, rather, coalitions of like-minded, collaborating organisations. From this perspective, differences in policy between two countries follow from differences in the opinions, resources and network positions of competing advocacy coalitions (Sabatier Citation1998, Kriesi and Jegen Citation2001, p. 252).Footnote1
In the case of climate change policymaking, this would mean that the tripartite organisations prioritising economic growth over the environment are not only influential, but also able to assemble coalitions that include influential allies. Such coalitions might include governmental organisations and political parties, and these connections to the state are what give tripartite organisations their power. If it is true that the strength of network coalitions led by tripartite organisations is an important hindrance to ambitious environmental policy, we should expect to find stronger coalitions of this type in the less ambitious of the two countries we study – Finland. Thus, our coalition hypothesis states:
H4: The advocacy coalitions involving industry and labour peak organisations are more influential and better connected to the state in the Finnish network than in the Swedish network.
Case countries
In many ways, our case countries, Finland and Sweden, are similar: small Nordic states with cold climates, advanced postindustrial economies, and consensual corporatist political systems. Lijphart’s (Citation2012) ranking of countries, which is based on their interest group pluralism versus corporatism, places Finland the fifth and Sweden the most corporatist country of the 36 countries compared. The political institutions found in both countries help define Nordic corporatism, which is characterised by tripartite agreements, strong peak organisations and multi-party polities (Lane and Ersson Citation2002). In Esping-Andersen’s (Citation1990) well-known classification of welfare regimes, both countries are classified as social-democratic. Besides embodying corporatist institutions, Finland and Sweden are both small countries with relatively open economies.
In other words, from a macro-comparative perspective, both formal institutional structures and political cultures are fairly similar. This institutional similarity is partly due to a long common history–until 1809 Finland was a part of the Kingdom of Sweden. The two countries’ natural and human environments are also similar. Cold climates require considerable energy for heating and this is equally true for both countries. Low population density requires much energy for transport, and this also characterises both countries almost equally: Finland has 18 inhabitants per square kilometer; Sweden has 24 (compared, for instance, to Germany at 232 and South Korea at 518). The greater share of both countries’ populations resides in the south.
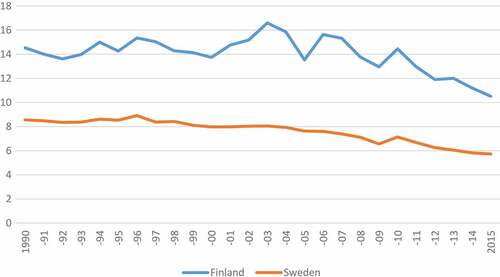
Finland and Sweden’s greenhouse gas (GHG) emissions differ considerably, however. Finland’s per capita emissions have been around double the level of Swedish emissions for the past two decades. Sweden’s per capita emissions have declined steadily since 1990 (reference year for the Kyoto Protocol) as shown in . Finland’s emissions have recently dropped as well, but largely due to a severe economic recession. Finland’s gross domestic product (GDP) fell dramatically by 8.3% in 2008, with negative or zero growth rates persisting through 2012–2015 (Statistics Finland Citation2017a). The drop in the Swedish GDP was less severe, (−0.7% in 2008 and −5.1% in 2009), and the rebound was quick: the economy grew 3.8% in 2015 (OECD Citation2017). Thus, the reduction in Finnish emissions seen in between 2012 and 2015 was probably a result of a shrinking economy, while in Sweden emissions were reduced despite strong economic growth. Finland’s per capita emissions are still almost double those of Sweden. With the Finnish economy recovering (in 2017 GDP rose by 2.8%), Finland’s emission levels are on the rise again.Footnote2
Figure 1. GHG emissions (metric tons of CO2 equivalent), per capita in Finland and Sweden 1990–2015.
Data source: European Environment Agency (2017).
Important structural influences on emissions are built into the respective countries’ energy infrastructures and economic base, and while these are strongly influenced by policy choices, they involve sunk costs that can result in long time lags for realising CO2 reductions. Three key factors affect the extent to which policy has influenced the energy mix, and thereby GHG emissions: energy production and use; the types of domestically available energy sources and degree to which each country depends on them; underlying factors contributing to ‘energy intensity’, which very roughly speaking, is an inverse measure of energy efficiency (IEA Citation2014).
For example, according to the International Energy Agency’s Energy System Overview (2016), over half (57%) of Sweden’s 155 TWh of electricity was generated using renewables, with hydropower contributing 40% of the total. Nuclear provided most of the rest (41%), with oil, gas and coal accounting for a tiny 2.4%. Finland’s electricity production, totaling less than half of Sweden’s at 68.8 TWh, was generated with renewables accounting for 45%, a far smaller share for hydropower (21%), and a larger share produced by biofuels (10%). Much of the difference in emissions can be traced to Finland’s continued use of coal and oil for electricity generation. As in Sweden, oil and gas generate very little of Finland’s electricity, but coal generation accounts for 11%.
What is especially notable is that neither country has any meaningful domestic coal/gas/oil reserves. This means that both countries’ fossil fuel supplies must be imported, contributing little to energy security. Sweden imports 42% of its crude oil from the Russian Federation (and 30% from neighbouring Norway), and all of its natural gas from Denmark. Over half of Sweden’s modest coal imports come from Australia (54%). Finland imports 88% of its crude oil, all of its natural gas, and 64% of its coal from the Russian Federation.
An important practical implication of the absence of domestic fossil fuel production is that the kind of internal influence of fossil fuel producers on policy found elsewhere, such as in the United States (where coal currently accounts for over 40% of electricity production), is absent – i.e. not part of domestic policy networks. Economic actors that use coal would, however, be part of those networks. The economic structure of the two countries could therefore help explain policy differences and emissions trajectories. For example, Karapin (Citation2016, p. 56) has argued that a large service sector in relation to manufacturing can be ‘beneficial for climate policy since service-sector firms have lower costs of adjustment and are less exposed to international competition than manufacturing firms’.
Here again, the profiles of the countries are fairly similar. Both Swedish and Finnish economies are export-based and differences in the proportion of manufacturing and services have been relatively minor in recent years. In 2016, the GDP share of all industrial activity was 27% in both countries, while services accounted for 71% in Finland and 73% in Sweden (Statista Citation2018a, Citation2018b). Differences in these proportions have diminished over time and while it is possible that future industrial activity could account for an increasing share as Finland recovers from its recession, the differences would still remain relatively minor. It is unlikely that the Swedish economy being slightly more service-based would explain the difference in performance in energy and climate policy. GHG emissions from fuel combustion in the transport sector have fallen in Sweden (from 21.1 in million tons of CO2 equivalent in 2005 to 17.9 in 2014). The figures are lower in Finland and also seem to be declining (from 13.0 in million tons of CO2 equivalent in 2005 to 11.1 in 2014). However, Sweden’s population is almost twice as large and, instead of a clear declining trend, Finland’s figures appear to be fluctuating (see Statista Citation2018c, Citation2018d).
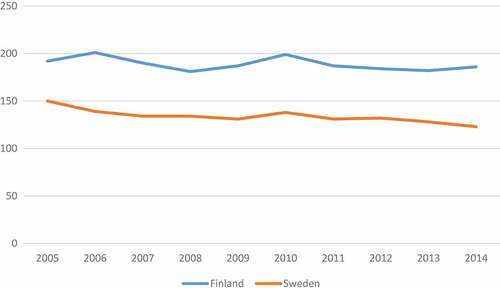
The Finnish economy is also consistently more energy intensive (see ), although energy intensity dropped slightly after 2010 due to an economic recession that hit the export industry particularly hard. Moreover, Finland’s domestic material consumption is more dependent on fossil energy materials. According to Eurostat, in 2015 Finland and Sweden consumed 3.5 and 1.7 tonnes of fossil energy materials per capita respectively. The large differences in energy intensity between the two countries can probably be explained more by fuel mix and Sweden’s more decisive move away from fossil fuels than by the nature of economic activity.
Figure 2. Energy intensity of the Finnish and Swedish economies, 2005–14.
Kg of oil equivalent per 1 000 EUR of GDP.Data source: Eurostat (Citation2016): Energy, transport and environment indicators.
It has been suggested that the price of electricity is seen in Finland as an issue of national competitiveness and that this concern has tended to outweigh climate change mitigation as an issue (Teräväinen Citation2012). However, electricity prices are similar to those in Sweden, especially for non-household consumers (Eurostat Citation2017). With the price of electricity no lower in Finland than in Sweden, it could still be that keeping electricity prices down is seen as a higher priority in Finland.
Beyond simple emission trajectories, Sweden is considered the more ambitious country of the two on climate policy. The Germanwatch Climate Change Performance Index, which evaluates climate policy performance, has always placed Sweden at the top, whereas Finland consistently does much worse (Germanwatch Citation2017). On a ten-year average (2008–2017), Sweden was the second best performer in the world, while Finland was 31st.
In the process of defining the EU’s total GHG reduction commitments and the burden-sharing within the EU, Sweden has been a forerunner, while Finland has often dragged its feet (Tirkkonen Citation2000, Teräväinen Citation2012). When preparing for the Kyoto Protocol, arguments around the economy and national interest dominated in Finland, with industry organisations especially claiming that proposed Kyoto targets presented a major threat to economic growth and national competitiveness (Tirkkonen Citation2000, p. 117). Finland was eventually persuaded by international pressure to accept the Kyoto and EU targets, and both countries were among the first in the world to implement national carbon taxes. In Finland, however, energy-intensive industries soon managed to secure exemptions from these taxes (Tamminen et al. Citation2016).
In 2017 Sweden set itself a target of completely phasing out its GHG emissions by 2045 (The Independent Citation2017). This target, more ambitious than in any other developed nation, is part of a law that was drawn up by a cross-party committee. The current Finnish Minister of Environment has proposed that Finland should also aim to become carbon neutral by 2045. However, this is only a non-binding proposal and it assumes that emission levels might be balanced (rather than phased out) by using forests as carbon sinks (Valtioneuvosto Citation2017).
The environmental policy literature consistently lists Sweden as a pioneer in environmental issues (Sarasini Citation2009) and one of the few countries implementing effective climate policies (Karapin Citation2016, p. 2). Yet Finland has been labeled ‘a failing eco-state’ due to its ecological performance, particularly in the policy domain of climate change (Koch and Fritz Citation2014). Overall, the data on emissions and policy outputs, and expert academic assessments all point to a clear difference in the levels of ambition between the climate policies of the two countries.
Data and methods
Our data is derived from network surveys conducted in 2014 in Finland and in 2015 in Sweden. The data were collected as a part of the Comparing Climate Change Policy Networks research project (see compon.org). The respondents are representatives of all major organisations interested in climate policy in these countries. The response rate was 83% for Finland and 66% for Sweden, with 146 responses in all.
A preliminary list of respondent organisations was compiled based on previous research and knowledge of climate policy in each country. It was ensured that organisations from different sectors of society (e.g., business, government, and NGOs) would be represented and that the respondent organisations would be fairly similar in both countries. The original lists of respondents were presented to experts on climate policy who suggested some additions and omissions. The final list included 96 organisations in Finland and 104 organisations in Sweden. The respondents were first contacted by phone and if they agreed to participate, a link to an online questionnaire was sent by email.
Our measures of the three different features of corporatism, derived from the survey data, are as follows.
Inclusiveness
To test hypothesis 1, our first measure of the inclusiveness of the policy networks is the distribution of influence among the organisations belonging to them. Our questionnaire included a roster of all organisations in the network, and respondents were asked to check off organisations they considered influential in climate change policymaking. The influence score produced for each organisation was normalised to a scale ranging from 0 to 1. The power structure perspective suggests that the distribution of influential positions in a policy network is a measure of the concentration of power in a political system (Knoke Citation1994, Schneider Citation2015), and more concentration equals less inclusiveness. We measure the concentration or the dispersion of power with the Lorenz curve, which is usually used by economists to measure levels of (in)equality of wealth or income. In this case, we are thus measuring the concentration of power based on our respondents’ assessments of influence (cf. Schneider Citation2015).
Our second measure of inclusiveness is access to policymaking processes. The measure is self-reported, based on the answer to the question ‘How often does your organisation take part in policymaking, such as formal testimony at hearings, participation in government advisory committees, or drafting legislation proposals or text?’, measured on a scale ranging from 1 to 3 (never/sometimes/often). The more equally this access is distributed between different organisation types, the more inclusive the policy network should be. For example, if all NGOs lacked access, we would interpret this finding as an indication of exclusiveness.
Consensualism
To test hypothesis 2, our measure of consensualism is based on a composite variable measuring pro-climate beliefs of the organisations in the policy network. Here, ‘pro-climate’ refers to indicating that climate change policy should be prioritised on a level comparable to economic growth. The composite variable consists of six items measuring pro-climate beliefs. Based on inter-item correlation tables and a series of exploratory factor analyses of 21 belief variables, we identified six strongly correlated items that constituted the final scale. The items ranged from the validity of climate science to desirability of governmental mitigation efforts and prioritisation of mitigation over economic growth. We calculated the simple sum of all items (as opposed to summing by factor scores) to maximise transparency of interpretation and scaled the final composite variable so that values ranged from 0 to 1 to maximize readability. Cronbach’s alpha for the composite variable is 0.875 for Finland and 0.828 for Sweden (see Appendix 1). The higher the standard deviation of this variable in the network, the less consensual we take the network to be, because high standard deviation indicates lack of agreement.
Tripartite strength
To test hypothesis 3, our first measure of the strength of tripartite collective bargaining organisations is the influence scores outlined above (see inclusiveness). The higher the mean score for business peak organisations and trade unions, the stronger the influence of tripartite organisations in the policy network. Second, we compare the influence of tripartite organisations and NGOs to investigate the proposition that it may not be the absolute strength of tripartite organisations but, rather, their strength in relation to environmental organisations that leads to poor environmental policy performance. Thus, we define the influence gap between NGOs and tripartite organisations as the difference between the mean influence of NGOs and of tripartite organisations in the policy network. Because both items are measured on a scale from 0 to 1, the influence gap can range between –1 (all-powerful NGOs and tripartite organisations with no power) and +1 (all-powerful tripartite organisations and NGOs with no power).
Finally, to test hypothesis 4, we analyse the coalition structures of the policy networks in both countries. Our survey included a question about who the respondents collaborate with on climate policy at the organisational level. Respondents were presented with rosters that listed all the respondent organisations of the surveys – that is, the major organisations in both countries having a stake in climate policy issues. From these lists, respondents were asked to indicate organisations they regularly collaborate with.
The collaboration networks were symmetrised using the maximum criterion, which makes all ties reciprocal. Thus, a collaborative tie exists if it is reported by ego and/or alter.Footnote3 This symmetrisation enables us to include non-respondent nodes in the network; otherwise these nodes would have to be excluded because network analysis requires that matrices are square. In order to find coalitions, the collaboration network in both countries was split into subgroups using the factions routine in UCInet, which fits the nodes into subgroups that have highest possible internal density. The number of subgroups is decided by assessing the proportion of correctness that shows which solution has the highest goodness of fit. The proportion of correctness is a measure of the total number of ‘errors,’ which refers to absent within-faction and present between-faction ties. The factions routine needs to be run several times in order to see whether the factions are stable or whether there are nodes that could plausibly be placed in two or more factions. There were some isolates in the Swedish data, and these were excluded from the analysis of subgroups because isolates are by definition outsiders in relation to any subgroupings.
In addition to the collaboration relationships, we also measure the internal belief homophily of coalitions by looking at the standard deviations of the above-mentioned composite scale on climate change beliefs within coalitions.
Results
Inclusiveness
Our first hypothesis postulated that the Swedish policy network is more inclusive than the Finnish policy network regarding the distribution of influence and access to policymaking. The Lorenz curves, which measure the distribution of influence in both countries, are shown in .
Figure 3. The Lorenz curves for influence in Finland and Sweden.
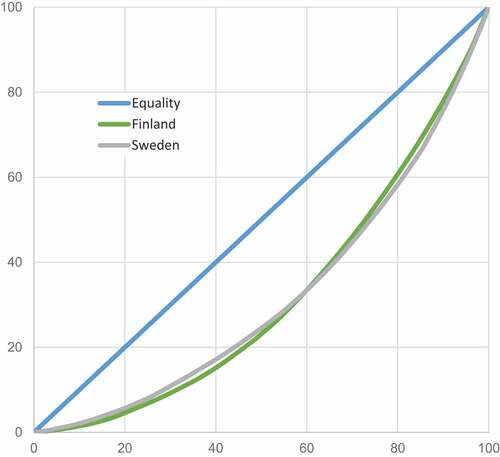
The curves in show the distribution of influence as cumulative percentages. In a completely equal policy network, the distributions would follow the equality line. The figure shows curves differing from the equality line in both policy networks, which is unsurprising because even a consensual polity is unlikely to distribute power completely equally. We postulated that power in the Finnish network would be more concentrated than in Sweden. However, the curves follow almost identical trajectories, showing that concentration is similar in both cases. Therefore, regarding the distribution of influence, our inclusiveness hypothesis is rejected because the policy networks in both countries are equally inclusive.
Our second inclusiveness measure, which compares access to policymaking, displays differences per country. We compare the level of access that trade unions, business peak organisations, and NGOs have on a scale of 1 to 3. We are not reporting figures for governmental actors for political access because governmental organisations should have access by definition. Moreover, we are mainly interested in seeing how NGOs manage compared to tripartite actors. shows that NGOs fare relatively well in both countries. Finland’s score is actually higher for NGOs than Sweden’s (2.25 compared to 2.00). More interesting, however, is that in Sweden NGOs score higher than either trade unions or business peaks, whereas in Finland, NGOs score lower than business peaks or trade unions. Thus, Swedish NGOs seem to have better access into official policymaking than either trade unions or business peak organisations, with the reverse true in Finland.
Table 1. Inclusiveness and influence in Finland and Sweden.
Overall, the evidence concerning inclusion seems inconclusive because there are no differences in the distribution of influence between Finland and Sweden, but NGOs are more integrated into official policymaking in Sweden than in Finland. However, this fact concerning integration only holds if one compares NGOs with unions and business peaks.Footnote4
Consensualism
Our second hypothesis postulated that the Swedish policy network would be more consensual. First, analysis of the pro-mitigation beliefs of networks in both countries shows that the Swedish network is slightly more pro-climate. On a scale from 0 to 1, where higher figures indicate pro-mitigation beliefs, the mean score of the Swedish network is 0.79, while in Finland the corresponding figure is 0.75. Focusing on the extent of consensus reveals that Sweden is more consensual, but only slightly. Standard deviation of pro-climate beliefs is 0.17 in Sweden and 0.21 in Finland.
However, when we zoom in on the consensualism of pro-climate beliefs among the 15 most influential organisations in each country’s policy network, the results change somewhat. These organisations are more supportive of pro-mitigation policies in Sweden (mean 0.73) than in Finland (0.64). Furthermore, consensus on pro-mitigation beliefs among them – measured by standard deviations of the composite variable – is clearly higher in Sweden (0.15) than in Finland (0.29) (the closer to zero the standard deviation, the more consensual the network). Thus, the relatively minor differences between Finland and Sweden in both pro-mitigation beliefs and the extent of consensus become more pronounced when examining the 15 most influential organisations. Overall, our second hypothesis is not fully rejected since differences between the two countries exist.
Tripartite strength
Our third hypothesis posited that tripartite collective bargaining organisations are more influential in the Finnish policy network than the Swedish policy network. This does indeed seem to be the case, as illustrates. Mean influence scores for trade unions and business peak organisations are higher than for NGOs in Finland. In Sweden, NGOs are slightly less influential than business peaks but more influential than unions. Especially notable is the score of business peaks in Finland: it is highest of all organisational sectors. In Sweden, business peaks are also influential, but the difference compared with NGOs is nowhere near as high.
Turning next to the influence gap between tripartite organisations and NGOs, this measure can range between −1 (all-powerful NGOs, no tripartite organisations power) and +1 (all-powerful tripartite organisations, no NGO power). The result shows a positive figure for Finland and negative for Sweden (see ). Thus, Finnish tripartite actors are more powerful than NGOs, with the opposite true in Sweden, which aligns with our hypothesis.
Table 2. Summary of main results.
Testing our fourth hypothesis through network analysis provides more support for this argument. Hypothesis 4 posited that advocacy coalitions involving tripartite organisations are more influential and better connected to the state in the Finnish network than in the Swedish network. The first step in our coalition analysis finds that the Finnish collaboration network is more clustered than Sweden’s. Overall densities indicate that in Finland, 26% of all possible ties are present, compared to 11% in Sweden. The weighted overall clustering coefficients for Finland and Sweden were 0.43 and 0.27, respectively, indicating that the Finnish network is more clustered into collaborating subgroups. To establish the number of coalitions, we make the ideal-typical assumption that the network consists of a given set of clusters that are internally dense, but which have no external connections. The factions algorithm fits the nodes into subgroups based on internal density.
The best-fitting solution for Finland was one with four subgroups. The proportion of correctness of this solution was relatively high, at 0.74. We find three subgroups with high within-density and a group of outsiders that are not connected with each other (and thus do not constitute a coalition). However, the factions are not stable which means that there are organisations whose placement keeps changing with reruns of the algorithm. Many of these are peripheral in the network but some could be considered brokers that broker relations between actual coalitions. For further analyses, we removed these organizations and the faction of outsiders and were left with a core of 53 organisations.Footnote5 We think these actors constitute actual coalitions because they mainly collaborate with each other.
In line with the Advocacy Coalition Framework (ACF), the coalitions are constituted not only by collaboration ties but also by similarity of beliefs, as measured by our pro-mitigation beliefs composite variable. Based on the constituency of the three subgroups and the policy core beliefs of these organisations, we judge that these three subgroups are indeed coalitions (see also Gronow & Ylä-Anttila Citation2016). We label them Tripartite, Government and Research, and NGO Coalition. Their within-densities are high: 0.66 (Tripartite), 0.68 (Government and Research), and 0.65 (NGO). All of these densities are much higher than the average density of the whole network (0.26). The coalitions therefore exhibit dense collaboration ties.
The differences in the beliefs of the three coalitions are statistically significant (one-way ANOVA F = 14,36, p = 0,000). The Tripartite Coalition is the least ecologically minded (mean 0.57), the NGO coalition the most (0.97). The Government and Research Coalition falls between them (0.74). In Finland, the most influential organisations are not only less supportive of ambitious climate change policy, but are also members of the Tripartite Coalition. Interestingly, both from the point of view of the ACF theory and of policy outcomes, this coalition is no mere business lobby group. Instead, it groups together business peak organisations, trade unions, and two big political parties (right and centre). This coalition is the most influential: 0.42 compared to 0.15 of the NGO coalition as measured by reputational power on a scale from 0 to 1. In addition, the Tripartite Coalition is also well connected to the government. This can be seen in its connections to the Government and Research Coalition: it has more collaboration relationships across coalition lines (inter-coalition density 0.24) than the Environment Coalition (inter-coalition density 0.12).
For Sweden, it is much more difficult to find subgroups that could be considered coalitions. A two-faction solution is relatively stable; most of the organisations are delegated to only one faction with several reruns of the algorithm. However, the proportion of correctness of this solution is very low at 0.56. In addition, ACF argues that the coalitions are also constituted by similarity of beliefs and there are almost no differences in the pro-mitigation beliefs between the two factions (measured by our composite variable). Models that add more factions (we experimented with up to eight factions) produce better results regarding proportion of correctness but they are very unstable. Theoretically it makes little sense to argue that there are eight coalitions with distinctly different beliefs about climate change politics. Indeed, ACF maintains that there are usually two to three coalitions in a policy domain. Overall, we conclude that the lack of belief congruence within factions and stable solutions indicates that there seem to be no proper coalitions in the Swedish policy network.
Summarising our results (see ), we find that the concentration of power is almost identical in both countries and that Swedish NGOs fare better than their Finnish colleagues in comparison with trade unions and business peaks. We also find that the Swedish network is slightly more pro-mitigation than its Finnish counterpart. Moreover, Sweden is also more consensual in beliefs concerning climate change mitigation, but this is a close call. However, the 15 most influential organisations in Sweden are more pro-mitigation, with consensus on these issues more pronounced. Thus, general consensualism is not higher in the Swedish network, but consensualism at the level of influential actors can make a difference. Finally, we find that in Finland, NGOs are less influential than tripartite organisations, whereas in Sweden the reverse is true (the so called influence gap). Only in Finland can we find subgroups or coalitions and also a coalition of which both tripartite organisations are part. Thus, in Finland the tripartite organisations are influential and occupy important positions in a resourceful coalition well linked to the government. This contrasts with Sweden and appears as an important difference in the climate policy networks between the two countries.
Conclusion
We set out to scrutinise the claim that corporatist polities tend to enact more ambitious environmental policies than others. Using a similar systems research design, we compared Finland and Sweden, two similar corporatist polities where climate change policy differs – Sweden is clearly the more ambitious of the two. Instead of treating ‘the corporatist polity type’ as a macro variable, the prevalence of which can be measured by a single index in a country, we differentiated between three key aspects of corporatism: inclusiveness, consensualism, and the strength of tripartite collective bargaining organisations. We have focused on each of these issues at the meso-structural level of policy networks in order to find the ways in which each aspect is related to climate policy.
Our findings indicate that one can identify particular features of corporatism at the level of policy networks that act as an elaboration of the connection between corporatism and environmental policy – climate policy in this case. Even if the distribution of power in the network is roughly equal, assessing the political access of NGOs compared with tripartite actors shows different trajectories. Furthermore, consensualism of the whole network can be too crude a measure, but if many influential actors are in favor of ambitious climate policy and the network in general more or less agrees on this point, then more ambitious policy is a probable result, as the Swedish case shows. Furthermore, we suspect that tripartite connectivity can be an obstacle for such policy if tripartite actors end up in the same political coalition, which excludes NGOs.
A shortcoming of our quantitative policy network approach is the relatively scant attention it pays to the role of meaning. We have analysed pro-mitigation beliefs of the policy networks but there are other, historical reasons for the observed policy differences having to do with meaning-making. For instance, Sweden’s highly international and pioneering role in climate science probably has an influence on the importance that policy actors ascribe to climate change (Zannakis Citation2009).
One could make the objection that our results simply reflect a more energy intensive Finnish economy. Even if this were the case, our results still show meso-level factors to which corporatism gives rise in combination with an energy-intensive economy. Furthermore, we suspect that once certain meso-level structural features are in place (e.g. an influential tripartite coalition), they exert a semi-independent causal force on future policy. Longitudinal data collection is a prerequisite for unveiling such dynamics, and the current cross-sectional design is a weakness of our analysis. By disentangling the time dynamics, a longitudinal design would allow firmer conclusions about causes and effects to be drawn. However, like the present study, most policy network research is cross-sectional due to difficulties of obtaining longitudinal policy network data.
Nevertheless, we have shown that variation within political institutions (e.g. corporatism) can be as important as variation between institutions when it comes to climate policy. This makes it worthwhile to analyse the nature of corporatism in greater detail – as we have done. One of the implications of our findings for future research is the replication of the research setting in other corporatist countries. It would be especially interesting to see what kind of dynamics of consensualism, inclusiveness and tripartite strength can be found in non-Nordic corporatist countries (e.g. Switzerland).
Disclosure statement
No potential conflict of interest was reported by the authors.
Additional information
Funding
Notes
1. Policy network analysis is often more interested in the exchange of resources than the Advocacy Coalition Framework (ACF) which sees the role of policy-related beliefs as essential. However, we tend to think of the ACF and policy network analysis as complementary perspectives.
2. GHG emissions grew in Finland by as much as 6% in 2016 (Statistics Finland Citation2017b). Swedish emission levels were also on the rise, growing around 3.5%, perhaps as a sign of continued economic growth (Statistics Sweden Citation2017). This is still much less than in Finland (with similar GDP growth rates).
3. In Finland, two respondents reported that they collaborate with almost all the 96 listed organisations. These responses deviated so much from the others (and for the most part their ties were not reciprocated by alters) that these organisations’ ties were symmetrised using the minimum criterion, which includes only reciprocal ties.
4. The numbers of organisations are small in each category, so one should be cautious when interpreting these comparisons.
5. As a robustness check, we also performed all analyses without removing the possible broker organizations. We did this by randomly assigning the brokers to the nearest factions. This does not change the main results. However, running the analyses with the smaller core group tends to amplify the differences between coalitions (e.g. differences in policy core beliefs). We take this result to indicate that the organizations belonging to the core group are indeed the ones that represent actual coalitions.
Related Research Data
References
- Alapuro, R., 2005. Associations and contention in France and Finland: constructing the society and describing the society. Scandinavian Political Studies, (28), 377–399. doi:10.1111/j.1467-9477.2005.00137.x
- Christoff, P. and Eckersley, R., 2011. Comparing state responses. In: J.S. Dryzek, R.B. Norgaard, and D. Scholsberg, eds. The Oxford handbook of climate change and society. Oxford: Oxford University Press, 431–448.
- Dryzek, J.S., et al., 2002. Environmental transformation of the state: the USA, Norway, Germany, and the UK. Political Studies, 50 (4), 659–682. doi:10.1111/1467-9248.00001
- Esping-Andersen, G., 1990. The three worlds of welfare capitalism. Cambridge: Polity Press.
- Eurostat, 2016. Energy, transport and environment indicators. http://ec.europa.eu/eurostat/web/products-statistical-books/-/KS-DK-16-001 (accessed 1 September 2017
- Eurostat, 2017. Electricity price statistics. http://ec.europa.eu/eurostat/statistics-explained/index.php/Electricity_price_statistics (accessed 10 January 2018
- Fiorino, D.J., 2011. Explaining national environmental performance: approaches, evidence, and implications. Policy Sciences, 44 (4), 367–389. doi:10.1007/s11077-011-9140-8
- Germanwatch, 2017. The Climate Performance Index 2017. https://germanwatch.org/en/13042 (accessed 29 August 2017).
- Gronow, A. and Ylä‐Anttila, T., 2016. Cooptation of ENGOs or treadmill of production? Advocacy coalitions and climate change policy in Finland. Policy Studies Journal. doi:10.1111/psj.12185
- Hukkinen, J., 1995. Corporatism as an impediment to ecological sustenance: the case of Finnish waste management. Ecological Economics, 15 (1), 59–75. doi:10.1016/0921-8009(95)00019-6
- IEA, 2014. World energy outlook 2014. International Energy Agency. https://www.iea.org/newsroom/news/2014/november/world-energy-outlook-2014.html (accessed 10 January 2018
- The Independent, 2017. Sweden pledges to reach net-zero carbon emissions by 2045. 17 June. http://www.independent.co.uk/news/sweden-greenhouse-emissions-latest-2045-parliament-climate-act-donald-trump-paris-agreement-a7794686.html (accessed 25 August 2017
- Jacob, K. and Volkery, A., FFU Report 01/2006, 2006. Modelling capacities for environmental policy-making in global environmental politics. In: M. Jänicke and K. Jacob, eds. Environmental governance in global perspective. Freie Universität Berlin, 67–94.
- Jänicke, M., 2005. Trend setters in environmental policy. European Environment, 15 (2), 129–142. doi:10.1002/eet.375
- Jepperson, R. and Meyer, J.W., 2011. Multiple levels of analysis and the limitations of methodological individualisms. Sociological Theory, 29 (1), 54–73. doi:10.1111/j.1467-9558.2010.01387.x
- Karapin, R., 2012. Explaining success and failure in climate policies: developing theory through German case studies. Comparative Politics, 45 (1), 46–68. doi:10.5129/001041512802822879
- Karapin, R., 2016. Political opportunities for climate policy: California, New York, and the federal government. New York: Cambridge University Press.
- Knoke, D., 1994. Political networks: the structural perspective. Cambridge: Cambridge University Press.
- Koch, M. and Fritz, M., 2014. Building the eco-social state: do welfare regimes matter? Journal of Social Policy, 43 (4), 679–703. doi:10.1017/S004727941400035X
- Kriesi, H. and Jegen, M., 2001. The Swiss energy policy elite: the actor constellation of a policy domain in transition. European Journal of Political Research, 39 (2), 251–287. doi:10.1111/ejpr.2001.39.issue-2
- Lane, J.-E. and Ersson, S., 2002. The Nordic Countries. Contention, compromise and corporatism. In: J.M. Colomer, ed. Political institutions in Europe. 2nd ed. London & New York: Routledge, 245–278.
- Liefferink, D., et al., 2009. Leaders and laggards in environmental policy: a quantitative analysis of domestic policy outputs. Journal of European Public Policy, 16 (5), 677–700. doi:10.1080/13501760902983283
- Lijphart, A., 2012. Patterns of democracy. Government forms and performance in thirty-six countries. 2nd. New Haven & London: Yale University Press.
- Luhtakallio, E., 2012. Practicing democracy: local activism and politics in France and Finland. Eastbourn: Palgrave-MacMillan.
- Matthews, M., 2001. Cleaning up their acts: shifts of environment and energy policies in pluralist and corporatist states. Policy Studies Journal, 29 (3), 478–498. doi:10.1111/j.1541-0072.2001.tb02105.x
- OECD, 2017. Economic Outlook: Statistics and Projections. https://data.oecd.org/gdp/real-gdp-forecast.htm (accessed 30 August 2017).
- Przeworski, A. and Teune, H., 1970. The logic of comparative social inquiry. New York: Wiley.
- Rothstein, B. and Trägårdh, L., 2007. The state and civil society in a historical perspective: the Swedish case. In: L. Trägårdh, ed. State and civil society in Northern Europe. The Swedish model reconsidered. New York and Oxford: Berghahn, 229–253.
- Sabatier, P.A., 1998. The Advocacy coalition framework: revisions and relevance for Europe. Journal of European Public Policy, 5 (1), 98–130. doi:10.1080/13501768880000051
- Sarasini, S., 2009. Constituting leadership via policy: Sweden as a pioneer of climate change mitigation. Mitigation and Adaptation Strategies for Global Change, 14 (7), 635–653. doi:10.1007/s11027-009-9188-3
- Schnaiberg, A. and Gould, K.A., 1994. Environment and society: the enduring conflict. New York: St. Martin’s.
- Schneider, V., 2015. Towards post-democracy or complex power sharing? Environmental policy networks in Germany. In: V. Schneider and B. Eberlein, eds. Complex democracy. Varieties, crises, and transformations. Chem: Springer, 263–279. doi:10.1007/978-3-319-15850-1_17
- Scruggs, L., 2003. Sustaining abundance: environmental performance in industrial democracies. Cambridge: Cambridge University Press.
- Statista, 2018a. Finland: share of economic sectors in the gross domestic product (GDP) from 2006 to 2016. The Statistics Portal. https://www.statista.com/statistics/327513/share-of-economic-sectors-in-the-gdp-in-finland/(accessed 10 January 2018)
- Statista, 2018b. Sweden: share of economic sectors in the gross domestic product (GDP) from 2006 to 2016. The Statistics Portal. https://www.statista.com/statistics/375611/sweden-gdp-distribution-across-economic-sectors/(accessed 10 January 2018)
- Statista, 2018c. Annual greenhouse gas emissions from fuel combustion in the transport sector in Finland from 2005 to 2014 (in million tons of CO2 equivalent). The Statistics Portal. https://www.statista.com/statistics/411914/annual-greenhouse-gas-emissions-of-the-transport-sector-in-finland/(accessed 12 January 2018)
- Statista, 2018d. Annual greenhouse gas emissions from fuel combustion in the transport sector in Sweden from 2005 to 2014 (in million tons of CO2 equivalent). The Statistics Portal. https://www.statista.com/statistics/411915/annual-greenhouse-gas-emissions-of-the-transport-sector-in-sweden/(accessed 12 January 2018)
- Statistics Finland, 2017a. National accounts. http://tilastokeskus.fi/til/vtp/2016///vtp_2016_2017-07-13_tie_001_en.html (accessed 30 August 2017
- Statistics Finland, 2017b. Suomen kasvihuonekaasupäästöt 2016. https://www.stat.fi/til/khki/2016/khki_2016_2017-05-24_kat_001_fi.html (accessed 15 January 2018)
- Statistics Sweden, 2017. Greenhouse gas emissions continue to increase. http://www.scb.se/en/finding-statistics/statistics-by-subject-area/environment/environmental-accounts-and-sustainable-development/system-of-environmental-and-economic-accounts/pong/statistical-news/environmental-accounts–emissions-to-air-q3-2016/(accessed 15 January 2018)
- Tamminen, S., Ollikka, K., and Laukkanen, M., 2016. Suomen energiaverotus suosii energiaintensiivisiä suuryrityksiä. VATT Policy Brief 2-2016. http://vatt.fi/suomen-energiaverotus-suosii-energiaintensiivisia-suuryrityksia (accessed 8 January 2017)
- Teräväinen, T., 2012. The politics of energy technologies. Debating climate change, energy policy, and technology in Finland, the United Kingdom, and France. Helsinki: Into.
- Tirkkonen, J., 2000. Ilmastopolitiikka ja ekologinen modernisaatio. Diskursiivinen tarkastelu suomalaisesta ilmastopolitiikasta ja sen yhteydestä metsäsektorin muutokseen. [Climate policy and ecologial modernisation. A discursive study of Finnish climate policy and its connections with forestry.]. Acta Universitatis Tamperensis, 781. Tampere: Tampere University Press
- Valtioneuvosto, 2017. Minister Tiilikainen: Finland to achieve carbon-neutrality by 2045. http://valtioneuvosto.fi/artikkeli/-/asset_publisher/ministeri-tiilikainen-suomesta-hiilineutraali-yhteiskunta-viimeistaan-vuonna-2045?_101_INSTANCE_3wyslLo1Z0ni_languageId=en_US (accessed 20 September 2017).
- Wälti, S., 2004. How multilevel structures affect environmental policy in industrialized countries. European Journal of Political Research, 43 (4), 599–634. doi:10.1111/j.1475-6765.2004.00167.x
- Ylä-Anttila, T., 2010. Politiikan paluu. Globalisaatioliike ja julkisuus. [The Return of Politics. The Global Justice Movement and the Public Sphere.]. Tampere: Vastapaino.
- Zannakis, M., 2009. Climate policy as a window of opportunity. Sweden and global climate change. Gothenburg Studies in Politics 121. Gothenburg: University of Gothenburg.
Appendix 1. The composite variable measuring pro-mitigation beliefsa,b,c.
