
ABSTRACT
Environmental protection efforts commonly make use of two types of government interventions: command and control policies (C&C) and market-based instruments (MBIs). While MBIs are favored for their economic efficiency, visible prices on pollution may generate political backlash. We examine whether citizens are more likely to support policies that tend to obfuscate policy costs (C&C), as opposed to MBIs, which impose visible costs. Using conjoint experiments in Beijing and New Delhi, we examine support for ‘policy bundles’, including both C&C policies and MBIs, aimed at limiting air pollution from vehicles. In both cities, increasing fuel taxes (a MBI) reduces policy support. However, pledging revenue usage from fuel taxes to subsidize electric cars or public transport eliminates this negative effect. Furthermore, individuals with a lower evaluation of their government respond more negatively to MBIs. MBIs may be economically efficient, but are politically difficult unless policy-makers can offset visible costs through additional measures.
Introduction
Air pollution is a major global health problem, killing millions of people every year. Worldwide, nine out of ten people breathe air that the World Health Organization deems unhealthy.Footnote1 Air pollution is a particularly important policy challenge in urban areas of emerging economies. We focus on India and China where this problem is severe: many cities with the highest ambient air pollution globally (PM 2.5) are located in India (Mahato and Ghosh Citation2020) and China (Shi et al. Citation2019). Researchers have also noted the role of automobiles in this regard, which account for less than one-third of travel distance but contribute 73% to urban air pollution.Footnote2
Facing such challenges, governments usually struggle to identify, adopt, and implement policy instruments that reduce pollution and are also politically acceptable to the mass public. Urban air pollution poses a major challenge in this regard because much of the pollution originates from the transportation sector. In contrast to reducing pollution from large point sources, such as electric power plants and factories, reducing pollution from diffused sources is more challenging both administratively and politically. In particular, motorized vehicles or nonpoint sources, which account for a large share of urban air pollution (Karagulian et al. Citation2015), pose a serious political challenge because policy interventions targeting vehicular pollution impose direct costs on car owners to produce the public good of cleaner air.
Political economists have long noted political challenges in enacting policies that impose concentrated costs on a few to produce diffused benefits for many (Lowi Citation1964, Wilson Citation1980). One key lesson is that policies imposing concentrated costs might pass the muster of economic efficiency, but often fail the test of political rationality. Alongside the distributional dimension, policy support might depend on the visibility of costs and benefits (Mani and Mukand Citation2007, Prakash and Potoski Citation2014). Politicians might favor economically inefficient policies, such as flood relief, as opposed to more efficient policies of flood control. The reason is that the public rewards them for solving problems (a visible benefit) and not for preventing problems that did not happen (Healy and Malhotra Citation2009). Similarly, politicians have incentives to invest in visible, new infrastructure projects as opposed to maintaining less visible, existing ones. Even companies invest more in reducing visible air pollution in contrast to less visible water pollution (Prakash and Potoski Citation2014).
In this paper, we examine how different policy instruments affect public support for environmental policy. We distinguish between Command and Control (C&C) and Market Based Instruments (MBIs) in assessing how policy design affects political feasibility. Following a visibility-based logic of political support, we expect that a policy with hidden costs faces less public opposition than one that imposes visible costs. Therefore, MBIs which make clear their costs to the public are expected to be less popular than C&C instruments, and thus less stringent in the cost burdens citizens are willing to accept. We also expect these differences in public support to depend upon whether individuals are targeted by the policy in question and their general level of political trust.
To assess public support for MBI and C&C instruments for limiting vehicular urban air pollution, we employ a conjoint experiment embedded in surveys fielded in Beijing and New Delhi. Beijing and New Delhi are the capital cities of the most populous economies, that struggle with severe urban air pollution problems. A key novelty of the paper is that instead of examining one policy instrument in isolation, we assess public support for policy bundles that include four policies each: (1) a tax on petrol and diesel (MBI), (2) Vehicle Ownership Permits (VOP) (MBIs), (3) prohibition of motor vehicles older than 10 years (C&C), (4) odd-even rule imposing driving restrictions (road space rationing) based on license plate number (C&C). These policies, and each policy instrument thereof, can have different levels of stringency, which we randomly vary across policy bundles. We define policy stringency to mean the level of direct (e.g. monetary) or indirect (e.g. requirements and regulations) costs imposed by a particular instrument design. This 4 × 4 research design allows us to understand how individuals view the four policy instruments and the extent to which individuals may trade-off policy instruments.
We find that using MBIs either causes a significant decrease in support for a policy bundle or has no significant effect. In both Beijing and New Delhi, increasing fuel taxes leads to a significant decline in overall policy support. However, pledging revenue usage from fuel taxes to subsidize electric cars or public transport eliminates this negative effect. The results are robust to car ownership. Individuals with a lower evaluation of their government respond more negatively to MBIs. The main implication is that MBIs may be economically efficient, but politically difficult unless policymakers can overcome their political limitations through additional measures, such as fuel tax revenue recycling (Parry Citation1995, Beck et al. Citation2015, Beiser-McGrath and Bernauer Citation2019, Dolšak et al. Citation2020).
Theoretical approach
Scholars commonly differentiate between two major types of policy instruments that can be used to address collective action challenges and produce public environmental goods: Command and Control (C&C) and Market-Based Instruments (MBI) (Blackman et al. Citation2018). C&C policies seek to limit pollution through explicit mandates or restrictions on polluting activity. In contrast, MBIs seek to incentivize individuals and/or firms to pollute less by imposing direct economic costs, usually in the form of taxes or permits.Footnote3
While this body of research clearly demonstrates the differences between these policy types and their effectiveness (He et al. Citation2016; Zhang et al. Citation2016, Bonilla Citation2019), the focus of this paper is on comparisons between these instruments in terms of policy support (e.g. Keohane et al. Citation1998, Campbell Citation2011, Stokes and Warshaw Citation2017, Huber et al. Citation2020, Wicki et al. Citation2020, Huber and Wicki Citation2021), and thus their political feasibility (Drews and van den Bergh Citation2016, Ejelöv and Nilsson Citation2020). In the next section, we discuss theoretical mechanisms and review existing literature that explains differences in public support between these two policy types.
Public support for different policy instruments
To understand how the choice of policy instruments affects public support, in terms of policy feedback (e.g. Campbell Citation2011, Busemeyer et al. Citation2021, Beiser-McGrath et al. Citation2022), we first develop our theoretical argumentation around differences in the understanding of the cost implications of instruments. Based on a visibility-based logic of political support, we expect that a policy with hidden costs faces less public opposition compared to one that imposes visible costs. While transparency in public policy is often considered a virtue (Stiglitz Citation1999, French Citation2011), sometimes ‘too much’ transparency can trigger reactions that undermine policies that create public benefits. The reason is that policy transparency might focus the spotlight on private costs, and their differential incidence across individuals (e.g. Ellermann Citation2006). Thus, individuals might feel that they are bearing an unfair (private) burden to provide a public good.
In this light, MBIs such as fuel taxes that put a price on pollution (a visible cost for consumers) likely receive less public support than C&C instruments (such as emission standards) with hidden costs (Stadelmann-Steffen Citation2011). As the costs of MBIs are clearer and more easily understandable to the public they generate more political opposition (Stadelmann-Steffen and Dermont Citation2018, Kallbekken et al. Citation2013), possibly due to individuals anchoring their policy support based upon the costs stipulated. In contrast, the opacity of how exactly command and control policies translate into immediate monetary costs, could make them politically more acceptable compared to MBIs whose costs are immediate, their structure is clear and understandable. Nevertheless, it may be the case that C&Cs reduce support by limiting consumers’ freedom of choice, especially if their leads to individuals perceiving their design as unfair.
Additionally, the differences in the visibility of costs for C&Cs and MBIs is compounded by potential differences in the benefits they provide. MBIs do not guarantee that the benefit of lower air pollution is realized, which is often necessary for environmental policy support (Krosnick et al. Citation2006). Rather, they are expected to result in this benefit indirectly, by incentivizing individuals to pollute less. In contrast, the goal of reduced air pollution is more directly realized and visible through the restrictions imposed by C&C instruments. While MBIs are considered to be economically efficient, this does not necessarily translate into substantial improvements in air pollution if the details of the MBI, in terms of tax rates for instance, are not optimal. Nevertheless, additions to MBIs, such as revenue recycling that pre-commits governments to use environmental tax revenues in a certain manner (e.g. Carattini et al. Citation2018, Beiser-McGrath and Bernauer Citation2019, Jagers et al. Citation2019, Dolšak et al. Citation2020), may generate sufficient ancillary benefits to overcome these issues.
H1: Policy bundles with C&C instruments receive higher levels of support than those with MBIs.
One feature of MBIs, however, offers a potential route to political feasibility. As MBIs can generate revenue, the usage of said revenue can be used in a manner to overcome MBIs inherent political limitations (Raymond Citation2016, Rabe Citation2018). For example, by pledging the use of revenues generated from a carbon tax to specific goals, ‘revenue recycling’ has been shown to increase political support for costly climate policies (e.g. Carattini et al. Citation2018, Beiser-McGrath and Bernauer Citation2019, Jagers et al. Citation2019, Dolšak et al. Citation2020). This is coupled with research that finds green policy support increases when compensation for different coalitions of climate-vulnerables citizens is included (Gaikwad et al. Citation2022). Taken broadly, we, therefore, expect that MBIs with revenue recycling will be more popular than those without.
H2:MBIs with revenue recycling receive higher levels of support than those without.
Moderating factors
While these features of policy instruments have an aggregate impact on public support, we also expect specific characteristics of individuals to moderate these effects. In particular, we focus on whether individuals are directly affected by the policy in question and individuals’ levels of trust in government.
Policy exposure
The first moderating factor distinguishes between those who incur direct costs (car owners only) and those who benefit from the policy (both car owners and non-car owners). Following a logic somewhat reminiscent of NIMBYism (Devine-Wright Citation2005), we expect the cost implications outlined previously to be more salient for those directly impacted by the policy instruments. Therefore, we expect the differences in policy support when comparing C&Cs and MBIs to be largest for this group. Additionally, we expect the impact of revenue recycling to be less salient for this group, as any potential benefits are offset by their higher contributions to the cost. In contrast, non-car owners will be most supportive of policies that generate the largest immediate benefits, as they are not required to pay the cost that finances them. In this regard, they should be most supportive of C&C policies and MBIs that provide direct benefits through the use of revenue recycling.
H3:The level of public support for C&Cs compared to MBIs is higher for car-owners than for non-car-owners.
Governmental evaluations
An additional moderating factor we are interested in here is the role political trust, in the form of positive government evaluations, plays in support for environmental policy. Prior research on the importance of political trust for policy support more broadly finds that it plays a key role when examining individuals’ support for policies necessitating shared effort in uncertain circumstances (Hetherington Citation2004, Rudolph and Evans Citation2005, Citrin and Stoker Citation2018), for the form of regulatory policy (Harring Citation2016), and specifically for climate policy (Davidovic and Harring Citation2020). In such cases, the potential benefits derived from policy targeting air pollution reduction may be further discounted by those in the population who have a low opinion of the present government.Footnote4
This mechanism further compounds differences in support between C&Cs and MBIs, as they may also differ in their corruption potential which subsequently affects public support. MBIs, through the money they levy, directly provide fungible revenue to governments. As a result, individuals who are concerned that governments will not appropriately use revenue obtained through an MBI will be reticent to support its implementation. In contrast, C&C instruments often do not generate additional revenue for governments, as they are focused on constraining vehicle usage through prohibition or restriction. Thus, there is a lower potential for individuals to directly attribute the indirect costs they face from the policy to misuse by the government, in comparison to the collection of revenues through MBIs. This is to some extent corroborated by previous research, which finds political trust to be more important for climate taxes than for subsidies and bans (Davidovic and Harring Citation2020). As a result, individuals who have a low evaluation of the present government may be more willing to accept C&C instruments, as they are less subject to rent-seeking and corruption from governmental actors.
H4: The level of support for C&Cs compared to MBIs is higher for those who have low governmental support than those with high governmental support.
As discussed previously, revenue recycling can overcome the fungibility problem, and thus potentially mitigate these concerns. By pledging revenues to specific uses, the government clearly signals that the revenues raised from MBIs will meet the policy goal rather than be used for other purposes. However, research on carbon taxation has shown that political distrust can nevertheless still reduce the political feasibility of MBIs, as individuals may simply not believe that the government will follow through in using tax revenues as pledged (Harrison Citation2012, Fairbrother Citation2016, Citation2019). Therefore, while we clearly expect low political trust to reduce support for MBIs it is plausible that this still holds when revenue recycling is applied.
Research design and methods
Case selection
Automobiles are crucial means of transportation. While they account globally for less than one-third of travel distance, they contribute 73% to urban air pollution.Footnote5 Of course, as the world transitions to electric vehicles, urban air pollution will decline. However, since this transition will take place over two or maybe even three decades, urban air pollution due to vehicular pollution will remain a critical problem, particularly in lower income countries. Air pollution problems in New Delhi are legendary. While air pollution from stubble burning in the months of October and November often gets strong media attention, New Delhi tends to have poor air quality all year round. In addition to inviting judicial intervention (Iyengar et al. Citation2019), air pollution is an electorally important issue, especially because New Delhi’s ruling party, the Aam Aadmi Party, has tried various policy innovations (Bernauer et al. Citation2020). Local air pollution has emerged as an important concern in China as well (Steinhardt and Wu Citation2016). Some suggest that China’s quest for renewable energy is driven, in part, by the desire to reduce local air pollution (Zhu et al. Citation2020). Moreover, in recent years, China has faced local unrest on environmental issues. As a result, under the dual administrative system, while previously the cadre evaluation was focused essentially on delivering economic growth, in recent years, the party has also started to emphasize environmental goals (Wu and Cao Citation2021). Thus, while public opinion might not directly affect the choices of policymakers in China, it certainly informs the political calculations of local party leaders who are tasked with formulating public policy.
At various points in time, both cities have used policies aimed at restricting vehicle usage to limit air pollution. The most notable of these has been the odd-even rule, where private cars with odd and even registration numbers are allowed on roads only on alternate days (Goyal and Gandhi, Citation2016; Mohan et al., Citation2017). The odd-even rule, in the form just described, was used in Delhi during January 1–15, 2016, and again during April 1–15, 2016. The Beijing Traffic Management Bureau first implemented the policy during the 2008 Olympics. Since then, the policy has been used whenever a red alert is issued about air pollution, which occurs when the air quality index is expected to be over 200 for 72 hours. Therefore, citizens in both cities have similar experiences with a policy directed at vehicles in order to limit air pollution, making them ideal cases to assess the role of policy design upon public support.
Data collection
The surveys were fielded online through Ipsos and took place in two waves.Footnote6 The 1st wave of the survey, with 750 respondents per city, was fielded from 16 to 26 November 2017. We then fielded a second wave with another 750 respondents per city two weeks later, from December 4–10, 2017. We used quota sampling in order for the sample to be broadly representative in terms of gender, occupation, age, and education.Footnote7 This also ensures that there are no imbalances in demographics across waves, which could bias results.
In the conjoint experiment participants were asked to compare and choose between two policy bundles, each including two MBIs and two C&C policy instruments. The C&C policy instruments are: (1) the odd-even rule and (2) a prohibition of vehicles older than ten years. Both of these policies seek to manage vehicle numbers and usage and limit air pollution by restricting the number and emissions of vehicles plying on roads. The odd-even rule seeks to halve the number of circulating vehicles by granting daily access based upon a digit on the number plate.Footnote8 The ban on vehicles older than 10 years is based on the fact that older vehicles are more polluting.Footnote9 The two MBIs are: (1) fuel taxes and (2) vehicle ownership permits (VOPs). Both of these policy instruments seek to manage vehicle numbers and usage and limit air pollution by making it more costly to own and use a vehicle. Fuel taxes increase the marginal costs of vehicle usage, incentivizing individuals to use their vehicles less frequently and/or switch to vehicles with lower fuel consumption.Footnote10 A vehicle permit imposes an additional fixed cost on vehicle ownership and usage.Footnote11
displays policy instruments and their levels of stringency (costs). We define policy stringency to mean the level of direct (e.g. monetary) or indirect (e.g. requirements and regulations) costs imposed by a particular instrument design. Every policy bundle includes all four policy instruments, but each instrument is randomly assigned a specific level of stringency. Each respondent was presented with an initial text explaining each of the policy instruments (see Appendix A1). Respondents were then presented a table with two policy bundles, labeled A and B, with the stringency of each policy instrument within a bundle randomly assigned (Bansak et al. Citation2021). Every respondent was then asked to make a forced choice as to which policy should be adopted, between A and B. Respondents were additionally asked to rate each policy bundle on a scale from 1 (strongly opposed) to 7 (strongly support). The respondents then repeated this task with another set of randomly assigned policy bundles a further four times, making a total of five choice tasks per respondents.
Table 1. Conjoint Table: Design features of policy bundles (wording for experiment in Delhi).
Estimation
We focus on two empirical quantities when estimating the effect of an individual policy instrument upon support for the policy bundle: Average Marginal Component Effects (AMCE) and Marginal Means. AMCEs capture the change in support for the policy bundle caused by a specific stringency level of the respective policy instrument, relative to a baseline value (Hainmueller et al. Citation2014). Marginal Means, in contrast, indicate the overall proportion, or probability, of support for a given value of a policy instrument, averaging overall values of the other policy instruments (Leeper et al. Citation2019). It thus indicates average support for a policy bundle containing the specific attribute value of a policy instrument within the bundle. The AMCE for a given value of the policy instrument is thus the difference between the Marginal Mean for this value and the Marginal Mean for the baseline value of a policy instrument. Thus, AMCEs can be considered to capture differences in support, while Marginal Means measure levels of support for policy bundles.
Results
In this section we present the results of our conjoint experiments. First, we examine how the stringency of C&C and MBIs affect overall support for policy bundles. We then move on to looking at particular combinations of C&C and MBIs, to assess the extent to which they act as complements or substitutes to one another. Finally, we repeat these analyses based on individuals’ exposure to the policy, in terms of car ownership, and their prior evaluations of the city government’s policy efficacy (our measure of trust in government).
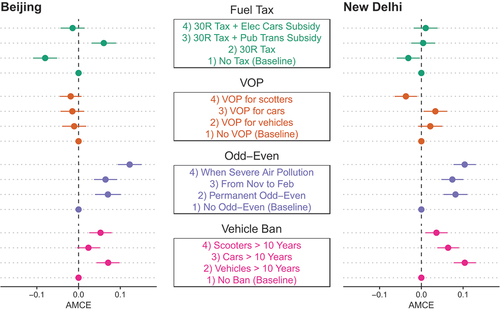
displays the effect of each policy instrument’s stringency level upon the probability of choosing a policy bundle including this feature.Footnote12 When comparing the top two rows of policies (MBI: fuel tax and VOP) to the bottom two rows (C&C: odd-even and vehicle ban), we can see that including C&C measures in a policy bundle increases support for the policy bundle. In contrast, including MBIs either decreases support or does not significantly affect support, with the exception of Beijing if a fuel tax is used to subsidize public transport.Footnote13
Figure 1. The effect of policy instruments upon the probability of a policy bundle being chosen. Points indicate Average Marginal Component Effects (AMCE), with lines displaying 95% confidence intervals.
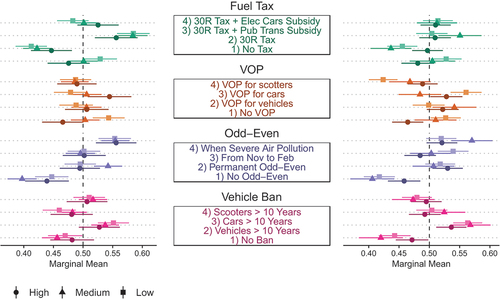
In we display marginal means.Footnote14 We can see that MBIs either significantly decrease support for the policy bundle or have no significant effect. In both Beijing and New Delhi, increasing fuel taxes leads to a significant decline in policy support. However, pledging revenue usage from this fuel tax to subsidize electric cars or public transport eliminates this negative effect. That is, a visible cost gets balanced by a visible benefit in this case. This echoes findings from research on carbon pricing, and carbon taxation in particular, which shows that committing revenues raised to the funding of infrastructure and renewables increase policy support (Beiser-McGrath and Bernauer Citation2019, Dolšak et al. Citation2020). As discussed previously, this could be a result of the benefit provided to individuals, as well as its constraining effect upon corruption and potential fairness gain through the financing of public transportation.
Figure 2. Points display the expected probability of choosing a policy bundle (marginal mean) for a given value (stringency level) of the respective policy instrument, averaging over the values of the other policy instruments. 95% confidence intervals in parentheses.
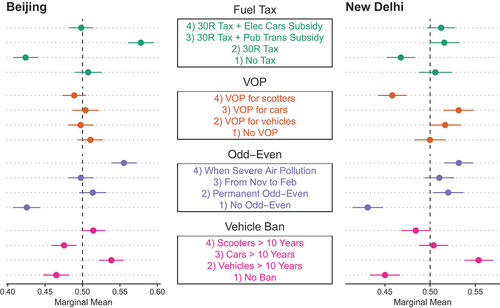
Vehicle Ownership Permits (VOPs) generally do not have a major effect on public support levels in both cities. In New Delhi, the inclusion of a VOP for scooters significantly decreases support, although a VOP for cars does cause a small but statistically significant increase in policy support.Footnote15 Yet, C&C policies generally lead to significant increases in policy support. Failure to include an odd-even rule or a vehicle ban in a policy bundle results in significant declines in support. The odd-even instrument in all its forms has a uniformly positive effect on policy support, with the most preferred form being one that is enacted whenever air pollution hits a critical level. In fact, the use of the odd-even rule when there is severe air pollution is the second most supported policy option across both cities. One explanation for this may be respondents’ familiarity with this policy option (Whan and Parker Citation1981), as both the Beijing and Delhi governments have used this policy option in recent years. The banning of vehicles older than ten years also significantly increases policy support in all its forms, the one exception being limiting the policy to only cars in Beijing.
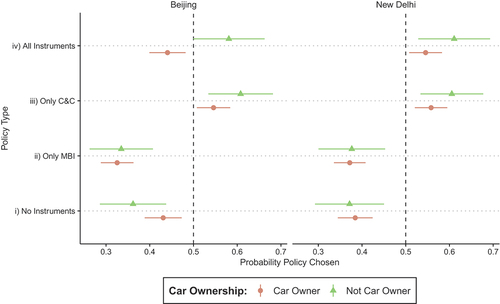
To further explore how combinations of policy instruments affect support, we calculate the probability of a policy bundle being chosen for four specific ‘policy combinations’ outlined in . These capture the full range from the least stringent, i) No Instruments, to the most stringent, iv) All Instruments in their most stringent form. They also include a policy bundle that has the most stringent MBI instruments and the least stringent C&C instruments, ii) Only MBI, as well as the opposite, iii) Only Regulation (C&C). Examining the effects of these combinations allows for comparison regarding the popularity of the most extreme versions of a policy bundle. These probabilities are estimated using the parameters of the regression models used to estimate the AMCEs.
Table 2. Stringency levels of particular policy instrument combinations.
displays the choice probabilities for the four policy combinations shown in . Taking no action, i.e. not adopting any new policy instruments, is unpopular in both Beijing and New Delhi. Interestingly, a policy combination that consists of only MBI is as unpopular as doing nothing in New Delhi and is in fact less popular than doing nothing in Beijing. The larger negative impact of MBIs in Beijing may be due to residents having less familiarity with MBI policies when compared to C&C policies. Only policy combinations that include C&C lead to a better than 50/50 chance of being preferred by individuals. In New Delhi (but not in Beijing) this is the case regardless of whether MBIs are included or not. This suggests the negative sentiment toward MBIs is offset in Delhi, but not in Beijing, when coupled with C&Cs.
Figure 3. Probability of being chosen for four policy combinations.
In summary, the absence of C&C instruments in policy bundles to deal with the negative effects of vehicle usage causes a significant decline in public support. Moreover, the inclusion of MBIs, absent benefits pledged through revenue recycling, can lead to a significant decline in public support.
Heterogeneous effects
Next, we examine whether the importance of C&C policies for overall policy support is driven by any particular subgroup. We identify two theoretically relevant subgroups in our samples: car owners and individuals’ evaluation of the government.
Car ownership might be critical because this group bears the policy cost directly. displays how the effect of policy instruments upon support for policy bundles varies by car ownership, in terms of marginal means.Footnote16 While individuals generally respond similarly regardless of car ownership, there are some important differences. First, car ownership is important when considering how a fuel tax impacts policy bundle support in Beijing.Footnote17 It is car owners who respond more negatively to a tax increase without revenue usage pledge, while those without a car do not significantly decrease policy bundle support. However, those without a car largely drive the positive effect of the public transport subsidy from fuel tax income upon support for policy bundles.
Figure 4. The effect of policy instruments upon policy bundle support, conditional upon car ownership. Lighter circular points indicate car owners, while darker triangular points indicate non-car owners.
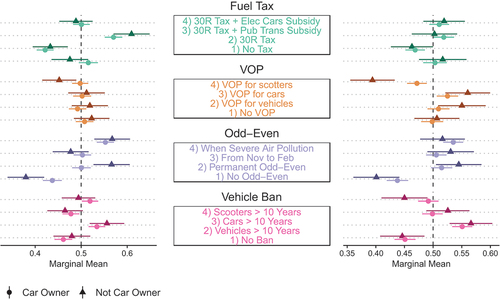
Second, in both Beijing and New Delhi, individuals without cars significantly decrease policy support when a VOP for scooters is required. Third, non-owners are more supportive of policy bundles including odd-even policies in both cities, which does not impose any costs on them. However, car owners still remain more supportive of policy bundles that include the odd-even instrument when compared to bundles that do not. Finally, there is little meaningful difference in support for policy bundles including vehicle bans by car ownership, apart from the case of scooters and non-car owners.
Returning to the policy combinations we considered earlier in and , we conduct the same analysis by car ownership status in Beijing and New Delhi. The results, displayed in , show that car ownership has a stronger impact on policy preferences in Beijing than in New Delhi. In Beijing, the non-MBI only policy bundle is the sole bundle that achieves majority support, suggesting the negative effect of MBIs amongst car owners cannot be offset by including C&C instruments. This, however, is not the case in New Delhi where a policy bundle including MBIs in combination with C&C instruments still achieves majority support amongst car owners.
Figure 5. Probability of choosing a specific policy bundle, by car ownership.
Taken together, accounting for car ownership further suggests that MBIs generate hurdles in the implementation of policies to limit vehicle pollution, significantly decreasing support for policy bundles in a variety of circumstances. In contrast, C&C generally increase support for policy bundles across both car owners and non-car owners, although this increase can weaken in line with the distribution of costs.
Finally, we look into whether individuals’ evaluation of the city government’s performanceFootnote18 may condition the effect of C&C vs. MBIs upon policy support. Individuals who hold low evaluations of the government, believing that it does not perform well on policy issues generally, may be less likely to support C&C measures that rely on governmental oversight and implementation. On the other hand, while MBIs may stop governments from micro-managing vehicle ownership and usage, the government is still ultimately involved. In fact, actively raising revenue through MBI may foster further distrust and dislike of the government, as it is seen as ‘profiting’ from the policy.
displays the effects of policy instruments on support when allowing the effect to vary by individuals’ evaluation of their city government, in terms of marginal means.Footnote19 Our results suggest that individuals with a low evaluation in the government are responding more negatively to MBIs. In the case of fuel taxes, we find that individuals with low or middle governmental evaluations are significantly more negative about the imposition of fuel taxes, without specifying the subsequent revenue usage. For all forms of VOPs, we see a decline in support amongst respondents with low government evaluations in Beijing.Footnote20 This same effect only holds for scooters in New Delhi. In contrast, we observe no negative effects for C&C instruments at any level of governmental evaluation.
Figure 6. The effect of policy instruments upon policy support, conditional upon individuals’ governmental evaluations. Darker points indicate higher evaluations of the city government, with the shape of points explicitly defining the categories: high (circular), medium (triangular), low (square).
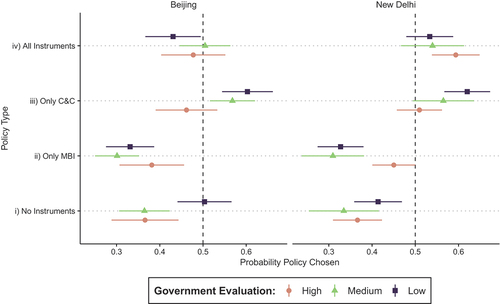
Turning to support for the four specific policy combinations, as displayed in , we can see that individuals’ evaluation of their governments can often make the difference between achieving majority support or not for a given policy bundle. Across both Beijing and New Delhi, MBIs tend to be highly unpopular, but less so amongst those with a more positive evaluation of the government. Those with more negative evaluations of their government tend to instead prefer the C&C only policy mix. While initially surprising, one explanation for this pattern could be that C&C policies do not involve revenue collection, which respondents may be skeptical of being used effectively.
Figure 7. Probability of choosing specific policy instrument combinations, by government evaluation.
Conclusion
Many if not most urban areas in developing countries and emerging economies are experiencing high levels of air pollution, and policy-makers there are struggling to find solutions that are both effective in environmental and public health terms, and politically feasible in terms of being acceptable to the mass public. In this paper we study this challenge from a public opinion and thus political feasibility perspective (e.g. Keohane et al. Citation1998), focusing on a set of four potentially effective policy instruments, and how combinations of these instruments could be designed in order to be acceptable to the mass public and critical subgroups thereof.
Our theoretical entry point is the distinction between C&C and MBIs. MBIs have a compelling economic logic, but C&C instruments might garner more public support. Reasons for this include the more direct and visible costs associated with MBIs, relative to C&C, but also various other reasons, for example, pertaining to fairness concerns arising from distributional implications of particular policy instruments.
Our empirical findings do in fact suggest that MBIs are particularly unpopular, both in Beijing and New Delhi. Yet, including C&C policy instruments results in policy bundles that a majority of respondents support, and can even mitigate the support decreasing effects of including MBIs. These negative effects of MBIs are often concentrated amongst those individuals most exposed to the policy costs associated with MBI, in our case vehicle owners. However, opposition to MBIs also arises from individuals with more negative pre-existing evaluations of the government and is likely a result of distrust that revenue being generated by such policies will be used effectively.
While our study focuses on policies to limit urban air pollution in two major cities (Beijing and China), the findings speak broadly to the global issue of mortality caused by outdoor particulate pollution generated by fossil fuel consumption (Karn et al. Citation2021). While this issue is most often referred to in other cities within the Global South it is also a major concern in cities within the Global North.Footnote21 As policies to address vehicular pollution are often the first tool local governments use in response to this issue, understanding the political feasibility of different policy instruments is crucial to assess the potential for policy-makers to take meaningful action to limit air pollution. Future research could assess the extent to which our findings generalize across these different contexts.
One ‘ray of light’ for proponents of MBIs is that pairing taxes with explicit revenue use pledges can mitigate their negative effects on policy support. This echoes findings on carbon taxation policy (Beiser-McGrath and Bernauer Citation2019, Dolšak et al. Citation2020). Further research could examine whether specific forms of revenue usage are as important in the case of vehicle usage/ownership and air pollution as they appear to be in the case of limiting carbon emissions in general (from any source) through a carbon tax. Future research could also use experimental study designs to identify what causal mechanisms tend to make particular policy instruments, and combinations of policy instruments, induce variation in political support levels. For instance, such research could explore whether C&C instruments tend to garner more public support because they obfuscate costs more than MBIs, or whether lower support levels for MBIs are driven primarily by concerns over corruption, distributional fairness, or other factors.
Ethics
The surveys that generated the data for this study were a part of ERC Advanced Grant project no. 295456 (Sources of Legitimacy in Global Environmental Governance). Ethical approval for the project as a whole was obtained at the beginning of the project (ETH Ethics Committee approval, 28 September 2012, EK-2012-N-41, extended to March 2018). The Ethics Committee of ETH Zürich and the ERC Ethics Monitoring Unit regularly monitored the project, with the final survey items provided on a continuous basis. The surveys for this study were fielded by Ipsos, and respondents were first informed about the nature of the study before being asked to consent. The study also followed the no-deception principle, whereby only factual information was provided to respondents.
Disclosure statement
No potential conflict of interest was reported by the author(s).
Data availability statement
Upon publication replication data will be available at: https://doi.org/10.7910/DVN/JVDNTD
Additional information
Funding
Notes
3. Subsidies could also be viewed as MBIs and could create conflicts on who should get subsidies or should subsidies be rolled back (Lim et al. Citation2022). We also recognize that historically both India and China have subsidized fossil fuels and electricity consumers and producers. Yet in India, for example, producer subsidies go to the coal industry and household subsidies to LPG and kerosene. Petrol and diesel are not subsidized. Hence, our paper tends to closely follow the policy landscape in these countries.
4. We recognize that citizens might have different levels of trust in national and local government, and this could impact their support for MBIs. For example, in India, the excise tax is collected by the national government, but the sales tax is collected by the local government. In China, given its one-party system, the local-federal distinction may be less important. Thus, future studies could investigate which level of government collects the tax, the trust citizens have in that branch of government, and how this might influence support for MBIs.
6. Fielding in waves was chosen to examine how public support for a specific policy changes over time, as published in Beiser-McGrath et al. (Citation2022).
7. Appendix A2 displays how the distribution of these demographics in the sample compare to census data. We find that even after using a soft quota, our sample is more educated and likely to be employed than the national average.
8. This policy has previously been used in Beijing and Delhi, as well as other cities such as Athens and Jakarta.
9. A version of this policy has been introduced in Delhi, starting in April 2022 (https://indianexpress.com/article/cities/delhi/rule-banning-old-vehicles-to-be-enforced-from-april-1-khattar-7782942/).
10. Fuel taxes are a common policy tool in many countries, and China is currently planning to impose consumption taxes on gasoline and diesel (https://www.argusmedia.com/en/news/2205974-china-eyes-reforms-to-road-fuel-consumption-tax).
11. This policy instrument has been adopted in Singapore (https://www.bbc.co.uk/news/business-41730778).
12. in section A3 of the appendix displays the statistical output with p-values.
13. Explicit calculation of differences between AMCEs by city is displayed in Table A5, section A3 of the appendix.
14. in section A3 of the appendix displays the statistical output with p-values.
15. Explicit calculation of differences between MMs by city is displayed in Table A6, section A3 of the appendix.
16. Table A3 in section A3 of the appendix displays the statistical output with p-values.
17. Explicit calculations of differences in MMs by car ownership are displayed in Tables A7 and A8, section A3 of the appendix.
18. The survey item is: ‘In your opinion, how well has the government of Beijing/New Delhi performed in recent years in dealing with the challenges the city is facing.’
19. Table A4 in section A3 of the appendix displays the statistical output with p-values.
20. Explicit calculations of differences in MMs by government performance assessment are displayed in Tables A9 and A10, section A3 of the appendix.
References
- Bansak, K., et al., 2021. Conjoint survey experiments. In: J.N. Druckman and D.P. Green, eds. Cambridge handbook of advances in experimental political science. New York: Cambridge University Press, 19–41.
- Beck, M., Wigle, R., and Yonezawa, H., 2015. Carbon tax and revenue recycling: impacts on households in British Columbia. Resource and Energy Economics, 41 (Supplement C), 40–69. doi:10.1016/j.reseneeco.2015.04.005.
- Beiser-McGrath and Bernauer, 2019. Could revenue recycling make effective carbon taxation politically feasible? Science Advances, 5 (9). doi:10.1126/sciadv.aax3323.
- Beiser-McGrath, L.F., Bernauer, T., and Prakash, A., 2022. Do policy clashes between the judiciary and the executive affect public opinion? Insights from New Delhi’s odd-even rule against air pollution. Journal of Public Policy, 42 (1), 185–200. doi:10.1017/S0143814X2100012X
- Bernauer, T., Prakash, A., and Beiser‐mcgrath, L.F., 2020. Do exemptions undermine environmental policy support? An experimental stress test on the odd‐even road space rationing policy in India. Regulation & Governance, 14 (3), 481–500. doi:10.1111/rego.12225
- Blackman, A., Zhengyan, L., and Liu, A.A., 2018. Efficacy of command-and-control and market-based environmental regulation in developing countries. Annual Review of Resource Economics, 10 (1), 381–404. doi:10.1146/annurev-resource-100517-023144
- Bonilla, J.A., 2019. The more stringent, the better? Rationing Car Use in Bogotá with Moderate and Drastic Restrictions, the World Bank Economic Review, 33 (2), 516–534.
- Busemeyer, M., Abrassart, A., and Nezi, R., 2021. Beyond positive and negative: new perspectives on feedback effects in public opinion on the welfare state. British Journal of Political Science, 51 (1), 137–162. doi:10.1017/S0007123418000534
- Campbell, A.L., 2011. Policy feedbacks and the impact of policy designs on public opinion. Journal of Health Politics, Policy and Law, 36 (2011), 961–973. doi:10.1215/03616878-1460542
- Carattini, S., Carvalho, M., and Fankhauser, S., 2018. Overcoming public resistance to carbon taxes. Wires Climate Change, 9.
- Citrin, J. and Stoker, L., 2018. Political trust in a cynical age. Annual Review of Political Science, 21 (1), 49–70. doi:10.1146/annurev-polisci-050316-092550.
- Davidovic, D. and Harring, N., 2020. Exploring the cross-national variation in public support for climate policies in Europe: the role of quality of government and trust. Energy Research & Social Science, 70, 101785. doi:10.1016/j.erss.2020.101785
- Devine-Wright, P., 2005. Beyond NIMBYism: towards an integrated framework for understanding public perceptions of wind energy. Wind Energy, 8 (2005), 125–139. doi:10.1002/we.124
- Dolšak, N., Adolph, C., and Prakash, A., 2020. Policy design and public support for carbon tax: Evidence from a 2018 US national online survey experiment (2020) Public Administration 98: 905–921. https://doi.org/10.1111/padm.12657
- Drews, S. and van den Bergh, J.C.J.M., 2016. What explains public support for climate policies? A review of empirical and experimental studies. Climate Policy, 16 (7), 855–876. doi:10.1080/14693062.2015.1058240
- Ejelöv, E. and Nilsson, A., 2020. Individual factors influencing acceptability for environmental policies: a review and research agenda. Sustainability, 12 (6), 2404. doi:10.3390/su12062404
- Ellermann, A., 2006. Street-level democracy: how immigration bureaucrats manage public opposition. West European Politics, 29 (2), 293–309. doi:10.1080/01402380500512627
- Fairbrother, M., 2016. Trust and public support for environmental protection in diverse national contexts sociol. Science, 3, 359–382.
- Fairbrother, M., 2019. When will people pay to pollute? Environmental taxes, political trust and experimental evidence from Britain. British Journal of Political Science, 49 (2), 661–682. doi:10.1017/S0007123416000727
- French, P.E., 2011. Enhancing the legitimacy of local government pandemic influenza planning through transparency and public engagement. Public Administration Review, 71 (2), 253–264. doi:10.1111/j.1540-6210.2011.02336.x
- Gaikwad, N., Genovese, F., and Tingley, D., 2022. Creating climate coalitions: mass preferences for compensating vulnerability in the world’s two largest democracies. American Political Science Review. 1-19. doi:10.1017/S0003055422000223.
- Goyal, P. and Gandhi, G., 2016. Assessment of Air Quality during the ‘Odd-Even Scheme’ of Vehicles in Delhi. Indian Journal of Science and Technology, 9 (48), 1–7. doi:10.17485/ijst/2016/v9i30/97528.
- Hainmueller, J., Hopkins, D., and Yamamoto, T., 2014. Causal inference in conjoint analysis: understanding multidimensional choices via stated preference experiments. Political Analysis, 22 (1), 1–30. doi:10.1093/pan/mpt024
- Harring, N., 2016. Reward or punish? Understanding preferences toward economic or regulatory instruments in a cross-national perspective. Political Studies, 64 (3), 573–592. doi:10.1111/1467-9248.12209
- Harrison, K., 2012. A tale of two taxes: the fate of environmental tax reform in Canada and the province of British Columbia. Review of Policy Research, 29, 385–409. doi:10.1111/j.1541-1338.2012.00565.x
- Healy, A. and Malhotra, N., 2009. Myopic voters and natural disaster policy. American Political Science Review, 103 (3), 387–406. doi:10.1017/S0003055409990104
- He, G., Fan, M., and Zhou, M., 2016. The effect of air pollution on mortality in China: evidence from the 2008 Beijing Olympic Games. Journal of Environmental Economics and Management, 79, 18–39. doi:10.1016/j.jeem.2016.04.004
- Hetherington, M.J., 2004. Why trust matters: declining political trust and the demise of American liberalism. Princeton: Princeton University Press.
- Huber, R.A. and Wicki, M., 2021. What explains citizen support for transport policy? the roles of policy design, trust in government and proximity among Swiss citizens. Energy Research & Social Science, 75, 101973. doi:10.1016/j.erss.2021.101973
- Huber, R.A., Wicki, M.L., and Bernauer, T., 2020. Public support for environmental policy depends on beliefs concerning effectiveness. Intrusiveness, and Fairness’ Environmental Politics, 29 (4), 649–673. doi:10.1080/09644016.2019.1629171
- Iyengar, S., Dolšak, N., and Prakash, A., 2019. Selectively assertive: interventions of India’s supreme court to enforce environmental laws. Sustainability, 11 (24), 7234. doi:10.3390/su11247234
- Jagers, S., Martinsson, J., and Matti, S., 2019. The impact of compensatory measures on public support for carbon taxation: an experimental study in Sweden. Climate Policy, 19 (2), 147–160. doi:10.1080/14693062.2018.1470963
- Kallbekken, S., Garcia, J.H., and Korneliussen, K., 2013. Determinants of public support for transport taxes. Transportation research part A. Policy and Practice, 58, 67–78.
- Karagulian, F., et al., 2015. Contributions to cities’ ambient particulate matter (PM): a systematic review of local source contributions at global level. Atmospheric Environment, 120, 475–483. doi:10.1016/j.atmosenv.2015.08.087
- Karn, V., et al.;Loretta J.Mickley, April 2021. Global mortality from outdoor fine particle pollution generated by fossil fuel combustion. Results from GEOS-Chem Environmental Research, 195, 110754. doi:10.1016/j.envres.2021.110754.
- Keohane, N.O., Revesz, R.L., and Stavins, R.N., 1998. The choice of regulatory instruments in environmental policy. Harvard Environmental Law Review, 22 (2), 313–368.
- Krosnick, J.A., et al. 2006. The origins and consequences of democratic citizens’ policy agendas: a study of popular concern about global warming. Climatic Change, 77 (1–2), 7–43. doi:10.1007/s10584-006-9068-8.
- Leeper, T., Hobolt, S., and Tilley, J., 2019. Measuring subgroup preferences in conjoint experiments. Political Analysis.
- Lim, S., et al., 2022. Distributional concerns and public opinion: EV subsidies in the U.S. and Japan. Energy Policy, 2022 (164), 112883. doi:10.1016/j.enpol.2022.112883
- Lowi, T.J., 1964. American business, public policy, case-studies, and political theory. World Politics, 16 (4), 677–715. doi:10.2307/2009452
- Mahato, S. and Ghosh, K.G., 2020. Short-term exposure to ambient air quality of the most polluted Indian cities due to lockdown amid SARS-CoV-2. Environmental Research, 188, 109835. doi:10.1016/j.envres.2020.109835
- Mani, A. and Mukand, S., 2007. Democracy, visibility and public good provision. Journal of Development Economics, 83 (2), 506–529. doi:10.1016/j.jdeveco.2005.06.008
- Mohan, D., et al., 2017. Evaluation of Odd– Even Day Traffic Restriction Experiments in Delhi, India. Transportation Research Record, 2627 (1), 9–16. doi:10.3141/2627-02.
- Parry, I.W.H., 1995. Pollution taxes and revenue recycling. Journal of Environmental Economics and Management, 29 (3), S64–S77. doi:10.1006/jeem.1995.1061
- Prakash, A. and Potoski, M., 2014. Global private regimes, domestic public law: ISO 14001 and pollution reduction. Comparative Political Studies, 47 (3), 369–394. doi:10.1177/0010414013509573
- Rabe, B.G., 2018. Can we price carbon? Cambridge: MA, MIT Press.
- Raymond, L., 2016. Reclaiming the atmospheric commons: the regional greenhouse gas initiative and a new model of emissions trading. Cambridge, MA: MIT Press.
- Rudolph, T.J. and Evans, J., 2005. Political trust, ideology, and public support for government spending. American Journal of Political Science, 49 (3), 660–671. doi:10.1111/j.1540-5907.2005.00148.x
- Shi, C., Guo, F., and Shi, Q., 2019. Ranking effect in air pollution governance: evidence from Chinese cities. Journal of Environmental Management, 251, 109600. doi:10.1016/j.jenvman.2019.109600
- Stadelmann-Steffen, I., 2011. Citizens as veto players: climate change policy and the constraints of direct democracy. Environmental Politics, 20 (4), 485–507. doi:10.1080/09644016.2011.589577
- Stadelmann-Steffen, I. and Dermont, C., 2018. The Unpopularity of incentive-based Instruments: What Improves the cost–benefit Ratio? Public Choice, 175 (2018), 37–62.
- Steinhardt, H.C. and Wu, F., 2016. In the name of the public: environmental protest and the changing landscape of popular contention in China. The China Journal, 75 (1), 61–82. doi:10.1086/684010
- Stiglitz, J.E. (1999). On liberty, the right to know, and public discourse: the role of transparency in public life. Globalizing rights: The Oxford amnesty lectures, Oxford, U.K., 149.
- Stokes, L.C. and Warshaw, C., 2017. Renewable energy policy design and framing influence public support in the United States. Nature Energy, 2 (2017), 17107. doi:10.1038/nenergy.2017.107
- Whan, P.C. and Parker, L.V., 1981. Familiarity and its impact on consumer decision biases and heuristics. Journal of Consumer Research, 8 (2), 223–230. doi:10.1086/208859
- Wicki, M.L., Huber, R.A., and Bernauer, T., 2020. Policy packaging and public support for mobility policies. Journal of Public Policy, 40 (4), 599–625. doi:10.1017/S0143814X19000205
- Wilson, J.Q., editor. 1980. The politics of regulation. New York: Basic Books.
- Wu, M. and Cao, X., 2021. Greening the career incentive structure for local officials in China: does less pollution increase the chances of promotion for Chinese local leaders? Journal of Environmental Economics and Management, 107, 102440. doi:10.1016/j.jeem.2021.102440
- Zhang, W., Lin Lawell, C.-Y.-C., and Umanskaya, V.I., 2017. The effects of license plate-based driving restrictions on air quality: Theory and empirical evidence. Journal of Environmental Economics and Management, 82, 181–220. doi:10.1016/j.jeem.2016.12.002
- Zhu, Y., et al., 2020. Does renewable energy technological innovation control China’s air pollution? A spatial analysis. Journal of Cleaner Production, 250, 119515. doi:10.1016/j.jclepro.2019.119515
Appendix
A1. Conjoint Text
Please read the following text very carefully.
Pollution from motor vehicles, such as cars, trucks, buses, and motorcycles/scooters, accounts for a large part of the total air pollution in New Delhi. Besides air pollution, motor vehicle traffic contributes to congestion, noise, and accidents. The government is currently considering measures (policies) to limit motor vehicles in New Delhi. Such measures include:
(1) An additional tax on petrol/diesel of 30 Rs per litre. This would raise the price per litre from around 70 Rs to around 100 Rs.
(2) Introducing an odd-even rule. This rule would allow motor vehicles with an odd or even license plate number to circulate in the city only every other day. Vehicles with an odd license plate number at the end (1,3,5,7,9) would, for instance, be allowed to drive on Mondays, Wednesdays, and Fridays and would be banned from circulating in New Delhi on Tuesdays, Thursdays, and Saturdays. Vehicles with an even license plate number at the end (2,4,6,8) would then be allowed to drive on Tuesdays, Thursdays, and Saturdays, but banned from circulating on Mondays, Wednesdays, and Fridays.
(3) Banning motor vehicles older than ten years, which are usually more polluting than newer vehicles, from circulating in New Delhi.
(4) A Vehicle Ownership Permit. Anyone who acquires a new or used motor vehicle in New Delhi must from now on first obtain a Vehicle Ownership Permit for the appropriate vehicle category before the vehicle can be bought, registered, and used. In contrast to taxes on petrol/diesel, which continuously result from using a vehicle and depend on how much the vehicle is used, the Vehicle Ownership Permit requires a one-off payment before a car is bought and used. The Permit would allow its owner to have a car and use it on the road space of New Delhi for 10 years. The Permit would cost 400ʹ000 Rs. for a truck, 200ʹ000 Rs. for a car, and 50ʹ000 Rs. for a motorcycle/scooter.
In the following, we will ask you to look at sets of two policy proposals, shown side-by-side. Each policy proposal consists of a combination of the policy measures shown a moment ago. Please look at each of the policies very carefully, compare them, and tell us which of the two policy proposals you would like the government to adopt and implement. In some cases, the two proposals may look quite similar, but will in fact differ in at least one or more aspects.
Q: Please rate the two policy measures on a scale from 1 to 7, where 1 indicates that you “ strongly oppose “ and 7 indicates that you “ strongly support “ the policy measure.
Appendix
A2. Distribution of Demographic Characteristics22
Appendix
A3. Statistical Analysis Tables
Table A1: Probability of choosing policy.
Table A2: Marginal means.
