
 ?Mathematical formulae have been encoded as MathML and are displayed in this HTML version using MathJax in order to improve their display. Uncheck the box to turn MathJax off. This feature requires Javascript. Click on a formula to zoom.
ABSTRACT
This article investigates the impact of climate policies on electoral support for governing parties in Sweden through mixed methods combining a sentiment analysis of news articles and regression discontinuities of voter support over time. The regression discontinuity models indicate that the effects of climate policies on government support are not robust and are spurious across different model specifications. To ensure that we can detect effects, we used a set of political events that could have affected government support, such as elections and the Covid-pandemic as robustness checks. Contrary to expectations from literature and analyzed news reporting, we cannot determine robust effects of introducing climate policies on governmental support in Sweden. This suggests that governments do not need to anticipate losing substantial support when implementing climate policies – at least in favorable conditions.
1. Introduction
In its 2021 report, the Intergovernmental Panel on Climate Change emphasized the urgent need for rapid and substantial emission reductions to limit global warming to 1.5°C within the next 10–20 years (IPCC Citation2021). In 2021, EU citizens reported climate change as the single most important issue, and 75% of EU citizens believed that their government did not do enough to tackle climate change (European Union Citation2021). At the same time, previous studies argue that politicians hesitate to introduce stricter climate change mitigation policies, because of the risk of not being re-elected when implementing policies with short-term costs and long-term benefits (List and Strum Citation2006, Wynes and Kimberly Citation2017, Carter Citation2018, Farjam et al. Citation2019, Huber et al. Citation2020). However, to the best of our knowledge, no studies systematically study whether the introduction of climate policies leads to voters punishing incumbent parties.
Hence, our overarching research question is: ‘How does the support for governing parties change with the introduction of climate policies?’
We chose Sweden as a case to study because the country is ranked in the top ten on Environmental Index Performance (Wolf et al. Citation2022) and is acknowledged as a forerunner in climate policies. For example, Sweden introduced a carbon tax in 1991 and a binding ‘climate law’ in 2018. Sweden, therefore, constitutes a case of climate policy leadership and is often referred to as a success story (Sarasini Citation2009). Moreover, Sweden has low levels of corruption, high levels of trust, and citizens express high levels of concern for climate change (Söderpalm and Wennö Citation2019). If voters in Sweden thus punished the government for climate policies, it would indicate that this even happens under fairly climate-friendly institutional and electoral conditions. If the voters did not punish the government, this would show that it is possible – at least in favorable conditions – to introduce climate policies without loss of public approval. In this study, we use a mixed-method design to corroborate and test theory-based hypotheses, combining a lexicon-based sentiment analysis of newspaper articles in Sweden with a temporal regression discontinuity design of opinion polls time-series.
In what follows, we begin by reviewing existing literature on public opinion regarding climate policy in Section 2. In Section 3, we derive hypotheses based on the theory of self-interest voters. Section 4 outlines our methodology, including operational definitions, data sets, and methods. Our findings, showing, none, or limited effects of economic climate policies on government support, are presented in Section 5. We then analyze these results in Section 6 before discussing implications for Sweden and beyond in Section 7. Finally, we conclude with policy implications and suggestions for future research in Section 8.
2. Literature review
We explore three distinct strands of literature: voter mobility, the importance of single-issue voting and public support for climate policies. All three strands contribute to our understanding of the dynamic of the electorate regarding climate policies.
2.1. Voter mobility
Voters are increasingly independent in their political beliefs, leading to individualization in voting decisions and higher voter mobility regarding specific issues (Denver and Hands Citation1990, Aardal and Van Wijnen Citation2005). This trend is attributed to macro-sociological changes such as modernization and individualization and has led voters to be more independent in relation to political parties (Dalton Citation2013, Oscarsson Citation2020). Additionally, List and Strum (Citation2006) discovered that voters tend to focus on a single issue when making their voting choices, leading them to support politicians who align with their views on a particular issue.
Swedish election surveys show that the tendency of voters to let class and occupational position weigh heavily in their voting decisions has declined since the 1950s (Oscarsson Citation2020). In the 1950s 10–15% of the voters changed party between elections. In the most recent election, about one-third of the electorate changed party (Holmberg et al. Citation2022, p. 45). At the same time, followership for specific parties has weakened (Oscarsson Citation2020). Hence, rather than party loyalty alone, voting decisions today are to a greater extent shaped by topics prominent in the public debate and individual positions on these issues. During the last years, we have also seen major changes on an aggregate level, where the most conspicuous change is the support for the Sweden Democrats, which has gone from slightly less than 3% in the national election in 2006 to more than 20% in the national election in 2022 (Holmberg et al. Citation2022, p. 6, Figure 1).
2.2. Salient policy issues
Since there has been an increase in voter mobility, issue salience has gained importance to understand movements in the political landscape (Crawley et al. Citation2020). Salient issues serve as a public signal to the government about the priorities of voters (Aardal and Van Wijnen Citation2005) and politicians are more likely to acknowledge salient issues responsive to the electorate (Epstein and Segal Citation2000, Burstein Citation2003, Raile et al. Citation2014). Issue voting theory has thus gained prominence not just as a concept to explain voter behavior and mobility (Dennison Citation2019), but also as explanatory power for party behavior (Klüver and Sagarzazu Citation2016). For example, Ladrech and Little (Citation2019) found that political parties’ climate policy preferences are shaped by public opinion, but that competition between mainstream parties can both constrain and promote ‘greener’ preferences, depending on the electorate.
Given the generally high concern for climate change in public opinion polls, one may argue that this is a salient issue of general concern. In principle, there are indications that in constituencies where climate concerns are particularly high, more climate policies can be observed (Bromley-Trujillo and Poe Citation2020). Yet even though concern for climate change is high, it appears to be of moderate salience for many, or voters may be wary of the consequences (Crawley et al. Citation2020). Schumacher (Citation2014) shows that ecological concern determines green voting in various ways and while climate change is on the agenda, political parties can be expected to position themselves in relation to it. However, Levin et al. (Citation2012) show that salient climate change topics do not necessarily translate into climate policies, and Abou-Chadi and Kayser (Citation2017) find that voters punish parties if they perceive the economy as weak and associate the party with climate policies that may weaken the economy further.
2.3. Climate policy support
Support for climate policies is a complex and multifaceted issue that is influenced by a variety of factors. A basic assumption is that people’s positions on climate policies are based on their self-interest. Simply, people are assumed to reject policies more likely if they perceive that it will have negative consequences for themselves (Jakobsson et al. Citation2000). However, pure self-interest motives are not sufficient to explain people’s policy positions (Kallbekken and Sælen Citation2011). Other important factors are, political orientation (Hornsey et al. Citation2018, Farjam et al. Citation2019), environmental concern, risk, and knowledge (Shi et al. Citation2015, Rhodes et al. Citation2017, Ejelöv and Nilsson Citation2020), and political trust, norms, or the different effects of specific media events (Hammar and Jagers Citation2006, Drews et al. Citation2016).
A meta-analysis by Bergquist et al. (Citation2022) conclude that demographic factors have small effects on acceptability, while beliefs about policy attributes in terms of consequences for fairness and climate-change evaluations were strong determinants (see also Gampfer Citation2014, Farstad Citation2018, Huber et al. Citation2020, Ejelöv et al. Citation2022). Other factors influencing the public’s position are policy design such as pull over push measures, where people in general are more positive towards pull measures compared to push measures, as the latter are perceived to be more intrusive (Krosnick et al. Citation2006). Yet, there are also studies showing that bans, or command and control policies are preferred to market-based policies, not the least in corrupt contexts (Davidovic and Harring, Citation2020). Furthermore, the perceived effectiveness of the policy (Bergquist et al. Citation2022) and proximity or affectiveness matters for policy preferences (Gaikwad et al. Citation2022).
As the commitment to issues has become more important in the voting decision, it is a partly open question how far the introduction of climate policies brings either higher or lower support for the incumbent parties. In principle, there is a higher likelihood for parties to address climate change if their voters view it as a pressing issue, and there is a greater chance that a climate policy perceived as fair by voters will receive broader support. However, there is an important knowledge gap in the literature. We still do not really know how the general electorate responds to the introduction of climate policies by the government.
3. Theory
If voters are mobile in their political preferences, attentive to salient issues, and concerned about the design of climate policies, we can assume that corresponding policy implementations may impact government support. As a theoretical starting point for our analysis, we assume that voters make boundedly rational decisions (Simon Citation1990, MacDonald Citation2003). We recognize that cognitive constraints pose limitations to rational choice and acknowledge that people use complexity-reducing heuristics and other measures for their decision (Jones Citation1999, Stadelmann et al. Citation2013).
3.1. The self-interested voter
The empirical tradition of rational choice uses the utility maximization assumption to construct models of voting behavior, which includes self-interest, in explanations of decisions on how to vote. The theory posits that voters make their decisions based on a rational assessment of the costs and benefits of different policy options. Tufte’s influential study in 1978 showed that at least politicians perceive voters to be primarily influenced by their economic self-interest (Tufte Citation1978). According to the theory, voters are assumed to be informed about the issues and capable of processing complex information (Downs Citation1957, Shabman and Stephenson Citation1994).
There have been important expansions on the theory that are in line with salient issue voting. The preferences people hold may include pro-environmental norms (Turaga et al. Citation2010) and purely cost-driven explanations may not provide the full picture (Best and Kneip Citation2011). For example, exposure to external factors and direct experience of natural disasters may increase climate change awareness and thus pro-environmental preferences (Baccini and Leemann Citation2021). That is to say, external factors such as pro-environmental norm shifts in society at large may affect the preference order of individuals (see e.g. Hanley and Czajkowski Citation2019). Hence, individuals may hold pro-environmental norms and still act (boundedly) rational upon choices that maximize their preference satisfaction when it comes to weighing (perceived) costs and benefits.
Support for voters having their economic self-interest in mind is found in Farjam et al. (Citation2019) who suggested that environmental attitudes affect policy support only in situations where the personal costs are low. Likewise, Tobler et al. (Citation2012) could only determine a correlation between political affiliation and climate policy support in high-cost situations. Downs demonstrates that a political issue only has support for a short time, due to the constant change in society (Downs Citation1972). Others have argued that it is easier for politicians to introduce and implement policies with a short and clear outcome (Carter Citation2018). Climate policies that target individual consumers, for example carbon taxes, that entail high costs with diffuse benefits are therefore difficult to justify. Harrison (Citation2012) describes that when voters are motivated by self-interest, there will be greater resistance to an introduction of a climate policy, especially if the policy entails a visible and immediate cost for the individual voter (Harrison Citation2010). Hence, introducing stricter climate policies has been seen as politically vulnerable (Harrison Citation2012).
Even though the theory of the self-interested voter holds limitations, we acknowledge in line with Dzenis and Nobre Faria (Citation2022), that ideology may serve as a motivational drive in the voting decision, but only until it becomes too costly. More importantly, the idea that voters are rational and self-interested is the theoretical foundation for scholars arguing that voters punish governments for introducing climate policies. Hence, the self-interested voter is our point of departure to see if this punishment is indeed the case. Here, a narrow view of self-interest has epistemological benefits in terms of straightforward hypotheses formulation and testability.
3.2. Hypothesis
The idea that climate policies incur costs to the voter and therefore have a high political price through reduced support in upcoming elections can be found in several literatures e.g. Harrison (Citation2010); List and Strum (Citation2006); Huber et al. (Citation2020); Carter (Citation2018); Farjam et al. (Citation2019); Wynes and Kimberly (Citation2017). In line with this body of literature, we formulate the following hypothesis about government support upon the introduction of climate policies.
H1:
The introduction of climate policies affects government support.
| – | Negatively for policies with direct personal costs (e.g. taxes). | ||||
| – | Positively for policies with direct personal benefits (e.g. subsidies). | ||||
There is however an important condition for this (boundedly) rational choice theory to hold, namely, the voter must know of the policy and its consequences, or else no reaction in terms of changes in voting intention can be expected. Therefore, we incorporate a corresponding test for issue saliency in the analysis.
4. Methodology
We pursue a multi-method design with a content analysis of news articles for issue saliency and sentiment of each policy, and a temporal regression discontinuity design to test structural breaks in voter support at the introduction of economic climate policies. Here, we present a definition of key concepts and their operationalization (4.1), a description of the content analysis procedures (4.2), and details on the temporal regression discontinuity analysis (4.3).Footnote1
4.1. Operationalized definitions of key concepts and data sources
Government support is measured by the intention of voting for one of the governing parties as expressed by respondents in recurrent polls on the question ‘which party would you vote for if there was an election today?’. The sum of percentages for all governing parties constitutes the total government support. We collected the data from polling institutes in Sweden from January 2000 to August 2020 (Tullgren Citation2022). The data set is provided by Polls of Polls, is publicly available and includes the polling institutes Ipsos, Novus, SCB, Sifo, Skop, SVT, Demoskop and YouGov. All of which, except YouGov, uses random- or random panel sampling in their data collection. YouGov uses a self-recruited webpanel. See supplementary material for information about each polling institute.
The chosen Climate policies are policies that have been reported by the Swedish government to the European Commission, the United Framework Convention on Climate Change, or the European Environmental Agency (EEA). The policies were compiled by EEA as climate change mitigation policies and measures (PaM), and aim to reduce greenhouse gas emissions (European Environment Agency, Citation2018). We excluded the so-called information policies, categorized as ‘providing information’ or ‘educational’, as these policies do not imply any certain costs or direct benefits to people. We also excluded policies introduced before 2000 due to lack of monthly polling data. We compiled a data set of 21 Swedish economic and fiscal policies that address climate change.
Our chosen covariates follow the economic voting theory, according to which voters cast their ballot based on evaluations of the government’s economic results. Implying that if voters are satisfied with the current economic status in their country, they tend to reelect the incumbent, while if they are dissatisfied with the current economic situation, voters tend to punish the current officials (Jhencia et al. Citation2022). Previous research has used key economic variables to predict the outcome of elections, e.g. Linn et al. (Citation2010) and Kayser and Wlezien (Citation2011) found that a country’s economy had a growing effect on the voting decision in Europe. Hence, we collected data on unemployment, consumer price indices, household consumption, and consumer confidence from Statistics Sweden (SCB Citation2021). These are all recorded monthly. To account for systematic differences between polling institutes, we include information on the institutes as categorical controls.
4.2. Content analysis
A condition for self-interest voting to take place (through bounded rationality) is the awareness of an issue (Epstein and Segal Citation2000). To control voters’ awareness of policy introductions, we analyzed news articles from the Swedish press. First, we measured the salience of each climate policy by assessing its media coverage, following Epstein and Segal (Citation2000), who found that media coverage is a reliable indicator of issue saliency. For an overview of each policy’s media coverage, we counted news hits in the five largest Swedish newspapers (Dagens Nyheter, Aftonbladet, Expressen, Göteborgs-Posten, and Svenska Dagbladet), and the total number of articles in local and national media. The Mediearkivet Retriever database was used to collect the articles, using the policy name as the search word. The database holds articles published by all the Swedish newspapers. We excluded TV, Radio, and Webb TV.
Second, we analyzed a random sample of 5 articles for each of the 21 collected climate policies using sentiment analysis to determine the nature of the salience the policy had. To do so, we used a sentiment lexicon of 2068 Swedish words (Rouces et al. Citation2018). Words in the lexicon have been given sentiment polarities ranging from −3 to 3. Subsequently, we followed Silge and Robinson (Citation2017) and used their tidytext package in R to compute the total sum of sentiment scores per policy for our corpus of the five randomly selected full text news articles. We call the corresponding measure Polarity score. To measure how sentiment laden the entire reporting on a single policy is, we then calculated the ratio of sentiment laden word per policy and the total length of text written about it. We multiplied this ratio with the sentiment score to get at the relative sentiment for the news articles per policy and call that indicator Polarity ratio.
4.3. Temporal regression discontinuity design
To assess whether there are any structural breaks in government support after the introduction of climate policies, we employ a temporal regression discontinuity design, based on an adaptation of Hausman and Rapson (Citation2018). We implement a two-step procedure to make i) an informed model specification, and ii) apply the selected model to account for (residualized) level and/or slope changes following the introduction of climate policies. The logic of causal inference here is that the exact timing of introducing climate policies is quasi-random. There is a legislative process in the making, debates in government play out and plans may be announced to the public to test the water up front. However, there will be a remaining uncertainty for the general populace on a) whether the plans will be implemented, and b) when exactly (if at all), the legislation will be made. The identification strategy is therefore to treat the exact introduction date of the climate policy as quasi-random and assume that effects should only be observable after the act of legislation. That is to say, we would expect the main effect of introducing climate policies on government support to happen only after the legislation has actually been put in place. In principle, we estimate the following temporal regression discontinuity design (EquationEquation 1(1)
(1) ):-
Where GovernmentSupport is the intention to vote for one of the government parties, and the effect of PoliticalEvent such as introducing a policy, or an exogenous shock can be captured as a level change β1 or a slope change after treatment β3 with a general intercept α and residuals εt. In addition, we regress polynomials of the second order of TimeToTreatmentt on GovernmentSupportt to account for non-linear effects. Here, we follow Gelman and Imbens (Citation2019) and refrain from higher order polynomials.
In addition, we follow Hausman and Rapson (Citation2018) and consider the potential influence of covariates that may explain government support. To account for these, we run two-stage regressions, predicting government support from covariates such as unemployment, consumer confidence, household consumption, and consumer price index for the whole of an election period. Here, we take autoregressive stickiness into account and include a lagged outcome variable of six past polls, as well as polling institute-fixed effects (EquationEquation 2(2)
(2) ). We apply a forward selection of explanatory variables based on Akaike’s information criterion. In the second stage, we regress the remaining unexplained variance in government support, i.e. the residuals from the first stage onto the hypothetical discontinuity introduced by policy introduction (EquationEquation 3
(3)
(3) ).
To assess the general suitability of our methodological approach, and to make an informed decision on model selection, we apply a wide range of model specifications on a set of policies that should show a change in government support, such as elections (with and without a change of government), terror acts, and first Swedish health care policies under global COVID-19 pandemic. While the idea is akin to testing for placebo effects, here it is rather testing for known policy effects, to test whether our method can detect the signal sufficiently out of the noise. We also use these robustness-check models to test the suitability of higher order, i.e. 3rd order polynomials. In addition, we have varied the bandwidth around policy interventions to test the influence of the 90 + 90-day window before and after a policy. Results for 60 + 60, 120 + 120 days are reported in the supplementary material. We estimate the results in R version 4.3.2.
5. Results
We start our result section by presenting the content analysis, followed by the results of the temporal regression discontinuity analysis. The content analysis is carried out to test a necessary condition of an informed populace (see Theory), and if the reporting is framed in alignment with our stipulated hypotheses.
5.1. Sentiment and frequency of news articles
The content analysis is displayed in . In the fourth column ‘Frequency’, the number of news articles are reported. News hits for national articles are reported outside parentheses, and a total number of articles are presented within parentheses. We report the results from the lexicon-based sentiment analysis in the fifth and sixth columns. Column News polarity score indicates how value-laden the reporting was. For some policies, scores are close to 0, which indicates that the sentiment words balance out. For others, the values range from negative (−100, policy 10) to positive (162, policy 21). In the last column, Polarity Ratio, we report the results of the proportion of sentiment indicators per total number of words in the corresponding articles, to get a normalized sum of sentiments.
Table 1. Analysis of news articles in national and local newspapers.
5.2. Support for climate policies
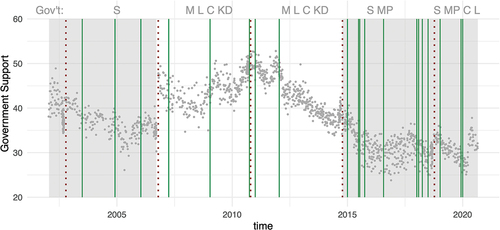
As two of the policies were introduced on the same date, 1 July 2018, we have a data set with 20 policy intervention dates that potentially could affect government support. displays the polling data on voter support for the government over time.
Figure 1. The development of government support over time in Sweden, with the introduction of environmental policies, and terms of government. Government support from polling data is displayed in gray dots, red dashed lines indicate elections, green lines indicate the timing of climate policy intervention, and the governing parties are on the top. Gray shades indicate terms with different party blocks in government. Legend for governing parties: –S - Social Democratic Party, –M - Moderate Party, –L - Liberals, –C - Centre Party, –KD - Christian Democrats, –MP - Green Party Source: own representation based on polling data.
indicate the analysis of the effects of the introduction of introducing climate policies onto government support. The general structure of the plots is that in panel a) the raw data is shown in dots, including predicted average government support based on first stage controls in red (see EquationEquation 2(2)
(2) ), the prediction uncertainty in gray, and the timing of introduced climate policies in green. Panel b) shows a 180-day window around the introduction of these climate policies with two functional specifications of the temporal regression discontinuity, with a linear regression in red and a polynomial regression of second order in blue, for both the raw data and based on the residuals remaining from overall voting period predictions based on controls from panel a). Panel c) shows the estimated coefficients including a 95% confidence interval for both the coefficients of level change and slope change, and the model specification for the coefficients, including linear, polynomial, and residualized models.
Figure 2. 2002–2006 effects of introducing climate policies on Swedish Government support. Panel a) raw data (gray dots), prediction (red line), and climate policies (green vertical lines), panel b) temporal regression discontinuity based on linear (red) and polynomial (blue) model for both raw and residualized regressions, and panel c) coefficients and 95% confidence interval for estimates of level and slope changes around the introduction of climate policies. Source: own representation.
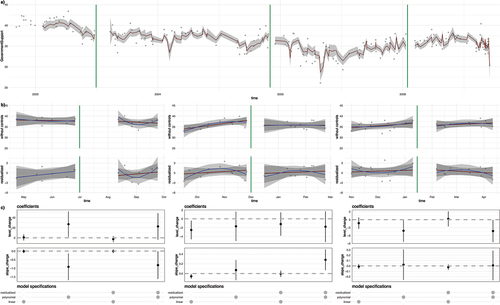
Figure 3. 2006–2010 effects of introducing climate policies on Swedish Government support. Panel a) raw data (gray dots), prediction (red line) and climate policies (green vertical lines), panel b) temporal regression discontinuity based on linear (red) and polynomial (blue) model for both raw and residualized regressions, and panel c) coefficients and 95% confidence interval for estimates of level and slope changes around the introduction of climate policies. Source: own representation.
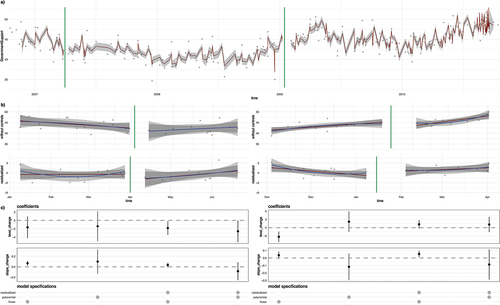
Figure 4. 2010–2014 effects of introducing climate policies on Swedish Government support. Panel a) raw data (gray dots), prediction (red line) and climate policies (green vertical lines), panel b) temporal regression discontinuity based on linear (red) and polynomial (blue) model for both raw and residualized regressions, and panel c) coefficients and 95% confidence interval for estimates of level and slope changes around the introduction of climate policies. Source: own representation.
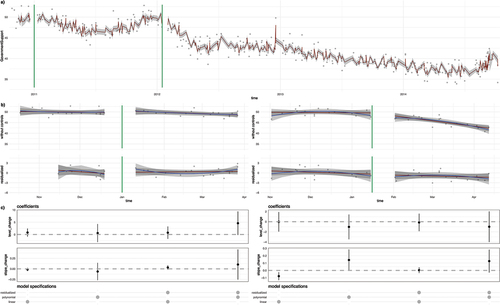
Figure 5. 2014–2018 effects of introducing climate policies on Swedish Government support. Panel a) raw data (gray dots), prediction (red line) and climate policies (green vertical lines); for policies that were to close to one another to apply a 90 day window, we looked at combined effect indicated by green shades; panel b) temporal regression discontinuity based on linear (red) and polynomial (blue) model for both raw and residualized regressions, and panel c) coefficients and 95% confidence interval for estimates of level and slope changes around the introduction of climate policies. Source: own representation.
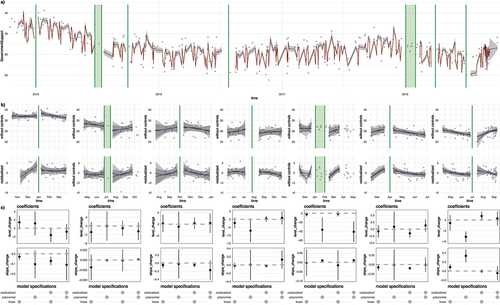
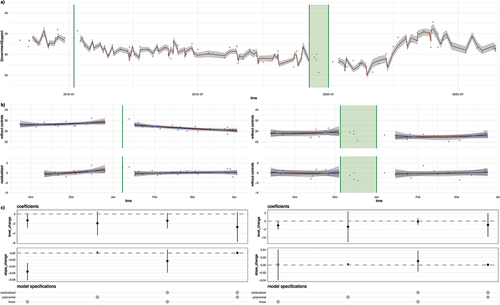
Figure 6. 2018–2021 effects of introducing climate policies on Swedish Government support. Panel a) raw data (gray dots), prediction (red line) and climate policies (green vertical lines); for policies that were too close to one another to apply a 90 day window, we looked at combined effect indicated by green shades; panel b) temporal regression discontinuity based on linear (red) and polynomial (blue) model for both raw and residualized regressions, and panel c) coefficients and 95% confidence interval for estimates of level and slope changes around the introduction of climate policies. Source: own representation.
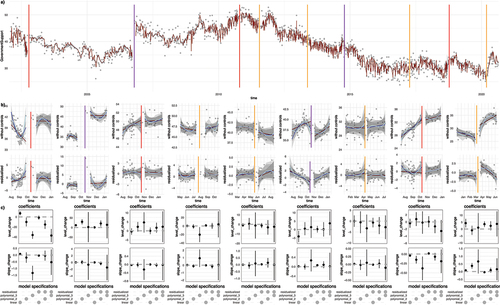
For robustness tests, we computed the same temporal regression discontinuity approach for a set of other political events such as elections and external shocks such as terror acts in 2011 Oslo and Utøya, the 2017 Stockholm terror, the 2013 riots, or the start of the 2021 global pandemic. Here, we additionally included a third-order polynomial to test for consistency across functional specifications. displays the corresponding results. As a guide, the reader can see how predicted government support generally developed in panel a). In panel b), we can see potential level or slope changes around each climate policy. A policy would have a significant effect on voter support if the confidence intervals around estimated coefficients would not cross zero in panel c). We are looking for causal estimates that are robust to different model specifications but can only find spurious effects. Thus, we generally estimate null results. We interpret these findings in the following section.
Figure 7. 2003–2021 robustness-checks tests of other policy events. Panel a) raw data (gray dots), prediction (dark red time series); selected events indicate election without change in coalition (red) and with governing coalition change (violet), external shocks such as terror acts or the beginning of Covid-19 policies (yellow); panel b) temporal regression discontinuity based on linear (red) and polynomial of second order (dark blue) and third order (light blue) model for both raw and residualized regressions, and panel c) coefficients and 95% confidence interval for estimates of level and slope changes around the introduction of climate policies. Source: own representation. Results for e.g. government change in 2006 (level change), re-elections of governing parties in 2018 (slope change) and begin of COVID-19 restrictions in 2020 (slope change) are robust across non-residualized linear and 2nd order polynomials.
6. Analysis
Regarding issue saliency, we tested that the policies were sufficiently discussed in the public sphere to warrant an informed electorate. The analysis in shows that the national news have reported rather extensively on most climate policies and if not at least a substantial share of local newspapers featured corresponding articles (except the Local investment program for climate, for which only five local newspapers reported). We can therefore assume that citizens who read news would likely have known about the introduction of climate policies. For our hypothesis, shows that on average, subsidies have a positive polarity score, and taxes indicate a negative polarity score (with a certain caveat that any policy directly targeting citizens is often portrayed as negative). Even though the results are somewhat ambiguous, they seem to be in line with previous research (Drews et al. Citation2016, Rhodes et al. Citation2017, He and Zhang Citation2018, Huber et al. Citation2020, Bergquist et al. Citation2022), arguing that policies with higher cost for the individual, receive less support by the public. Thus, the sentiment analysis results are generally in line with our hypotheses that taxes receive lower support (two out of four articles have negative scores), and subsidies receive higher support (12 of 16 articles have a positive sentiment score).
From the quantitative analyses of temporal regression discontinuities, we found that the introduction of climate policies has limited effects on government support. Across raw and residualized and linear and 2nd-degree polynomial regression models, there is no consistent effect for any of the policies. Based on the robustness checks we can however infer that raw regressions are better suited than the residualized ones, to capture effects that should be observable. We find significant effects of a level change for the government support around the 2006 election where the government changed, a negative slope change at the 2018 elections where the government stayed the same, and a slope change at the 2021 beginning COVID-19 restrictions in Sweden. 3rd order polynomials are generally too flexible to capture effects clearly. Even when exclusively examining the non-residualized models, we barely find consistently significant effects, leading us to a general Null result.
We can identify one single policy that had a positive effect on government support, a positive slope change for the 2018 introduction of the Bonus-Malus system. The policy provided a subsidy for hybrid or electric vehicles and an increased tax for purely gasoline or diesel cars. There was however a simultaneously introduced support for home charging stations but contrary to the Bonus-Malus policy (polarity score 30, ratio 0,008) upon which, the news reported largely negatively (polarity score −14, ratio −0,004) and there is still an effect.
From the robustness checks, we find that our method is in principle able to capture government support changes – at least for major political events such as changes in government in 2006 and 2018 or support for the government at the beginning of the pandemic. We can however not observe any major changes in government support that coincide with the introduction of climate policies, except for a single (positive) effect of supporting electric vehicles, which can be observed in 120- and 180-day windows around the policy (see Supplementary Material). Thus, we largely find a Null result for the effects of introducing climate policies on government support based on temporal regression discontinuities from 2003 to 2021 in Sweden. While questions about smaller effect sizes and effects on specific parties remain, we find no support for the hypothesis that governments are being sanctioned at the introduction of climate policies by the general constituency. Given the saliency of these policies in Swedish news reporting, we can exclude a lack of attention or knowledge to these issues as an explanation for a Null result.
7. Discussion
Both literature (e.g. List and Strum Citation2006, Harrison Citation2010, Carter Citation2018, Farjam et al. Citation2019) and popular beliefs tell us that governments can expect to be punished at the introduction of climate policies. However, we find no empirical support for such a hypothesis. So, we can conclude that this is not always the case.
For almost twenty years, Swedish governments have apparently not been ‘punished’ by voters at the introduction of climate policies. Whether Sweden is a typical case, or whether we are more or less likely to find any effects in Sweden, is up for discussion. On the one hand, Sweden is often described as a country with comparatively high levels of political trust and a constituency that is aware and concerned about climate change and would then potentially be less likely to punish their government for introducing such policies. On the other hand, Sweden, described as a forerunner, may be seen by its electorate as having already taken sufficient steps, potentially reducing acceptance of new climate measures. In addition, the study captures a time period where the Swedish electorate has become generally more volatile and are less loyal to a single party.
Under these favorable conditions, we cannot observe that Swedish voters punish their government at the introduction of climate policies. Even though we can identify no discernible effects on the introduction of climate policies on average government support, we do not analyze whether people like or dislike the climate policies as such. However, triangulation with framing in news-reporting generally supports the hypotheses. The analysis of salience and sentiment covers both the intensity and the positive or negative leaning in media reporting, and we get a sense of the public debate. Given that our method in principle captures large-scale shifts in government support, we find no empirical support for major shifts in intentions to vote stemming from the introduction of climate policies.
Potential explanation could be policy packaging (the one case where we observe a positive slope change combines a tax for combustion engines with a subsidy for electric cars). Another explanation could be that governments hedge against potential negative effects through strategic communication. But then the government should be able to obtain rewards from introducing policies such as subsidies that should increase voter support. Finally, one could argue that people are on average not as self-interested as the theory predicts or that their preferences for environmental quality outweigh their economic interests. Hence, voter support for the government could be driven by other factors than the rationalistic weighing of economic costs and benefits of specific policies. We cannot rule this out. Without rejecting theory, a remaining explanation could be effect heterogeneity among voter groups where potential effects of the introduction of climate policies are canceled out by a split in opinion in the constituency and some voter reward while others punish the government. Remaining explanations could be small effect sizes, or a low relative saliency of climate policies compared to other policies. Such questions could well be studied in future analyses.
8. Conclusion
Accelerating climate change calls for even more progressive policies and policy measures, we have clear examples of when introduced climate policies have faced severe backlash in terms of public protests. One of the most prominent examples being the Yellow Vests protests after the introduction of climate taxes in France in 2018. However, there is a risk that these conspicuous examples have too much of an inhibiting effect on politicians, who do not dare to put forward climate policy proposals. Our study shows that climate policy measures do not always lead to reduced voter support. Our study is limited to Sweden, and the policy measures analyzed primarily target emissions from the transport and energy sectors, with few directly targeting consumers. Hence, we lack insight into potential reactions to policy instruments aimed at emissions from sectors such as agriculture, and, for example, whether voters would react negatively to a government implementing a climate-driven tax on beef. Additionally, as discussed, there may be gradual effects where governments are not immediately punished for policy implementation, but rather a decreasing support over time. These effects are challenging to capture. Nonetheless, we encourage future research to undertake such investigations, where we believe that researchers and analysts making claims that voters punish governments for introducing climate policies bear the responsibility of providing evidence to support their claims.
This study contributes to the literature on climate policy introduction and government support in particular, and public opinion literature in general, by employing a temporal regression discontinuity design on polling data to analyze voter responses in the climate policy field. We are the first to test the relationship between climate policy introduction and government support with long time series data. We find, at least for the potentially black swan case of Sweden, that our analysis contradicts the hypothesis that introducing climate policies is punished by voters. The results can be encouraging for political leaders in the sense there are ways by either packaging, strategic communication, or by targeting specific voter groups to introduce climate policies without large political costs. At least under generally favorable conditions of an advanced and strong welfare state with an environmentally friendly populace. Thus, we would argue that governments may have room to maneuver and introduce climate policy instruments without risking re-election.
Supplemental Material
Download MS Word (1.5 MB)Acknowledgments
We received invaluable feedback at the GEPOP breakfast seminar (2022/12/02), the CEPS workshop (2022-12-16), the Energy System Lunch seminar at Chalmers University (2023-04-20), and Center for Collective Action Research (CeCAR).
Disclosure statement
No potential conflict of interest was reported by the author(s).
Data availability statement
The data and analytical code to replicate the quantitative results is available at https://zenodo.org/doi/10.5281/zenodo.11101302.
Supplementary Material
Supplemental data for this article can be accessed online at https://doi.org/10.1080/09644016.2024.2373606
Additional information
Funding
Notes
1. The analytical code as well data for replication can be found at https://zenodo.org/doi/10.5281/zenodo.11101302.
References
- Aardal, B. and Van Wijnen, P., 2005. 8 Issue Voting. In: Thomassen, Jacques, ed. The European voter: a comparative study of modern democracies. Oxford: Oxford Scholarship Online, 192–212. doi:10.1093/0199273219.003.0008
- Abou-Chadi, T. and Kayser, M.A., 2017. ’It’s not easy being green: why voters punish parties for environmental policies during economic downturns. Electoral Studies, 45, 201–207. doi:10.1016/j.electstud.2016.10.009
- Baccini, L. and Leemann, L., 2021. Do natural disasters help the environment? How voters respond and what that means. Political Science Research and Methods, 9 (3), 468–484. doi:10.1017/psrm.2020.25
- Bergquist, M., et al., 2022. Meta-analyses of fifteen determinants of public opinion about climate change taxes and laws. Nature Climate Change, 12 (3), 235–240. doi:10.1038/s41558-022-01297-6
- Best, H. and Kneip, T., 2011. The impact of attitudes and behavioral costs on environmental behavior: a natural experiment on household waste recycling. Social Science Research, 40 (3), 917–930. doi:10.1016/j.ssresearch.2010.12.001
- Bromley-Trujillo, R. and Poe, J., 2020. The importance of salience: public opinion and state policy action on climate change. Journal of Public Policy, 40 (2), 280–304. doi:10.1017/S0143814X18000375
- Burstein, P., 2003. The impact of public opinion on public policy: a review and an agenda. Political Research Quarterly, 56 (1), 29–40. doi:10.1177/106591290305600103
- Carter, N., 2018. The politics of the environment: ideas, activism, policy. 3rd ed. Cambridge: Cambridge University Press.
- Crawley, S., Coffé, H., and Chapman, R., 2020. Public opinion on climate change: belief and concern, issue salience and support for government action. The British Journal of Politics and International Relations, 22 (1), 102–121. doi:10.1177/1369148119888827
- Dalton, R.J., 2013. Citizen politics: public opinion and political parties in advanced industrial democracies. Washington DC: Cq Press.
- Davidovic, D., and Harring, N. 2020. Exploring the cross-national variation in public support for climate policies in Europe: The role of quality of government and trust. Energy Research & Social Science, 70, 101785.
- Dennison, J., 2019. A review of public issue salience: concepts, determinants and effects on voting. Political Studies Review, 17 (4), 436–446.
- Denver, D. and Hands, G., 1990. Issues, principles, ideology? How young voters decide. Electoral Studies, 9 (1), 19–36. doi:10.1016/0261-3794(90)90039-B
- Downs, A., 1957. An economic theory of democracy. New York: Harper & Row.
- Downs, A., 1972. Up and down with ecology-the issue attention cycle. Public Interest, 28 (Summer), 38–50.
- Drews, S., et al., 2016. What explains public support for climate policies? A review of empirical and experimental studies. Climate Policy, 16 (7), 855–876. doi:10.1080/14693062.2015.1058240
- Dzenis, S. and Nobre Faria, F., 2022. Combining ideology with narrow self-interest in positive political theory. Journal of Political Ideologies, 29 (2), 236–255. doi:10.1080/13569317.2022.2135254
- Ejelöv, E., et al., 2022. Push, pull, or info–m - an empirical taxonomy of environmental policy support in Sweden. Journal of Public Policy, 42 (3), 529–552. doi:10.1017/S0143814X21000271
- Ejelöv, E. and Nilsson, A., 2020. Individual factors influencing acceptability for environmental policies: a review and research agenda. Sustainability, 12 (6), 2404. doi:10.3390/su12062404
- Epstein, L. and Segal, J.A., 2000. Measuring issue salience. American Journal of Political Science, 44 (1), 66–83. doi:10.2307/2669293
- European Environment Agency, Climate change mitigation policies and measures (PaM) data. Available from: https://www.eea.europa.eu/data-and-maps/data/climate-change-mitigation-policies-and-measures-1/pam-table
- European Union, 2021. Special eurobarometer 513 climate change report summary. doi:10.2834/437. [Accessed 12 08 2021].
- Farjam, M., Olexandr, N., and Giangiacomo, B., 2019. Experimental evidence of an environmental attitude-behavior gap in high-cost situations. Ecological Economics, 166 (2019), 106434. Doi.10.1016/j.ecolecon.2019.106434
- Farstad, F.M., 2018. What explains variation in parties’ climate change salience? Party Politics, 24 (6), 698–707. doi:10.1177/1354068817693473
- Gaikwad, N., Genovese, F., and Tingley, D., 2022. Creating climate coalitions: mass preferences for compensating vulnerability in the world’s two largest democracies. American Political Science Review, 116 (4), 1165–1183. doi:10.1017/S0003055422000223
- Gampfer, R., 2014. Do individuals care about fairness in burden sharing for climate change mitigation? Evidence from a lab experiment. Climatic Change, 124, 65–77. doi:10.1007/s10584-014-1091-6
- Gelman, A. and Imbens, G., 2019. Why high-order polynomials should not be used in regression discontinuity designs. Journal of Business & Economic Statistics, 37 (3), 447–456. doi:10.1080/07350015.2017.1366909
- Hammar, H. and Jagers, S.C., 2006. Can trust in politicians explain individuals’ support for climate policy? The case of CO2 tax. Climate Policy, 5 (6), 613–625. doi:10.1080/14693062.2006.9685582
- Hanley, N. and Czajkowski, M., 2019. The role of stated preference valuation methods in understanding choices and informing policy. Review of Environmental Economics and Policy, 13 (2). doi:10.1093/reep/rez005
- Harrison, K., 2010. The comparative politics of carbon taxation. The Annual Review of Law and Social Science, 6 (1), 507–529. doi:10.1146/annurev.lawsocsci.093008.131545
- Harrison, K., 2012. A tale of two taxes: the fate of environmental tax reform in Canada. The Review of Policy Research, 29 (3), 383–407. doi:10.1111/j.1541-1338.2012.00565.x
- Hausman, C. and Rapson, D.S., 2018. Regression discontinuity in time: considerations for empirical applications. Annual Review of Resource Economics, 10 (1), 533–552. doi:10.1146/annurev-resource-121517-033306
- He, P. and Zhang, B., 2018. Environmental tax, polluting plants’ strategies and effectiveness: evidence from China. Journal of Policy Analysis and Management, 37 (3), 493–520. doi:10.1002/pam.22052
- Holmberg, S., et al., 2022. Väljarna avgör. Stockholm: Sveriges Television AB.
- Hornsey, M., Harris, J.E., and Fielding, K., 2018. Relationships among conspiratorial beliefs, conservatism and climate skepticism across nations. Nature Climate Change, 8 (7), 614–620. doi:10.1038/s41558-018-0157-2
- Huber, A.R., Wicki, L.M., and Bernauer, T., 2020. Public support for environmental policy depends on beliefs concerning effectiveness, intrusiveness, and fairness. Environmental Politics, 29 (4), 649–673. doi:10.1080/09644016.2019.1629171
- IPCC, 2021. Climate change 2021: the physical science basis. Contribution of working group I to the sixth assessment report of the intergovernmental panel on climate. In: Masson-Delmotte, V., P. Zhai, A. Pirani, S.L. Connors, C. Péan, S. Berger, N. Caud, Y. Chen, L. Goldfarb, M.I. Gomis, M. Huang, K. Leitzell, E. Lonnoy, J.B.R. Matthews, T.K. Maycock, T. Waterfield, O. Yelekçi, R. Yu, and B. Zhou, eds. Cambridge, United Kingdom and New York, NY, USA: Cambridge University Press. doi:10.1017/9781009157896.
- Jakobsson, C., Fujii, S., and Garling, T., 2000. Determinants of private car users’ acceptance of road pricing. Transport Policy, 7 (2), 153–158. doi:10.1016/S0967-070X(00)00005-6
- Jhencia, M.L.J., Villacorta, J.M.D., and Camaro, P.J.C., 2022. Economic voting theory in the Philippines. Journal of Economics, Finance and Accounting Studies, 4 (1), 184–202. doi:10.32996/jefas.2022.4.1.12
- Jones, B.D., 1999. Bounded rationality. Annual Review of Political Science, 2 (1), 297–321. doi:10.1146/annurev.polisci.2.1.297
- Kallbekken, S. and Sælen, H., 2011. Public acceptance for environmental taxes: Self-interest, environmental and distributional concerns. Energy Policy, 39 (5), 2966–2973. doi:10.1016/j.enpol.2011.03.006
- Kayser, M.A. and Wlezien, C., 2011. Performance pressure: patterns of partisanship and the economic voter. European Journal of Political Research, 50 (3), 365–394. doi:10.1111/j.1475-6765.2010.01934.x
- Klüver, H. and Sagarzazu, I., 2016. Setting the agenda or responding to voters? Political parties, voters and issue attention. West European Politics, 39 (2), 380–398. doi:10.1080/01402382.2015.1101295
- Krosnick, J.A., et al., 2006. The origins and consequences of democratic citizens’ policy agendas: a study of popular concern about global warming. Climatic Change, 77 (1–2), 7–43. doi:10.1007/s10584-006-9068-8
- Ladrech, R. and Little, C., 2019. Drivers of political parties’ climate policy preferences: lessons from Denmark and Ireland. Environmental Politics, 28 (6), 1017–1038. doi:10.1080/09644016.2019.1625157
- Levin, K., et al., 2012. Overcoming the tragedy of super wicked problems: constraining our future selves to ameliorate global climate change. Policy Sciences, 45 (2), 123–152. doi:10.1007/s11077-012-9151-0
- Linn, S., Nagler, J., and Morales, A.M. 2010. Economics, elections, and voting behavior’. In: J. E. Leighley, ed. The oxford handbook of American elections and political behavior. Online Oxford: Oxford University Press, 375–396. doi:10.1093/oxfordhb/9780199235476.003.0020
- List, J. and Strum, D., 2006. How elections matter: theory and evidence from environmental policy. Quarterly Journal of Economics, 121 (4), 1249–1281. doi:10.1162/qjec.121.4.1249
- MacDonald, P.K., 2003. Useful fiction or miracle maker: the competing epistemological foundations of rational choice theory. The American Political Science Review, 97 (4), 551–565. doi:10.1017/S000305540300087X
- Oscarsson, H., 2020. Flytande väljare 2018. Valforskningsprogrammets rapportserie 2020:10. Göteborgs Universitet: Statsvetenskapliga Institutionen.
- Raile, E.D., et al., 2014. Defining public will. Politics & Policy, 42 (1), 103–130. doi:10.1111/polp.12063
- Rhodes, E., Axsen, J., and Jaccard, M., 2017. Exploring citizen support for different types of climate policy. Ecological Economics, 137, 56–69. doi:10.1016/j.ecolecon.2017.02.027
- Rouces, J., et al., May 2018. SenSALDO: creating a sentiment lexicon for Swedish. Proceedings of the Eleventh International Conference on Language Resources and Evaluation (LREC 2018), Miyazaki (Japan).
- Sarasini, S., 2009. Constituting leadership via policy: Sweden as a pioneer of climate change mitigation. Mitigation and Adaptation Strategies for Global Change, 14 (7), 635–653. doi:10.1007/s11027-009-9188-3
- SCB. 2021. Finding statistics. SCB. Available from: https://www.scb.se/en/finding-statistics/
- Schumacher, I., 2014. An empirical study of the determinants of green party voting. Ecological Economics, 105, 306–318. doi:10.1016/j.ecolecon.2014.05.007
- Shabman, L. and Stephenson, K., 1994. A critique of the self-interested voter model: the case of a local single issue referendum. Journal of Economic Issues, 28 (4), 1173–1186. doi:10.1080/00213624.1994.11505616
- Shi, J., Visschers, V.H.M., and Siegrist, M., 2015. Public perception of climate change: the importance of knowledge and cultural worldviews. Risk Analysis, 35 (12), 2183–2201. doi:10.1111/risa.12406
- Silge, J.and Robinson, D., 2017. In: Tache, N., ed. Text mining with R: a tidy approach. Sebastopol, California: O’Reilly Media Inc.
- Simon, H.A., 1990. Bounded rationality. In: J. Eatwell, M. Milgate, and P. Newman, eds. Utility and probability. London: Palgrave Macmillan, 15–18.
- Söderpalm, P. and Wennö, J., 2019. Mediebild, opinion och faktakoll i klimatfrågan. Stockholm: Kantar Sifo.
- Stadelmann, D., Torgler, B., and Mesoudi, A., 2013. Bounded rationality and voting decisions over 160 years: voter behavior and increasing complexity in decision-making. PLOS ONE, 8 (12), e84078. doi:10.1371/journal.pone.0084078
- Tobler, C., Visschers, H.M.V., and Siegrist, M., 2012. Addressing climate change: determinants of consumers’ willingness to act and to support policy measures. Journal of Environmental Psychology, 32 (3), 197–207. doi:10.1016/j.jenvp.2012.02.001
- Tufte, E.R., 1978. Political control of the economy. Princeton, N.J: Princeton University Press.
- Tullgren, 2022. Poll of polls. Available from: http://pollofpolls.se/ [Accessed January 2022].
- Turaga, R.M.R., Howarth, R.B., and Borsuk, M.E., 2010. Pro‐environmental behavior: rational choice meets moral motivation. Annals of the New York Academy of Sciences, 1185 (1), 211–224. doi:10.1111/j.1749-6632.2009.05163.x
- Wolf, M.J., et al. 2022. 2022 environmental performance index. New Haven, CT: Yale Center for Environmental Law & Policy. Available from: epi.yale.edu
- Wynes, S. and Kimberly, A.N., 2017. The climate mitigation gap: education and government recommendations miss the most effective individual actions. Environmental Research Letters, 12 (7), 074024. 10.1088/1748-9326/aa7541
