
 ?Mathematical formulae have been encoded as MathML and are displayed in this HTML version using MathJax in order to improve their display. Uncheck the box to turn MathJax off. This feature requires Javascript. Click on a formula to zoom.
ABSTRACT
The accession of Eastern European countries to the European Union increased family wealth and the returns to schooling. I analyze the change in student achievement due to the EU accession of Eastern Europe building on a panel of six PISA waves covering more than 1 million students in 32 countries. Using a difference-in-differences approach, I find a positive and statistically significant link of EU membership to reading scores by one tenth of a standard deviation. The effect seems robust to including controls from the human capital production function.
KEYWORDS:
1. Introduction
Euroscepticism continues to increase, highlighted by the Brexit vote and their increasing vote shares of nationalistic parties across Europe. Yet, research agrees on the economic benefits of European Union (EU) membership at the country level (Darvas Citation2018)Footnote1 and at the individual-level (Sinn et al. Citation2001; Crespo Cuaresma, Ritzberger-Grünwald, and Silgoner Citation2008; Dobson Citation2009; Baldwin and Wyplosz Citation2012).Footnote2 However, empirical evidence on the effect of EU membership on adolescents is scarce. This paper examines the consequences of EU accession of Eastern European countries on student achievement and suggests a positive influence of EU membership on student skills.
One might expect an effect on education from the EU accession of Eastern Europe due to two channels: economic and political changes.Footnote3 The economic channel introduced free trade in the EU and expanded possibilities to generate wealth.Footnote4 As Western EU countries experience a shortage in lower-skilled labor which may be filled by labor from Eastern EU countries, labor demand for workers from the East rises, and employment opportunities arise at higher wages than in the Eastern home countries. Hence, returns to education increase (Fleisher, Sabirianova, and Wang Citation2005; Farchy Citation2009; Anniste et al. Citation2012; Botezat and Pfeiffer Citation2014; Staneva and Abdel-Latif Citation2016).Footnote5 As a consequence of higher individual wealth, children may perform better in school as there are more possibilities to support educational expenditures, such as tuition fees or learning materials.Footnote6 Yet, more parental employment may come at cost of family time in which children and adults interact. Some parents could leave their families and migrate for work. This may decrease student achievement (Banerji, Berry, and Shotland Citation2013; Bergman Citation2014).Footnote7 In sum, it is unclear how increased parental employment due to EU membership may affect student achievement.
The political channel of EU membership impacting student achievement works through changed education institutions. The EU provides funding and imposes standards on education processes aimed at raising efficiency and increasing fairness in policy making by implementing the Copenhagen Criteria and employing the EU’s soft coordination reciprocal report system (European Council Citation2017).Footnote8 Between 2000 and 2015, policies aimed at increasing school efficiency expanded in all European countries, such as greater local school autonomy in decision making or central standardized student testing to impose accountability (Hanushek, Link, and Woessmann Citation2013; Bergbauer, Hanushek, and Woessmann Citation2018). In sum, EU membership shapes national education policies which may improve student achievement.
To investigate the effect of EU membership on student achievement, I build a country panel from six waves over 15 years of the Programme for International Student Assessment (PISA). My sample contains 1,073,652 students in 32 countries.Footnote9 The successive entry of eleven Eastern European countries between 2004 and 2013 offers an ideal setting for a difference-in-differences approach.Footnote10 Hence, I regress student achievement on a dummy of EU membership. In the search for mechanisms through which EU membership affects student achievement, I take two steps. First, I use the inputs in a human capital production functionFootnote11 as alternative outcomes to the treatment of EU membership to verify whether they are affected by the treatment and thus are ‘bad controls’ in the sense of Angrist and Pischke (Citation2009) or not.Footnote12 Second, I use the inputs as covariates in the main specification of regressing student achievement on EU membership. As a result, I retrieve explorative, non-causal evidence on the robustness of the treatment. The main specification yields a positive and significant estimate of EU membership on student achievement by a tenth of a standard deviation (SD). This equals about three months of learning (Schütz, Ursprung and Wößmann Citation2008). Using inputs in the human capital production function as controls in the main specification yields no substantial change in the coefficient of EU membership. Hence, the effect of EU membership on student achievement is robust to including covariates. The model also withstands further robustness test, such as endogeneity, sample composition, and an alternative specification of the fixed effects.
This analysis relates to the literature on the educational production (Hanushek Citation1970, Citation1979; Hanushek and Woessmann Citation2011). I study institutional determinants of student achievement, because EU membership may be regarded as institutional, non-resource determinant shaping education processes and policy making. Accordingly, institutions enter as input to human capital measured by test scores. Most evidence on institutions as determinant of student achievement originates from cross-country analyses (for an overview, see Woessmann Citation2016). This paper also takes a cross-sectional perspective in examining the effect of EU membership of Eastern European countries on student achievement.
The paper continues as follows: In Section 2, I present background information on the influence of EU membership on education in Eastern Europe. Section 3 introduces the data, followed by the description of the empirical strategy in Section 4. The results are presented in Section 5 – divided into main results and mechanisms as outcomes and as covariates. Section 6 reports robustness checks and Section 7 concludes.
2. Impact of EU membership on education
EU membership could affect educational outcomes of adolescents in Eastern Europe through both, economic and political, channels. A Process of Stabilization and Association installs the Copenhagen Criteria comprising democracy, rule of law, and human rights (European Council Citation2017). To translate these criteria into practice, Eastern European institutions have reduced corruption making processes more just and providing freedom of choice in travel, work, study, investment, and retirement (Nikolova and Nikolaev Citation2017). Then a country accesses the EU by the Treaty of Membership. This membership allows for a single market with free trade and free flow of capital and labor and employment in the Eastern entrant countries increased.Footnote13 For example, employment rates in the Eastern EU-entrant countries increased from 68% to 73%, between 2000 and 2017 (Eurostat Citation2018b). Some countries introduced the Euro currency (Halász Citation2015).Footnote14 Overall, economic development has been built on small business, foreign direct investment and trade, employment regulations, policy facilitation, and structural funds (Nikolova and Nikolaev Citation2017).Footnote15 Hence, EU membership advanced political institutions and economic development in general which augmented individual wealth in turn. As a result, one would expect wealthier families lead to academically higher achieving children.
Education policy in particular is influenced by EU membership, primarily through soft coordination.Footnote16 The central instrument is the Education and Training framework, most recently ET 2020 that incentivizes member states to cooperate (OECD Citation2015, Citation2016a, Citation2016b). For example, one of the ET 2020 goals aims at a minimum of 40% of people aged 30–34 having completed higher education in each member state. To achieve this higher education goal, preceding education levels need to provide quality education. As a result, higher quality at all levels of education may increase with EU membership. Another EU education policy is the provision of extensive funding, e.g. the European Social Fund (ESF) for investments into human capital, such as teacher training or new school curricula (European Commission Citation2013).Footnote17 As a result, more school resources (efficiently used) may increase the academic performance of EU entrants.
Overall, EU membership affects education in Eastern Europe politically through more efficient institutions and economically through increasing funding and individual wealth. Hence, one would expect an increase in student achievement from EU membership.
3. Data
I use six waves of the Programme for International Student Assessment (PISA), conducted every three years between 2000 and 2015 (OECD Citation2018). The survey tests 15-year-old students independently of the educational institution or grade they attend. Students’ competencies in the subjects reading, math, and science are elicited by a two-hour test of tasks varying in difficulty. Using item response theory, achievement in each domain is plotted on a scale with student achievement to a mean of 500 points and a standard deviation of 100 points.Footnote18 Countries employ a two-stage sampling design. First, they draw a random sample of schools in which 15-year-old students are enrolled (with sampling probabilities proportional to a school’s number of 15-year-old students). Second, they randomly sample 35 students of the 15-year-old students in each school. The aim is to ensure random sampling of schools and students and to monitor testing conditions in participating countries. I exclude countries that do not meet the standards.Footnote19 PISA does not follow individual students over time, but the repeated testing of representative samples of students creates a panel structure for countries observed every three years. I consider all European countries with and without EU membership.Footnote20 I require countries to participate at least three out of six waves, to deduce meaningful comparisons over time. My final sample contains 1,073,652 students in 32 countries. Summary statistics are displayed in Appendix Table 1 and the frequency with which a country participated in PISA is displayed in Appendix Table 1.
In the following, I present the variables which are considered as outcome and control variables commonly used in the literature. Student test score is the main outcome variable and varies between 2000 and 2015 for each Eastern European country. For example, the reading score is shown in .
Figure 1. Evolution of reading achievement in Eastern Europe.
Note: The figure shows the demeaned reading score for each Eastern European entrant in each survey wave between 2000 and 2015. The score was demeaned by the average of all 32 countries in the sample. The red, dashed, vertical line signals the 2004 entries of the Czech Republic, Estonia, Hungary, Lithuania, Latvia, Poland, the Slovak Republic, and Slovenia. The green, dashed, vertical line indicates the 2007 entries of Bulgaria and Romania. The blue, dashed, vertical line designates the 2013 entry of Croatia. Country abbreviations stand for: Bulgaria (BGR), the Czech Republic (CZE), Estonia (EST), Croatia (HRV), Hungary (HUN), Lithuania (LTU), Latvia (LVA), Poland (POL), Romania (ROU), the Slovak Republic (SVK), and Slovenia (SVN).
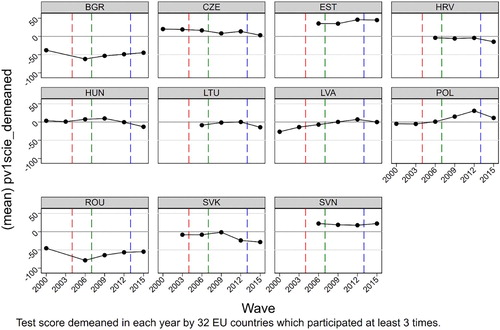
Bulgaria, Romania, and Hungary, in particular, experienced large changes. The top-performing Eastern European countries are Estonia and Poland scoring at the level of the Netherlands, while weak-performing Eastern European countries are Bulgaria and Romania scoring between non-EU members Montenegro and Serbia.
Following the education production function formulated by Hanushek (Citation1970, Citation1979) and Hanushek and Woessmann (Citation2011), I aim at including control variables at the student, parent, family, school, and country level. At the student level, I examine student gender, age, and migrant background. At the parent level, I consider the parental background as reported in the student questionnaires. I observe whether at least one parent was born abroad and the highest education level of both parents categorized by the International Standard Classification of Education (ISCED) into no education, primary, lower secondary, upper secondary I, upper secondary II, or university. Parental work status could be full time, part time, searching, or other. The item was not asked in 2006 and not in 2015, which I impute at the country level to maintain the sample size.Footnote21 The type of parental occupation is documented in the International Standard Classification of Occupations (ISCO) in nine gradings (manager, professional, technician, clerical, services and sales, skilled agriculture/ forestry/ fishing, craft and trade, plant and machine operator, and elementary), which was asked in every wave.
At the family level, I use wealth and family composition. Family wealth is represented by four items. First, I exploit the student background questionnaire to capture family wealth by the survey’s index of consumer goods constructed from an own room, access to the internet, number of phones, TVs, computers, cars, bathrooms, and DVD players. The family wealth index is provided in every survey wave. Second, I use the survey index cultural goods consisting of literature books, poetry, and art work. The cultural goods index was asked every year except in 2009, which I impute at the country level. Third, I use the number of books at home in five categories: 0–10, 11–100, 101–200, 201–500, and more than 500 books. The books variable was gathered every year. Lastly, I employ the home educational resources index consisting of a study desk, a quiet study place, a computer for school work, educational software, books for school work, technical reference books, and a dictionary. The home educational resource index was constructed in every survey wave. To capture family structure, I use the student item ‘Who lives in your home?’ and create binary variables for single mother, single father, or no parents, but living with sisters, brothers, grandparents, or other individuals.Footnote22 It was asked in 2000, 2003, 2009, and 2012. Hence, I impute the waves 2006 and 2015 at the country level.
At the school level, I use the following items from the principal questionnaire: city size in five categories in which the school is located (village of less than 3,000 inhabitants; town of 3,000–15,000; large town of 15,000–100,000; city of 100,000–1,000,000; and large city of more than 1 million), private or public operator, number of students, share of government funding, shortage of math teachers, share of fully certified teachers, and degree to which teacher absence is a problem in four categories (not at all, a little, some, a lot). In 2006, teacher absence was not asked and I impute it.Footnote23
At the country level, I use the share of schools with academic-content autonomy and its interaction with initial GDP per capita (Hanushek, Link, and Woessmann Citation2013) because one expects better information locally instead of centrally dependent on the level of development of a country. To capture school accountability, I employ the share of schools in a country using different forms of student test, such as (i) school-based tests for external comparison, (ii) student-based tests for external comparison, (iii) standardized monitoring, (iv) internal testing, and (v) internal teacher monitoring. These measures were developed by Bergbauer, Hanushek, and Woessmann (Citation2018). Lastly, I consider expenditure on education as a share of GDP from the World Bank of which I impute missing values at the country level (World Bank Citation2018).
4. Empirical strategy
I use a difference-in-differences approach on a country panel over time to identify the effect of EU membership on student achievement. The estimation equation follows Hanushek, Link, and Woessmann (Citation2013) and Bergbauer, Hanushek, and Woessmann (Citation2018):(1)
(1) The dependent variable
is student achievement of student i in country c at time t. Given the resampling design of the PISA study in each wave of the 15-year old population of a country, I create a repeated cross-sectional structure.Footnote24 The variable of interest is
. and takes the value zero for a country c in time t which is not a member of the EU, and the value one for member states. The matrix
contains student level covariates i in time t. Country-fixed effects μc account for unobserved time-invariant country characteristics, such as higher education funding in one country compared to another country. Time-fixed effects μt account for period-specific factors, such as a Europe-wide trends towards more education. εict is an individual-level error term clustered at the country level which is the treatment level. To shows that results are robust despite the small number of clusters (32), I bootstrap standard errors for the main results following Cameron, Gelbach, and Miller (Citation2008).Footnote25 Regressions are weighted by final students’ sampling probabilities within countries, giving equal weight to each country-by-wave cell across countries and waves.
Equation (1) identifies estimates of β from country-level variation over time. The coefficients are unaffected by systematic, time-invariant differences across countries. Hence, countries that do not change their EU membership status in the observation period do not contribute to the estimation of the coefficient β. This difference-in-differences approach builds on four assumptions.
First, the common trends assumption necessitates countries to evolve in student achievement in the same way in the absence of the treatment. This means that if one of the Eastern European countries would not have entered the EU, student achievement would have evolved over time in the same fashion as the control group of countries which did not change their membership status, i.e. the always and the never members. One advantage of the difference-in-differences approach is that EU membership does not need to be random, only the assumption of parallel trends needs to hold.
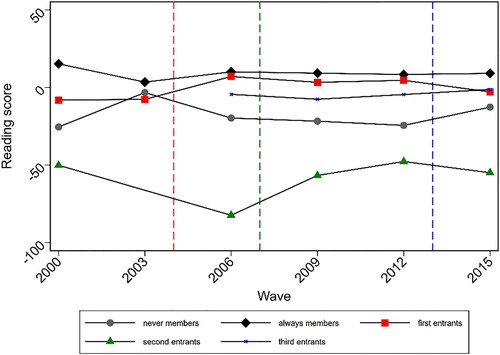
displays test score trends decomposed according to control groups and treatment groups. Control groups divide into permanent EU members (black markers) and permanent non-EU members (gray markers). Treatment groups divide into the three accession waves (red markers for 2004, green markers for 2007, and blue markers for 2011). The figure suggests parallel trends.Footnote26
Figure 2. Parallel trends of reading score by treatment and control group.
Note: The graphs depict the evolution of the demeaned reading score over time in the different treatment and control groups. The reading score was demeaned by the sample average to absorb time trends. The treatment group composes of the red markers indicating the first round of EU entrants, the green markers for the second round, and the blue markers for the third round. The control group consists of the black markers standing for permanent EU members, and the gray markers for permanent non-EU members. The figure shows the reading score in each survey wave between 2000 and 2015. The red, dashed, vertical line signals the 2004 entries. The green, dashed, vertical line indicates the 2007 entries. The blue, dashed, vertical line designates the 2013 entry. The first group of EU entrants contains the Czech Republic, Estonia, Hungary, Lithuania, Latvia, Poland, the Slovak Republic, and Slovenia; the second group includes Bulgaria and Romania; and the third entrants group is formed by Croatia. Permanent EU members are Austria, Belgium, Denmark, Finland, France, the United Kingdom, Greece, Ireland, Italy, Luxembourg, the Netherlands, Portugal, and Sweden. Permanent non-EU members are Albania, Iceland, Montenegro, Norway, and Serbia.
Second, the stable unit treatment variable assumption denies spillovers from treated to untreated countries, i.e. student achievement changes without the change of a country’s EU membership status. For example, the comparison group of non-EU Eastern European countries invests less in skills because they expect to succeed low-skilled labor in the new Eastern EU members states. For example, the Ukrainian plumber replaces the Polish plumber instead of the Ukrainian becoming a financial accountant because the Polish plumber emigrated to work in Germany. Another case of untreated countries reacting to the EU accession of Eastern Europe occurs if original Western EU members decrease in academic performance due to expecting to hire highly qualified labor from Eastern EU- Europe. This may be the case for Hungarian medical doctors working in Germany, but is seems unlikely to occur on a large scale because Western EU-Europe’s competitive advantage relies on highly qualified human capital.
Third, the population composition remains constant. If individuals migrate between countries and select into or out of treatment, the assignment is not random. For example, if families of low socio-economic background with low student achievement emigrate from their Eastern European countries and the remaining population is of high socio-economic background with high student achievement, my analysis will be upward biased. I will address this concern in Section 6.2, where I show my analysis robust to migration background by including only native students, i.e. keeping the population constant by including only students born in their testing countries.
Fourth, there are no country-specific changes over time in unobservables between treatment and control, such as economic shocks or improving school quality to one group. For example, if the Czech Republic introduced a policy to support school children of low-socio economic status, estimates would be biased. Hence, I condition the analysis on various school and institutional measures; such as school resources, teacher background, school autonomy and accountability, and government funding. Results are reported in Section 5.3. Further robustness checks on this assumption are shown in Section 6.
5. Results
This section first reports the main results on the impact of EU membership on student achievement in Eastern Europe, in Sub-Section 5.1. In the search for mechanisms through which EU membership affects student achievement, I test several inputs of the human capital production function in two steps. First, in Sub-Section 5.2, I employ the inputs as outcome to EU membership to detect variables influenced by the treatment, i.e. bad controls in the sense of Angrist and Pischke (Citation2009). Second, in Sub-Section 5.3, I employ the inputs as controls to the effect of EU membership on student achievement with caution to the bad controls which yield non-causal, explorative evidence.
5.1. Main results on the effect of EU membership on student achievement
shows the estimation results of the main specification in the country panel model without any controls on student, family, school, or country level.
Table 1. Main result – the effect of EU membership on student achievement.
Standard errors are clustered at the country level throughout. The dependent variable is the test score in one of the three subjects: reading, math, and science. Columns 1, 3, and 5 show the base model without fixed effect and without controls on student, family, school, or country level. Columns 2, 4, and 6 show the model with time- and country-fixed effects and without controls. The coefficient of EU member suggests that entering the EU is related to a statistically significant increase in reading achievement at the five percent level. The effect magnitude is a quarter of a standard deviation for the base model and a tenth of a standard deviation when applying country- and time-fixed effects. This equals about three months of learning (Schütz, Ursprung and Wößmann Citation2008). The point estimate of EU membership on math achievement is of similar magnitude in the base and in the fixed-effects model compared to reading achievement, but it is not statistically significant. In contrast, the EU-membership coefficient on science achievement in the base model is of similar magnitude and significance compared to reading achievement, but the EU-membership coefficient is not statistically significant, small, and negative in the fixed-effects model. This difference across subjects may be due to universally applicable numeracy skills opposed to language- and country-specific literacy skills or due to measurement error. Overall, there is no significant difference between the subjects and the effect size is similar for reading and math. In the following, I concentrate on reading achievement.
To address concerns on the low number of clusters (32), I wild-bootstrap standard errors 1,000 times and report p-values in square brackets below the clustered standard errors. As expected, significance levels decline, but the pattern remains: estimates of EU membership on reading are significant in the fixed-effects model, but not on math or science. Overall, the main specification suggests a positive effect of EU membership on student achievement.
5.2. Results on the effect of EU membership on alternative outcomes
This sub-section documents the influence of EU membership on several inputs of the human capital production function. This exercise aims at determining whether potential mechanisms through which EU membership may affect student achievement were influenced by the treatment themselves and would be ‘bad controls’ in the sense of Angrist and Pischke (Citation2009) or whether they are not related to the treatment and would be ‘good controls’.
The three key student characteristics – age, gender, and migrant background – are shown in . The point estimates of EU membership seem unrelated to student gender and age. This is plausible, as tested students were born fifteen years prior to the study and parental fertility preferences seem unlikely to be influenced by EU membership in advance. Migration background seems to be significantly negatively related to EU membership with 3.4 percentage points. This suggests that migration from other countries to Eastern Europe has decreased due to EU membership. In contrast to the EU’s aim of increasing the population’s mobility, fewer migrants entering Eastern European member states may be due to relocating the EU’s external borders with stricter border controls on the Balkan.
Table 2. The effect of EU membership on student characteristics.
reports the effect of EU membership on parental characteristics. In Panel A, parental migration seems to be significantly reduced by EU membership by the same magnitude as of students (3.5 percentage points) which suggests joint migration of children and parents. Parental education is displayed in Columns 2–7. Lower levels of parental education seem unaffected by EU membership as it was likely to be completed before EU membership. Higher levels of education seem to decrease with EU membership by three to seven percentage points which may be due to increased returns to schooling.Footnote27 Thus, parents may be incentivized to work instead of attending university. This is in line with research from Norway, where the unexpected discovery of oil resources increased returns to lower education and decreased educational attainment (Bütikofer, Dalla-Zuanna, and Salvanes Citation2017). Panel B reports estimation results for parental work status. For mothers, the coefficient of EU membership is never significant but it is significant for fathers working full time or looking for work. Hence, EU membership seems to have increased paternal full time work and to have decreased paternal search for work. Panel C reports estimation results for parental occupation and suggests that parents were significantly less employed as professionals by 2.7 percentage points and more as clericals by 1.5 percentage points, in services and sales by 1.8 percentage points, and in elementary jobs by 1.8 percentage points.
Table 3. The effect of EU membership on parental characteristics.
Overall, suggests a decrease in parental migration and a decrease in parental higher education, while fathers seem to work more and parents work in lower-status occupations. These results are in line with expectation one of Western EU Europe demanding lower-qualified labor.
reports estimation results of the impact of EU membership at the family level. In Panel A, family wealth seems to rise with EU membership with a significant increase in ownership of consumer goods by 18 percentage points, while cultural goods decline by a similar magnitude. Additionally, the EU membership coefficient suggests a highly significant decrease in having more than 100 books at home by two to seven percentage points. In contrast, the EU membership coefficient is insignificant for educational resources. This surprising result suggests a shift in consumer preferences towards an expansion of status goods at the cost of intellectual goods. This shift may be due to a relative price effect through access to the EU market. Panel B shows estimates on the family structure suggesting that entering the EU is related to a significant increase in single parents by 3.1 percentage points for mothers and 1.4 percentage points for fathers. EU membership seems to significantly increase the share of children living without any parent by 1.5 percentage points. Hence, EU membership created Euro orphans. Previous studies on Eastern Europe have shown that child wellbeing deteriorates when parents migrate for work to other EU countries (Levai et al. Citation2018). Overall, EU membership seems to have increased status goods at the cost of intellectual goods and seems to have disrupted families.
Table 4. The effect of EU membership on family characteristics.
shows results at the school level and Panel A suggests that entering the EU is related to an increase in schools located in villages by 3.8 percentage points and a decrease in towns by 3.9 percentage points and in large towns by 6.6 percentage points. This shift to the countryside is consistent with international goals of increasing access to schools in remote rural areas (see the Millennium Development Goal No. 2). Panel B reports results on school resources, which were likely increased by EU funding. The point estimate of EU membership suggests a reduction in the number of students per school by 11.5% and a decline in math teacher shortages by 5.4 percentage points. This suggests an improvement in school resources. Whether the resources were transformed effectively into student learning is examined in Section 5.3, where school resources are employed as covariates to the effect of EU membership on reading achievement. Other school characteristics, such as private or public operation, the share of the government budget, the share of certified teachers, and problems with absents teachers show no significant link to EU membership. In sum, EU membership seems to have improved school characteristics by providing more rural schooling in smaller schools and with fewer issues with teacher shortages.
Table 5. The effect of EU membership on school characteristics.
At the country level, the EU’s soft coordination may have triggered policy reforms. Estimation results are documented in . The point estimate of EU membership does not significantly link to school autonomy. This may be due to decentralization of the socialist school systems right after the dissolution of the Soviet states and not due to EU accession. School accountability seems to be significantly affected by EU accession in some dimensions. The EU membership coefficient suggests a decrease in school-based tests with external comparisons by 9.4 percentage points and a decrease in internal teacher monitoring by 7 percentage points, while student-based external tests with external comparisons increased by 28.6 percentage points. Standardized monitoring and internal testing seem unaffected by EU membership. These estimates support the view that accountability regimes gained strength in the 2000s by shifting from internal testing to standardized tests with external comparability. Another country-level education determinant is government expenditure on secondary education. The point estimate suggests a small negative, though insignificant, link of EU membership to government expenditure on secondary education. This may be due to a reduction in domestic education funding in response to increased EU funding. Yet, a change of EU funding in the structure of this data is not available.
Table 6. The effect of EU membership on country characteristics.
In conclusion of this sub-section, estimates of EU membership on inputs factors suggest positive and negative effects for students and their families. On the positive side, fathers work more, families own more status goods, schools are more rural and have more resources, and school accountability through student-based testing increased. On the negative side, parental higher education decreased, parents work in lower-status jobs, intellectual goods diminished, and parents left their children. Hence, while material wellbeing seems to have improved, social wellbeing deteriorated.
5.3. Potential mechanisms to the effect of EU membership on student achievement
In this sub-section, I investigate potential mechanisms through which EU membership affects student achievement. Thus, the outcome variable is a student’s reading score and the input variables to the human capital production function are used as controls. In the preceding section, some of these variables were affected by the treatment. Hence, they are bad controls in the sense of Angrist and Pischke (Citation2009) but nonetheless provide explorative, non-causal evidence. The following table expands its predecessors by a new first column to report the main specification in a reduced (controls) sample. The reduced sample results from missing observations in variables, which should not be imputed. The main result of EU membership increasing student achievement holds in the reduced sample with a slightly large coefficient (14.298 points au lieu of 9.668 points).Footnote28
Column 1 includes controls for country- and wave-fixed effects but does not include controls from the human capital function. Column 2 includes all controls on student, parent, family, school, and country level (the coefficients of the control variables are displayed in Appendix Table 3). The coefficient of EU membership remains robust to including controls. Thus, EU membership exerts an effect on student achievement independent of the inputs to the human capital production function.
Table 7. The effect of EU membership on student achievement conditional on the entire set of controls.
6. Robustness tests
There are several remaining concerns to the analysis, such as the endogeneity of EU membership, the sample composition from countries, waves, and student groups, and the fixed-effects specifications. Those potential confounders are discussed in the following three sub-sections. One potential concern on omitted variable bias from unobserved characteristics in the sense of Altonji, Elder, and Taber (Citation2005) was already eliminated in Sub-Section 5.3 by including control variables while the treatment coefficient remained unchanged. Furthermore, the stability of the R-squared indicates that the observed variables are no relevant mechanisms to the treatment.
6.1. Dynamics of the EU accession
A typical confounder in the difference-in-differences approach is the potential endogeneity of the treatment. This applies if EU candidates are on a different trend than non-candidates prior to EU membership. This may be caused by the Process of Stabilization and Association reforming political and economic institutions. Thus, the common-trends assumption would be violated. To verify the absence of an improvement in outcomes prior to treatment, I make use of data’s panel structure. In a placebo test, I create leads of the treatment variable relative to the EU accession by one period.Footnote29 If there is no anticipation of the EU membership, there will be no significant estimate of the treatment on student achievement. In contrast, if EU membership was endogenous, I would yield significant estimates of the treatment prior to the outcome.
reports the results of this placebo test in the full sample with all available observations (Column 1), in the reduced sample where control variables are available but not applied (Column 2), and in the reduced sample with control variables (Column 3). Across all three columns, the point estimate of the leading treatment variable EU membership is insignificant and close to zero. Hence, this placebo tests supports that EU membership is not endogenous.
Table 8. Placebo test against endogeneity with leading treatment.
6.2. Sample composition
There are three key dimensions of sample composition which may drive the effect of EU membership on student achievement. First, one single country may cause the effect. Second, one single wave may create the effect. Third, one group of students may be affected differentially than another group. To ensure that my results are not driven by a specific country, I rerun the main specification excluding one country at a time. The qualitative results are insensitive to this sample alteration, with coefficients remaining significant and of similar magnitude.Footnote30 To ensure that results are not driven by one wave, I exclude one wave at a time. The estimates of EU membership are unresponsive to excluding waves, except for wave 2006; where the coefficient decreases in significance and in magnitude by one third. This is not surprising, as eight out of eleven countries become EU members in that wave. This change of the coefficient suggests heterogeneous treatment effects, which are stronger for the first wave of entrants as opposed to the two later waves.Footnote31 This more intense first treatment effect is likely caused by entrants being direct neighbors to old EU members with high demand for low-skilled labor, such as Germany and Austria.
The third dimension of sample composition refers to groups within the student population. One may identify two main student characteristics, gender and migration background.
Panel A reports the analysis separately for girls and boys. Across all three specifications of the full sample (Column 1 and 4) or the reduced sample without (Column 2 and 5) and with controls (Column 3 and 6), the coefficient of EU membership on student achievement appears to be the same. Hence, girls’ and boys’ reading achievement was affected in the same extend by EU membership.
Table 9. Robustness test – student sample composition.
Second, the analysis may be confounded by emigration in two ways. With the EU enlargement to the East, migration from Eastern to Western EU countries has increased. The first way of emigration confounding my analysis is by underestimating the effect of EU membership on student achievement. Typically, families of higher socio-economic status emigrate to another country due to their intellectual and financial abilities. Those families tend to have children who perform better at school. Then, the children remaining in their home countries tend to perform lower at school. If my analysis of the effect of EU membership on student achievement finds an effect nevertheless, the effect would be underestimated due to the high-performing children having emigrated westwards. The second way of emigration confounding my analysis is by overestimating the effect of EU membership on student achievement. If the families of lower socio-economic status with lower-performing children leave Eastern Europe and leave behind their higher-performing peers, my analysis of the effect of EU membership on student achievement would be overestimated.
To investigate the emigration background of my sample’s population, I draw on the PISA background questionnaires answered by students and their parents. I approach the investigation from two perspectives. First, I regard socio-economic characteristics of the native student and parent population who were sampled in the elven Eastern EU countries.Footnote32 Second, I regard socio-economic characteristics of the emigrant student and parent population who were sampled in Western EU countries but who were born in one of the elven Eastern EU countries.Footnote33 In descriptive statistics, it seems that student achievement of first-generation Eastern-European emigrants living in Western Europe is lower than the achievement of their home populations. Regarding the level of parental education, there is no common pattern across the eleven Eastern European countries.Footnote34 Parental occupation seems to reflect the Western European demand for lower-status labor. Parents of students who emigrated to Western Europe report lower-status occupations relative to their home populations in Eastern Europe. In sum, this suggests a negative selection into emigration of families of lower socio-economic status from Eastern to Western Europe. Hence, my estimated effect of EU membership may be overestimated. To address this concern, I rerun my analysis on a sample of native students, i.e. students born in their testing countries and excluding all first- and second-generation migrants. Panel B shows that the coefficient of EU membership on student achievement remains similar to the sample including migrants. Hence, the effect is not overestimated.
6.3. Specification test
Another robustness check addresses concerns on the assumption about the absence of country-specific shocks over time in unobservables between treatment and control. This assumption is necessary for including country- and time fixed effects separately.
A first step to address this concern has already been undertaken by controlling for observable school quality and institutional variables, such as school resources, teacher background, school autonomy and accountability, and government funding. Results were reported in Section 5.3.
A second step to address the concern is to allow for country-specific time trends. This specification controls for a country’s evolution of student achievement separate from the treatment by interacting country-fixed effects with a continuous time variable and still controlling for the country- and time- fixed effect.
shows the estimation results. The magnitude of the reading coefficient almost halves, the math coefficient remains relatively stable, and the sciences coefficient turns positive. In all three subjects, the coefficient of EU membership is statistically significant which contrasts the insignificant estimates of math and sciences with the simple country- and time-fixed effects. Hence, the specification with country-specific time trends suggests a separate trend in countries of the student achievement and EU membership. Yet, it is reassuring that the estimate of EU membership on reading achievement is positive and significant in the simple and in the interacted specification. This suggests that the estimated effect holds independently of the fixed-effect specification.
Table 10. Specification test on country-specific time trends.
Overall, robustness checks soothed concerns on the endogeneity of the treatment by using leads, on the sample composition by countries, waves, and student groups, and on the specification of the fixed effects.
7. Conclusion
This paper examined the consequences of EU membership of Eastern European countries on student achievement. I used six waves of PISA data in a country panel over fifteen years with more than one million individual observations in 32 countries. Employing a difference-in-differences approach, I find that entering the EU links to an improvement in students’ reading achievement by a tenth of a standard deviation worth about three months of learning.
In search of mechanisms through which EU membership affects student achievement, I test inputs of the human capital production function as alternative outcomes and find EU membership had benefits and downsides. The benefits reflect in families’ material wellbeing, school resources, and school accountability. For example, fathers work more, families own more status goods, schools are more rural and have less teacher absence, and student tests with external comparison increased. The downsides of EU membership reflect in families’ social wellbeing. For example, parental higher education decreased, parents work in lower-status jobs, intellectual goods diminished, and children live without their parents. Using those inputs in a human capital production function as controls to the effect of EU membership on student achievement does not alter the treatment coefficient. Hence, EU membership seems to have improved student achievement while this effect seems unlikely to be affected by controls. Testing the robustness of my analysis, I address concern about the endogeneity of EU membership, the sample composition by countries, by waves, and by student groups, and the specification of fixed-effects. The tests shows, that my analysis is robust to those alterations.
draft_EasternEuropeEnlargement_25-9-19.docx
Download MS Word (561.4 KB)Acknowledgements
I gratefully acknowledge comments from seminar participants of the ifo Center for the Economics of Education. I thank especially Ludger Wößmann, Natalie Obergruber, Lukas Mergele, Raphael Brade, Amelie Wuppermann, Simon Wiederhold, and Katharina Werner for their suggestions.
Disclosure statement
No potential conflict of interest was reported by the author.
Notes
* This paper was created while working at the ifo Institute at the University of Munich.
1 For example, the 2004 accessions augmented GDP per capita by 12% across all member states and cost-benefit analysis suggest that benefits outweigh the costs of accession (Campos, Coricelli, and Moretti Citation2019).
2 Consequences of EU membership have focused on labor mobility of adults. In specific, migration from the new EU Eastern countries to the old EU countries increased through the 2004 enlargement (Sinn et al. Citation2001). Labor migration from the 2004 EU enlargement was directed mainly at Ireland, Austria, and Germany which filled labor shortages for low status occupations (Dobson Citation2009).
3 There is also a psychological dimension, such as an increase in life satisfaction due to EU accession (for Romania and Bulgaria, see Nikolova and Nikolaev (Citation2017) and Zapryanova and Esipova (Citation2016)). Yet, my data provides only scarce information on attitudes and aspirations and I therefore do not regard psychological consequences from EU accession. Still, I capture a social dimension of EU membership when analyzing family structure.
4 Classic economic theory predicts rising welfare on the macro- and on the micro-level because a greater variety of goods and services are available at lower prices and employment increases. As a result, national economies and individual households become wealthier.
5 A few well-identified studies investigate returns to skills when countries transition from communism to EU membership. Increasing returns seem to incentivize raising educational attainment and achievement.
6 Empirical research has shown that richer families associate to higher performing children (Carneiro and Heckman Citation2002; Dahl and Lochner Citation2012; Bulman et al. Citation2017).
7 Disrupted families, where less than two parents are present, associate with lower student achievement (Wuertz Rasmussen Citation2009; Francesconi, Jenkins, and Siedler Citation2010; Tartari Citation2015). Yet, selection complicates causal analysis of family structure and student outcomes, as disrupted families tend to be of disadvantaged socio-economics status. For example, single-parent families seem to have lower employment rates, lower earnings, and more instable relationships (Ermisch and Francesconi Citation2001; Gruber Citation2004).
8 For example, education policy progress and goals are communicated in the Education and Training frameworks. The European Social Fund provides funding for human capital investments. For more details on the educational consequences of EU membership, refer to Section 2.
9 Cyprus and Malta participated only two times in PISA which fails my criterium of having participated at least three times to make meaningful comparisons over time.
10 In 2004, Poland, the Czech Republic, Hungary, the Slovak Republic, Slovenia, Estonia, Lithuania, and Latvia entered the EU. In 2007, Bulgaria and Romania followed and Croatia entered in 2013.
11 The human capital production function was formalized by Hanushek (Citation1970) and (Citation1979) and more recently by Hanushek and Woessmann (Citation2011) as Yi = f (Ii, Ri, Fi, Ai). The education outcome Yi captures skills measured by test scores from (large-scale) assessments at individual level i. The input factors are intuitions Ii, school resources Ri, family background Fi, and student ability Ai.
12 Bad controls are potential outcome variables to the treatment themselves and should not be included as control variables where estimates may have a causal interpretation. Bad controls are potential outcome variables because they determine after the treatment. To employ those controls determined after the treatment, one needs explicit assumptions on the timing of control, treatment, and outcome variables. In contrast, relevant variables measured before the treatment is determined are good controls and cannot become an outcome variable of the treatment (Angrist and Pischke Citation2009).
13 Free movement of labor was regulated by a 2 + 3 + 2-transformation model, where the United Kingdom, Ireland, and Sweden allowed labor migration immediately with EU membership. Two years later, Spain, Portugal, Finland, and Greece opened their market. Only seven years after the first round of accessions, in May 2011, Germany and Austria granted free labor migration to the 2004 entrants. For the 2007 entrants, Romania and Bulgaria, Germany allows migration since 2014. One year later, Croatia received the legal right to free labor movement to Germany (bpb Citation2016).
14 Slovenia, the Slovak Republic, Estonia, Latvia, and Lithuania introduced the Euro currency.
15 In contrast, economic analysis of earlier rounds attributed benefits of EU accessions to investment in physical capital (Baldwin and Sheghezza Citation1996) and in technological innovation (Rivera-Batiz and Romer Citation1991).
16 Soft coordination or the open method of coordination (OMC) is the EU’s instrument which does not produce legislative binding rules but recommendations evaluated by one another (European Union Citation1998–2019).
17 The ESF 2007–2013 supported human capital with € 25.5 billion (European Commission Citation2013).
18 The student achievement is reported as five plausible values (PVs) of which I use the first as common in the literature (Hanushek, Link, and Woessmann Citation2013) and as the distribution of the five PVs is the same and generates the same analysis results.
19 The Netherlands in 2000 and the United Kingdom in 2003. I exclude any country-by-wave observation for which the entire data of a background questionnaire is missing; as in France from 2003 to 2009 (missing school questionnaire) and Albania in 2015 (missing student questionnaire). Liechtenstein was dropped due to its small size.
20 Non-members are Albania, Montenegro, Serbia, Switzerland, Iceland, and Norway. Permanent EU members are Austria, Belgium, Germany, Denmark, Spain, Finland, France, the United Kingdom, Greece, Ireland, Italy, Luxembourg, the Netherlands, Portugal, and Sweden (for a list of EU membership status by country over time, see Appendix Table 2).
21 Imputation on student level is impossible, due to resampling of a nationally representative population each wave. Without imputation, I would lose half the sample; for some variables, I would lose up to three quarters. I report and control for the imputed share of all variables.
22 To eliminate concerns that disrupted families significantly differ from nuclear families, I verified that socio-economic characteristics of each family structure before and after EU membership do not structurally differ. Tables are available on request.
23 If a whole country lacks answers in a specific wave, I impute: in Sweden in 2015, the school characteristics number of students, private or public operator, share of school budget from the government, city size. The share of fully certified teachers is missing in Denmark in 2006, 2012, and 2015; in Bulgaria in 2012; in Spain in 2009; in Hungary in 2000, 2012, and 2015. The number of students is missing in Albania in 2012; and in Austria in 2012 and 2015. Private or public operator is not reported for Bulgaria in 2006. The share of government budget misses for Austria in 2003, 2006, 2009, and 2015. Iceland does not provide the city size in 2000. In contrast, individual missing variables are not replaced.
24 Due to the resampling survey design, one cannot apply a value-added approach to account for the cumulative learning process.
25 Bootstrapping the complete analysis would lead to very long computation times.
26 Note, that the volatility of the control group of never members (grey markers) originates from its heterogeneous composition of Albania, Iceland, Montenegro, Norway, and Serbia, which are observed in PISA in different points in time. The upward kink in 2003 stems from low-performer Albania (378 points on average) missing in 2003 and 2006, while Montenegro (410 points on average) and Serbia (431 points on average) participated in PISA for the first time in 2006. To mitigate concerns on results being driven by this heterogeneous comparison group, I subsequently exclude each country in my robustness analysis in Section 6.2.
27 Average annual net earnings of a single person in the eleven Eastern European EU entrant countries increased from 3,022€ to 7,482€, between 2000 and 2015 (Eurostat Citation2018a).
28 The larger estimate of the reduced sample may be due to children with higher performance tending to complete their questionnaires rather than children with lower performance tending to leave their questionnaires incomplete which are then excluded from the sample due to missing observations.
29 PISA is surveyed every three years. Thus, one period corresponds to three years.
30 Results are available from on request.
31 Therefore, I forego robustness checks by means of an event study, as this assumes that the three accession waves had the same effect.
32 The native population refers to students who were born in their testing countries and whose parents were born there, too. Hence, I exclude all first- and second-generation migrants.
33 Students born in another country than their testing country are defined as first-generation migrants.
34 In Estonia and Lithuania, the parental home population is higher educated than the parental emigrant population in Western Europe. In contrast, parental education of Hungarian and Polish emigrants to Western Europe has been higher relative to the home population. For the rest of the countries, parental education of the home and emigrant population was about the same. These differences across the eleven Eastern EU countries of parental education between home and emigrant population may origin from labor demand of their home economies and from proximity to Austria and Germany with a high demand for lower-qualified labor.
References
- Altonji, J. G., T. E. Elder, and C. R. Taber. 2005. “An Evaluation of Instrumental Variable Strategies for Estimating the Effects of Catholic Schooling.” Journal of Human Resources XL (4): 791–821. doi: 10.3368/jhr.XL.4.791
- Angrist, J. D., and J.-S. Pischke. 2009. Mostly Harmless Econometrics. An Empiricist’s Companion. Princeton, NJ: Princeton University Press.
- Anniste, K., T. Tammaru, E. Pungas, and T. Paas. 2012. Emigration After EU Enlargement: Was There a Brain Drain Effect in the Case of Estonia?
- Baldwin, R. E., and E. Sheghezza. 1996. “Growth and European Integration: Towards an Empirical Assessment.” CEPR Discussion Paper, No. 1393.
- Baldwin, R. E., and C. Wyplosz. 2012. The Economics of European Integration. London: McGraw-Hill Education Higher Education.
- Banerji, R., R. Berry, and M. Shotland. 2013. The Impact of Mother Literacy and Participation Programs on Child Learning in India. Cambridge, MA: mimeo.
- Bergbauer, A., E. A. Hanushek, and L. Woessmann. 2018. Testing, NBER Working Paper No. 24836.
- Bergman, P. 2014. Parent-Child Information Frictions and Human Capital Investment. Evidence from a Field Experiment.
- Botezat, A., and F. Pfeiffer. 2014. The Impact of Parents Migration on the Well-Being of Children Left Behind Initial Evidence from Romania.
- bpb. 2016. Fünf Jahre Arbeitnehmerfreizügigkeit in Deutschland. http://www.bpb.de/politik/hintergrund-aktuell/226107/arbeitnehmerfreizuegigkeit; http://www.bamf.de/DE/Infothek/Statistiken/Wanderungsmonitor/Freizuegigkeit/freizuegigkeit-node.html.
- Bulman, G., R. Fairlie, S. Goodman, and A. Isen. 2017. Parental Resources and College Attendance: Evidence from Lottery Wins.
- Bütikofer, A., A. Dalla-Zuanna, and K. G. Salvanes. 2017. Breaking the Links. Natural Resource Booms and Intergenerational Mobility, Munich.
- Cameron, A. C., J. B. Gelbach, and D. L. Miller. 2008. “Bootstrap-Based Improvements for Inference with Clustered Errors.” Review of Economics and Statistics 90 (3): 414–427. doi:10.1162/rest.90.3.414.
- Campos, N. F., F. Coricelli, and L. Moretti. 2019. “Institutional Integration and Economic Growth in Europe.” Journal of Monetary Economics 103: 88–104. doi: 10.1016/j.jmoneco.2018.08.001
- Carneiro, P., and J. J. Heckman. 2002. “The Evidence on Credit Constraints in Post-Secondary Schooling.” The Economic Journal 112 (482): 705–734. doi:10.1111/1468-0297.00075.
- Crespo Cuaresma, J., D. Ritzberger-Grünwald, and M. A. Silgoner. 2008. “Growth, Convergence and EU Membership.” Applied Economics 40 (5): 643–656. doi:10.1080/00036840600749524.
- Dahl, G. B., and L. Lochner. 2012. “The Impact of Family Income on Child Achievement: Evidence from the Earned Income Tax Credit.” American Economic Review 102 (5): 1927–1956. doi:10.1257/aer.102.5.1927.
- Darvas, Z. 2018. What is the Financial Balance of EU Membership for Central Europe? Bruegel. Accessed January 21, 2019. http://bruegel.org/2018/02/what-is-the-financial-balance-of-eu-membership-for-central-europe/.
- Dobson, J. R. 2009. “Labour Mobility and Migration within the EU Following the 2004 Central and East European Enlargement.” Employee Relations 31 (2): 121–138. doi:10.1108/01425450910925283.
- Ermisch, J. F., and M. Francesconi. 2001. “Family Structure and Children’s Achievements.” Journal of Population Economics 14 (2): 249–270. doi:10.1007/s001480000028.
- European Commission. 2013. European Social Fund. Accessed February 26, 2019. http://ec.europa.eu/esf/main.jsp?catId=51&langId=en.
- European Council. 2017. Setting the EU’s Political Agenda. Accessed February 26, 2019. https://www.consilium.europa.eu/en/european-council/role-setting-eu-political-agenda/.
- European Union. 1998–2019. EUR-Lex: Open Method of Coordination. Accessed March 14, 2019. https://eur-lex.europa.eu/summary/glossary/open_method_coordination.html.
- Eurostat. 2018a. Annual Net Earnings, European Union. Accessed December 3, 2018. http://eurostat.ec.europa.eu/nui/show.do?.
- Eurostat. 2018b. Employment and Activity – Annual Data. From 15 to 64 Years. Percentage of Total Population. https://ec.europa.eu/eurostat/data/database.
- Farchy, E. 2009. The Impact of EU Accession on Human Capital: Formation - Can Migration Fuel A Brain Gain?. Policy Research working paper no. WPS 4845. World Bank. https://openknowledge.worldbank.org/handle/10986/4039.
- Fleisher, B. M., K. Sabirianova, and X. Wang. 2005. “Returns to Skills and the Speed of Reforms. Evidence from Central and Eastern Europe, China, and Russia.” Journal of Comparative Economics 33 (2): 351–370. doi:10.1016/j.jce.2005.03.003.
- Francesconi, M., S. P. Jenkins, and T. Siedler. 2010. “Childhood Family Structure and Schooling Outcomes: Evidence for Germany.” Journal of Population Economics 23 (3): 1073–1103. doi:10.1007/s00148-009-0242-y.
- Gruber, J. 2004. “Is Making Divorce Easier Bad for Children? The Long-Run Implications of Unilateral Divorce.” Journal of Labor Economics 22 (4): 799–833. doi:10.1086/423155.
- Halász, G. 2015. “Education and Social Transformation in Central and Eastern Europe.” European Journal of Education 50 (3): 350–371. doi:10.1111/ejed.12130.
- Hanushek, E. A. 1970. The Production of Education, Teacher Quality, and Efficiency. In do Teachers Make a Difference?. Washington, DC: Government Printing Office.
- Hanushek, E. A. 1979. “Conceptual and Empirical Issues in the Estimation of Educational Production Functions.” The Journal of Human Resources 14 (3): 351–388. doi:10.2307/145575.
- Hanushek, E. A., S. Link, and L. Woessmann. 2013. “Does School Autonomy Make Sense Everywhere? Panel Estimates from PISA.” Journal of Development Economics 104: 212–232. doi:10.1016/j.jdeveco.2012.08.002.
- Hanushek, E. A., and L. Woessmann. 2011. “The Economics of International Differences in Educational Achievement.” In Handbook of the Economics of Education, edited by E. A. Hanushek, S. Machin, and L. Woessmann, 89–200. North Holland: Elsevier.
- Levai, C. M., G. Kanalas, I. B. Micu-Serbu, C. Talpos, M. Anghel, C. D. Krems, and A. S. Podariu. 2018. “Resilience and Risk Factors in Children Originated from Families in Which Parents Migrate due to Labor Conditions.” Revista de Cercetare şi Intervenţie Socială 61: 44–54.
- Nikolova, M., and B. Nikolaev. 2017. “Does Joining the EU Make You Happy? Evidence from Bulgaria and Romania.” Journal of Happiness Studies 18: 1593–1623. doi:10.1007/s10902-016-9789-y.
- OECD. 2015. Education Policy Outlook. Poland.
- OECD. 2016a. Education Policy Outlook. Estonia.
- OECD. 2016b. Education Policy Outlook. Slovenia.
- OECD. 2018. PISA Database. 2000, 2003, 2006, 2009, 2012, 2015. http://www.oecd.org/pisa/data/.
- Rivera-Batiz, L. A., and P. M. Romer. 1991. “Economic Integration and Endogenous Growth.” The Quarterly Journal of Economics 106 (2): 531. doi:10.2307/2937946.
- Schütz, G., H. W. Ursprung, and L. Wößmann. 2008. “Education Policy and Equality of Opportunity.” Kyklos 61 (2): 279–308. doi:10.1111/j.1467-6435.2008.00402.x.
- Sinn, H.-W., G. Flaig, M. Werding, S. Munz, N. Düll, and H. Hofmann. 2001. EU-Erweiterung und Arbeitskräftemigration: Wege zu einer schrittweisen Annäherung der Arbeitsmärkte, München.
- Staneva, A. V., and H. Abdel-Latif. 2016. “From Soviet to Europe: Returns to Education Puzzle in Bulgaria.” Labour 30 (3): 347–367. doi:10.1111/labr.12080.
- Tartari, M. 2015. “Divorce and the Cognitive Achievement of Children.” International Economic Review 56 (2): 597–645. doi:10.1111/iere.12116.
- Woessmann, L. 2016. “The Importance of School Systems: Evidence from International Differences in Student Achievement.” Journal of Economic Perspectives 30 (3): 3–31. doi: 10.1257/jep.30.3.3
- World Bank. 2018. Government Expenditure on Education, Total (% of GDP). UNESCO Institute for Statistics. https://data.worldbank.org/indicator/SE.XPD.TOTL.GD.ZS.
- Wuertz Rasmussen, A. 2009. Family Structure Changes and Children’s Health, Behavior, and Educational Outcomes, 09–15.
- Zapryanova, G., and N. Esipova. 2016. Most in Eastern Europe Positive about EU Membership, Gallup World Survey. Accessed January 21, 2019. https://news.gallup.com/poll/210083/eastern-europe-positive-membership.aspx.