
ABSTRACT
This article presents the results of a field experiment in which fictitious parents of children with attention deficit hyperactivity disorder (ADHD) and type 1 diabetes mellitus (T1DM) sent inquiries to schools in Sweden about admission of their children to the mandatory preschool class. Results show that inquiries concerning a child with no medical condition were more likely to receive an invitation for a visit and more likely to receive a promising placement response than inquiries concerning a child with ADHD and T1DM. Discrimination was more prominent in the private sector and when the child was a boy or had ADHD.
JEL:
1. Introduction
A relatively large number of studies have provided evidence of discrimination against disabled people in the labor market across various countries (see Jones Citation2008, for a review and Ameri et al. Citation2018, for a recent field experiment). The results of these studies in all essential show that disabilities reduce labor market prospects and contribute to low-income levels for the disabled (World Health Organization Citation2011). Discrimination against disabled people has also been found in various housing markets (Aranda Citation2015; Fumarco Citation2017). However, research regarding the extent to which children with disabilities are discriminated against in schools is scarce. In Sweden, for example, only discrimination against ethnic minorities in the school system has been examined earlier (Hinnerich, Höglin, and Johannesson Citation2015). In this study, we fill this research gap by conducting a field experiment in which we tested for discrimination against six-year-old children with attention deficit hyperactivity disorder (ADHD) and type 1 diabetes mellitus (T1DM), whose parents made inquiries for their placements in Swedish schools. Field experiments have proven to be powerful in identifying discrimination against different groups of people, in various markets, across many countries (see, e.g. Bertrand and Duflo Citation2017, and Baert Citation2018, for recent reviews).
A study of discrimination against children with disabilities whose parents make inquiries about school placements is highly relevant for various reasons. Previous research has underlined the importance of preschool attendance for the possibilities to succeed in the labor market as an adult (Dietrichson, Kristiansen, and Nielsen Citation2018). Furthermore, research has shown that school segregation in Sweden has become more prevalent as a result of a reform that was implemented in the early 1990s, which allows parents to choose school for their children (Böhlmark, Holmlund, and Lindahl Citation2016). Hence, if children with disabilities are discriminated against when their parents search for school placements, it may lead to further segregation and have implications for their possibilities in the labor market later in life. Moreover, a field experiment conducted in the US showed that schools were less likely to respond to inquiries concerning students with significant special needs (Bergman and McFarlin Jr Citation2020). The question is whether common disabilities such as ADHD and T1DM also can lead to discrimination and if discrimination occurs against very young children. Moreover, discrimination against children with disabilities may not even have to be in a direct form (cf., employer discrimination against workers, Becker Citation1957), schools may discriminate against disabled children because they are concerned about how the presence of children with disabilities will affect the performance and development of other children (cf., coworker or customer discrimination, Becker Citation1957). Indeed, there is evidence on the relationship between classroom disruption and peer effects of children with ADHD and special needs (Figlio Citation2007; Fletcher Citation2010; Kristoffersen et al. Citation2015).
In the experiment, six fictitious parents (mothers) were randomly assigned to schools and made inquiries to the schools with brief letters via email during late December 2019 to early January 2020. The mother explained that she was in search for a good school for her six-year-old child’s admission to the compulsory preschool class for autumn 2020. Two of the mothers that made inquiries stated that their child (one boy and one girl) had ADHD, while two other mothers (also one boy and one girl) stated that their child had T1DM. Finally, two parents mentioned no medical condition of the child. We then analyzed two outcomes: the probability of receiving an invitation for a viewing of a school and the probability of receiving a promising placement response.
We focused on ADHD and T1DM because ADHD is considered one of the most common psychiatric conditions among children (Polanczyk et al. Citation2007; Willcutt Citation2012) and T1DM is considered one of the most common chronic diseases among children (Cox and Gonder-Frederick Citation1992; Soltesz, Patterson, and Dahlquist Citation2007; Patterson et al. Citation2014). At the same time, ADHD require a different support system from schools than T1DM does. While ADHD require educational support efforts from the schools, T1DM require support related to selfcare. Furthermore, there is ample of research that suggests that stigma, prejudice, and discrimination is associated with both ADHD (Mueller et al. Citation2012) and T1DM (Schabert et al. Citation2013). Most of this literature, however, is based on survey and other nonexperimental evidence. In contrast to previous literature, we provide direct evidence of discrimination based on a field experiment in this study. We included inquiries cornering both boys and girls since ADHD is diagnosed and treated among boys more frequently than among girls (Skogli et al. Citation2013) and because teachers’ perceptions of boys and girls with ADHD can differ and can be slightly more negative towards girls (Eisenberg and Schneider Citation2007). We also differentiated between public and private schools in our analysis because discrimination have sometimes been found to vary between the public and the private sector (see, e.g. Ahmed, Andersson, and Hammarstedt Citation2013, on hiring discrimination against gays and lesbians).
We ended up with several interesting and policy relevant results: First, we document an overall discrimination against children with ADHD and T1DM when communicating with schools in Sweden. Second, discrimination was more distinct against children with ADHD than against children with T1DM. Last, our results revealed that discrimination was more prominent in private than public schools. The remainder of this paper is organized as follows: Section 2 presents the institutional setting; Section 3 presents the experimental method; Section 4 provides the statistical analysis and the results; and Section 5 contains the discussion and the conclusions.
2. Institutional context
In Sweden, municipalities are responsible for arranging preschool education for children from the age of one year according to the Education Act (Swedish Code of Statutes Citation2010:800). At the age of six years, the preschool class in Sweden is mandatory. Parents in Sweden are eligible to choose school for their children and are free apply to the school that they prefer. Schools in Sweden can be either public or private, but all schools are obliged to follow the same laws and adhere to the Swedish curriculum for compulsory school, preschool class and school-age educare (The Swedish National Agency for Education Citation2018). Discrimination against children, or their parents, due to ethnicity, sex, age, gender identity, religious belief, sexual orientation, and disabilities is prohibited by the Discrimination Act (Swedish Code of Statutes Citation2008:567).
Sweden went through a major education reform in 1992, which allowed that schools could be run by either public or private providers. Moreover, a free choice of school was also implemented during this reform. The free choice of school implies that parents are allowed to choose schools for their children and can apply for admission in schools that they prefer. The entire Swedish compulsory school system (and high-school education as well) is covered by the free choice of school. The preschool class for six-year-olds is the start of the Swedish compulsory school. It became mandatory in 2018.
The free choice of school also implies that parents can choose between both public and private schools. The main rule is that parents can apply to any school that they prefer for their child as long as that school has available capacity, regardless of whether the school is located in the child’s home municipality or not. If the number of children applying to a public school exceeds the number of available places at the school, a selection is made based on what is called the proximity principle. This principle means that students who live in the area that is geographically closest to the school are prioritized. Regarding private schools, certain selection criteria are allowed. Such criteria are the child’s date of registration for the school and the school’s geographical distance from the child’s home. Further, priority can be given to children who have siblings already admitted to the school. Private schools have their own selection criteria, but they must be transparent and clear.
Most important, however, is that using disability as a selection criterion for admission to a school is prohibited by Swedish law, regardless of whether the school is public or private. For a more detailed discussion regarding choice of school and rules of admission, see Swedish National Agency for Education (Citation2020).
3. Method
3.1. Sample
We retrieved a list of all schools in Sweden from the Swedish National Agency for Education on December 18, 2019. The list consisted of 3,647 schools who provided the mandatory preschool class for six-year-olds in line with the Swedish school system. After removing schools with no contact information (email address), schools that focused on children with special needs, and schools that had the same contact information as another already included school, we ended up with a list of 2,613 schools. Another 459 schools had to be removed from the sample during the field experiment, for the most part because of email delivery failures. Hence, the data that supports the findings of the study presented in this paper consists of 2,154 schools. Twenty-five percent of the schools in the final sample were private and 75 percent were public. A description of the data is provided in .
Table 1. Description of data collection and data.
3.2. Materials
We constructed a brief letter with the purpose of making email inquiries to schools from a fictitious parent. The experimental design was similar to the one used by Diaz-Serrano and Flamand (Citation2020), who studied schools’ attitudes towards single- versus two-parent families in Spain, but also Diaz-Serrano and Meix-Llop (Citation2016), who examined school feedback discrimination against children of homosexual parents in Spain. One important difference between our study and these studies was that we used a (randomized) between-subjects design and these studies used a (matched) within-subjects design.
The fictitious parent that made the inquiry to the schools was always a mother and was given a typical Swedish-sounding first and family name, Pernilla Svensson. The narrative of the letter was as following: The mother explained in the letter that the family was just about to move into the town during spring 2020. She therefore was in search for a good school for her six-year-old child’s admission for autumn 2020. She then asked whether she could visit the school and if there were any placement possibilities for the autumn semester 2020. This ended the letter.
Using this baseline letter, we then constructed different versions of it by varying some characteristics of the child. First, we randomly varied the sex of the child, boy or girl. Second, we randomly varied the medical condition of the child, where the child could have had ADHD, T1DM, or no medical condition. This resulted in six different email letters that we used in our field experiment.
Hence, all six letters started with the following phrases (English translation):
Hi! We are a family that are going to move to [name of the town] during spring 2020. We have a son/daughter that will turn six in April and needs to be admitted in a school starting with the autumn semester 2020.
Control condition: We are keen to find him/her a placement at a good school.
ADHD condition: Since our son/daughter currently is going through an ADHD assessment, we are keen to find him/her a placement at a good school.
T1DM condition: Since our son/daughter has type 1 diabetes, we are keen to find him/her a placement at a good school.
At this point, we need to acknowledge that the formulations used in our experiment constitute fairly strong signals about the medical condition of the child. Normally, there might not be a need to mention the medical condition of a child in the first communication with a school, since it might send a negative signal already in the first stage of the admission process. Nevertheless, any unequal treatment based on the information we provide in our email inquiries would still constitute a case of discrimination by Swedish law. Finally, all letters ended with two questions, answers to which would form our dependent variables (English translation):
Are there any possibilities to visit your school, and how do the placement possibilities look for autumn 2020? Kindly, Pernilla Svensson
An email account was created for the fictitious mother, through which we sent the inquiry letters to the schools in our sample. The original formulations of the email inquiries in Swedish for each experimental condition are available in Supplementary material: Table S1.
3.3. Procedure
The email inquiries that were described above were sent on six days: December 18, 19, 20, 22, and 27, 2019, and January 1, 2020. We used a randomized correspondence test where each school in the sample randomly received one out of the six possible inquiry letters. We then let more than two months pass in order to give the schools sufficient time to respond to the inquiries. The collection of data was competed on March 11, 2020. Answers to the two questions asked in the email inquiry formed our depended variables. Hence, the first depended variable indicated whether the school responded with an invitation to visit the school for a viewing. The second dependent variable indicated whether the school provided a promising outlook regarding placement possibilities. Our main independent variables were the child’s medical condition, whether the child was a boy or a girl, and whether the school was public or private. We also recorded in which county a school was located and the day the email inquiries were dispatched.
All data are openly available in Zenodo at https://doi.org/10.5281/zenodo.3741734. provides an overview of the data collection at different stages and a description of the data. defines all variables in the data that are used in the analysis. shows that slightly less than 70 percent (1,451/2,154) of the schools replied to the email inquiries in the experiment. It is difficult to say whether this response rate from schools was high or low since we do not have any previous experiments in similar contexts in Sweden to compare with. In labor and housing market experiments from Sweden, the overall response rates have been far much lower than 70 percent and vary, of course, a great deal across occupations. Response rate in the two earlier mentioned studies from Spain, which were conducted in similar school contexts, was a bit more than 50 percent in Diaz-Serrano and Meix-Llop (Citation2016) and about 20 percent in Diaz-Serrano and Flamand (Citation2020). Other ways of contacting a school would be by a phone call, a physical letter, or a visit. Most people would, however, not visit a school unannounced or write a physical letter. We therefore argue that, nowadays, email is probably the most convenient and likely way of communicating and making inquiries and that the response rate observed in this experiment was fairly high.
Table 2. Description of variables.
4. Results
4.1. Basic results
depicts the overall unconditional result of our experiment for the first outcome variable (Invitation). presents the percentage of email inquiries that led to an invitation for viewing of a school and hypothesis tests of overall differences across experimental conditions. Complete set of pairwise hypothesis tests between different experimental conditions corresponding to is available in Supplementary material: Table S3. The first row of presents the results for the total sample. It shows that the email inquiries led to an invitation for a viewing of a school in 49, 41, and 45 percent of the time when the child had no medical condition, ADHD, and T1DM, respectively. shows that the differences across experimental conditions were statistically significant. Pairwise comparisons showed that there was a statistically significant difference in invitations received when the child had no medical condition compared to when the child had ADHD, χ2(1, N = 1,454) = 10.62, p = 0.001, and there was no statistically significant difference in invitations received when the child had no medical condition compared to when the child had T1DM, χ2(1, N = 1,425) = 2.41, p = 0.120.
Figure 1. School visit invitation rates.
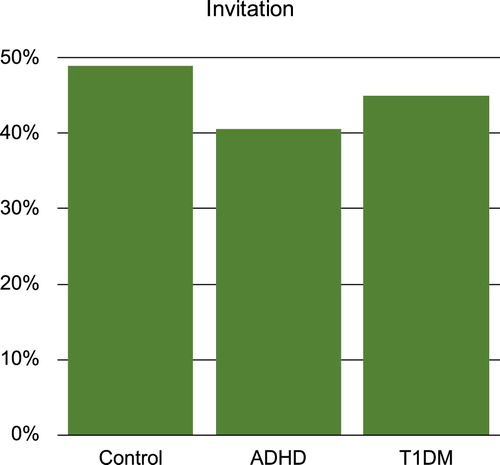
Table 3. Percentage of inquiries that led to an invitation for a visit.
The second and third row of present the data according to whether the child was a boy or a girl. When it was a boy, the email inquiries led to an invitation for a viewing of a school in 51, 40, and 44 percent of the time when the child had no medical condition, ADHD, and T1DM, respectively. shows that the differences across experimental conditions were statistically significant. Pairwise comparisons showed that email inquiries concerning a boy with no medical condition received significantly more invitations than inquiries concerning a boy with ADHD, χ2(1, N = 709) = 8.34, p = 0.004, as well as inquiries concerning a boy with T1DM, χ2(1, N = 700) = 3.06, p = 0.080. When it was a girl, the differences across experimental conditions were overall not statistically significant. Pairwise comparisons, however, showed that email inquiries concerning a girl with no medical condition received significantly more invitations than inquiries concerning a girl with ADHD, χ2(1, N = 745) = 3.02, p = 0.082.
Finally, arranges the data in public and private schools. Public schools invited a family for a viewing in 47, 43, and 46 percent of the time when the child had no medical condition, ADHD, and T1DM, respectively. shows that these differences were not statistically significant. However, shows that there were statistically significant differences across experimental conditions among private schools. Private schools invited a family for a viewing in 53, 33, and 42 percent of the time when the child had no medical condition, ADHD, and T1DM, respectively. Pairwise comparisons showed that email inquiries led to significantly more invitations when the child had no medical condition than when the child had ADHD, χ2(1, N = 365) = 14.63, p < 0.001, and when the child had T1DM, χ2(1, N = 369) = 4.49, p = 0.034.
depicts the overall unconditional result of our experiment for the second outcome variable (Placement). presents the percentage of email inquiries that led to promising placement responses from schools and hypothesis tests of overall differences across experimental conditions. Complete set of pairwise hypothesis tests between different experimental conditions corresponding to is available in Supplementary material: Table S4. Again, the first row gives the results for the total sample across experimental conditions. Twenty-one, 15, and 18 percent of the email inquiries led to a promising placement response when the child had no medical condition, ADHD, and T1DM, respectively. shows that these overall differences were statistically significant. Pairwise comparisons showed that there mainly was a statistically significant difference in promising placement responses between inquiries concerning a child with no medical condition and inquiries concerning a child with ADHD, χ2(1, N = 1,454) = 8.92, p = 0.003.
Figure 2. Promising placement response rates.
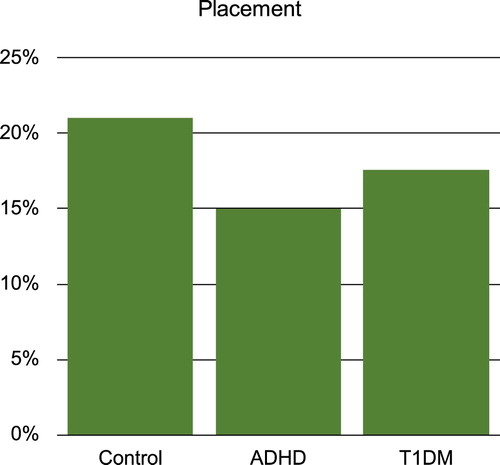
Table 4. Percentage of inquiries that led to a promising placement response.
The promising placement response rates were 21, 15, and 17 percent when the child was a boy and had no medical condition, ADHD, and T1DM, respectively. Corresponding percentages were 21, 15, and 19 percent when the child was a girl. shows that the overall differences across experimental conditions were statistically significant when the child was a boy but not when the child was a girl. Pairwise comparisons, however, showed that promising placement response rates were significantly lower when the child had ADHD compared to when the child had no medical condition, regardless of whether the child was a boy, χ2(1, N = 709) = 4.65, p = 0.031, or a girl, χ2(1, N = 745) = 4.28, p = 0.039.
Finally, public schools provided promising placement responses in 21, 16, and 18 percent of the time while private schools provided promising placement responses in 22, 11, and 16 percent of the time when the child concerned had no medical condition, ADHD, and T1DM, respectively. shows that the overall differences across experimental conditions were statistically significant among private schools but not among public schools. Pairwise comparisons, however, showed that promising placement response rates were significantly lower when the child had ADHD compared to when the child had no medical condition, regardless of whether the school was public, χ2(1, N = 1,089) = 3.54, p = 0.060, or private, χ2(1, N = 365) = 8.18, p = 0.004.
To sum up, three main results were found. First, unequal treatment was found between children with ADHD or T1DM and children who reported no medical condition in their applications. Second, unequal treatment was more salient when the child had ADHD than when the child had T1DM. Third, unequal treatment of children with ADHD and T1DM was more prominent among private than public schools.
4.2. Regression analysis
and present the marginal effects of being a child with ADHD and T1DM, respectively, on the probability of receiving an invitation to a viewing of a school (: Models 1–6) or a promising placement response (: Models 7–12), estimated using linear probability models. presents post-regression hypothesis tests for differences in marginal changes in the outcome variables for various comparisons that we do below.
Table 5. Probability of invitation for a visit, estimated by linear probability models.
Table 6. Probability of promising placement response, estimated by linear probability models.
Table 7. Post-regression hypothesis tests for differences in marginal changes.
According to the results of the first three specifications (Models 1–3 in ) an email inquiry had more than 8 percentage points lower probability of receiving an invitation for a viewing of a school when the child had ADHD than when the child had no medical condition. An email inquiry had 4 percentage points lower probability of receiving an invitation for a viewing at a school when the child had T1DM compared to when the child had no medical condition. The difference between Model 2 and 3 is that the latter model includes county fixed effects and email day fixed effects. The estimates of these models are quite similar except that the coefficient of the variable T1DM becomes statistically significant in Model 3. Overall, the experiment seems to have been properly balanced, but we included the county fixed effects and email day fixed effects in the remaining models of to take into account any remaining imbalances related to these variables.
Next, we sequentially introduced interaction variables in Models 4–6. Model 4 shows that an email inquiry resulted in about 11 percentage points lower probability of receiving an invitation for a viewing at a school when the child was a boy with ADHD than when the child was a boy with no medical condition. An inquiry resulted in 7 percentage points lower probability of receiving an invitation when the child was a boy with T1DM than when the child was a boy with no medical condition. Model 4 shows that both of these results were statistically significant. Corresponding comparisons when the child was a girl were not statistically significant (see post-regression hypothesis tests for Model 4 in ).
Model 5 shows that an email inquiry led to 20 percentage lower probability of receiving an invitation for a viewing at a private school when the child had ADHD and 12 percentage points lower probability when the child had T1DM than when the child had no medical condition. Both of these disadvantages were statistically significant. Corresponding statistically significant disadvantages were not found among public schools (see post-regression hypothesis tests for Model 5 in ).
A full set of interaction variables were added in Model 6. It shows that an email inquiry resulted in 25 percentage points lower probability of receiving an invitation for a viewing at a private school when the child was a boy with ADHD than when the child was a boy with no medical condition. Similarly, an email inquiry resulted in 21 percentage points lower probability of receiving an invitation for a viewing at a private school when the child was a boy with T1DM than when the child was a boy with no medical condition. Both of these results are statistically significant. When the child was a girl, we only found a statistically significant disadvantage of having ADHD and not T1DM. Post-regression hypothesis tests for Model 6 in shows that an email inquiry resulted in 14 percentage points lower probability of receiving an invitation for a viewing at a private school when the child was a girl with ADHD than when the child was a girl with no medical condition. Corresponding comparisons among public schools revealed no statistically significant disadvantages of having ADHD and T1DM for neither boys or girls (see post-regression hypothesis tests for Model 6 in ).
Now, let us turn our attention to the second outcome variable in , i.e. the probability of receiving a promising placement response from schools. Similar to earlier, Models 7–8 are without and Models 9–12 are with controls for county fixed effects and email day fixed effects. Models 7–10 show that the probability of receiving a promising placement response was about 6 percentage points lower for a child with ADHD than for a child with no medical condition. Moreover, the probability of receiving a promising placement response was around 4 percentage points lower for a child with T1DM than for a child with no medical condition. Both of these results were consistent and statistically significant.
When the full set of interactions were included in Model 12 it emerged that boys with ADHD had almost 13 percentage points lower probability of receiving a promising placement in private schools than boys with no medical condition. For boys with T1DM the difference in the probability of receiving a promising placement was almost 11 percentage points lower in private schools compared to boys with no medical condition. As regards public schools the differences in promising placement responses to email inquiries concerning boys with ADHD or T1DM and boys with no medical condition were small and not statistically significant (see post-regression hypothesis tests for Model 12 in ).
Post-regression hypothesis tests for Model 12 in show that the probability of receiving a promising placement response among private schools was about 10 percentage points lower when email inquiries concerned a girl with ADHD than when email inquiries concerned a girl with no medical condition. Furthermore, the probability of receiving a promising placement response among public schools was about 6 percentage points lower when email inquiries concerned a girl with ADHD than when email inquiries concerned a girl with no medical condition. These disadvantages were statistically significant. Corresponding differences in promising placement response to email inquiries concerning a girl with T1DM among public and private schools were small and not statistically significant (see post-regression hypothesis tests for Model 12 in ).
4.3. Additional analysis
In the supplementary material, we report some additional analysis and robustness checks. First, as already mentioned we provide a complete pairwise hypothesis testing of differences in outcomes between different experimental conditions using both sampling-based inference (χ2 test) as well as randomization-based inference (Fisher’s exact test) corresponding to information provided in (see Supplementary material: Tables S3–S4). The most relevant and interesting results from this analysis has been discussed earlier in relation to in Section 4.1. Second, we investigated whether using logit or probit models instead of the linear probability models reported in change our estimations, results, and conclusions. Tables S5–S6 in Supplementary material provide comparisons of results using different estimation methods for Models 6 and 12. These comparisons in Tables S5–S6 show that our results and conclusions are robust to different estimation methods. Third, we reexamined Model 6 in and Model 12 in with and without county and email day fixed effects in Supplementary material: Table S7. This analysis showed that the experiment was balanced and that including or excluding county and email day fixed effects did not matter for our conclusions. Fourth, we compared p-values generated by sampling- versus randomization-based inference when testing our overall main hypotheses. These comparisons are provided in Table S2 (but also in Tables S3–S4) in the supplementary material and show that the two statistical inference approaches generate identical (or close to identical) p-values. Finally, the supplementary material provides a complete analysis of nonautomated school responses as an outcome variable (see Supplementary material: Figure S1 and Tables S8–S9). Nonautomated school responses included both those who had and those who had not provided an answer to the two questions asked in the email inquiries. The analysis showed only few, small, and statistically weak or insignificant differences in nonautomated school response rates between different experimental conditions. Hence, the probability of simply receiving a response from the schools was not affected that much by the medical condition of the child in the email inquiry. Hence, discrimination manifested itself in the content of the school responses. This result is well in line with another study, which used a similar experimental method to examine disability discrimination in higher education (Deuchert et al. Citation2017). They, too, found that discrimination against disabled people did not occur in the number of responses they received, but it occurred in the amount of information that was provided in those responses.
5. Discussion and conclusions
While much attention has been paid to discrimination against disabled individuals in the labor market, less is known about the extent to which children with disabilities are discriminated against in school. We add knowledge to this area by presenting results from a field experiment conducted in order to study discrimination against children with ADHD and T1DM whose parents make inquiries about the compulsory preschool class admission in Sweden.
Our overall results reveal discrimination against children with ADHD and T1DM. The results are in line with findings from a field experiment in the US, which documented low response rates from schools to children with special needs (Bergman and McFarlin Jr Citation2020). The overall results in our study reveal an interesting pattern. Our findings show that private schools discriminate against boys and girls with ADHD. Furthermore, our results also show that boys with T1DM are discriminated against when their parents make inquiries about admission to private schools. Finally, our results show that girls with ADHD are discriminated against when their parents make inquiries to public schools.
To sum up, we can conclude that parents to children with certain types of disabilities, i.e. ADHD and T1DM, are discriminated against when they communicate with schools. A possible risk of such discrimination can be that these parents in the end have a smaller pool of schools to choose from than other parents since they are granted an invitation for a visit and receive a promising response to a much lesser extent than other parents. The observed discrimination was more prevalent in private than in public schools and was more distinct when the child had ADHD.
The policy relevance of our study is clear since our results imply that children with disabilities experience unequal access to information and school resources. Research has shown that preschool attendance is positively related to an individual’s years of schooling and highest grade completed (Dietrichson, Kristiansen, and Nielsen Citation2018). Furthermore, preschool attendance is also positively related to an individual’s employment and earnings as an adult (Dietrichson, Kristiansen, and Nielsen Citation2018). Also, if children with disabilities are discriminated against when they apply for school placements, this may increase school segregation. A likely result of this type of discrimination is that children with disabilities are referred to less attractive schools than children without such disabilities. Thus, the fact that children with disabilities are discriminated against in school admission may have long-run for consequences and is a potential obstacle for individuals with certain types of disabilities to succeed in the labor market as adults.
ahmed_hammarstedt_karlsson_SM_v1.pdf
Download PDF (135.5 KB)Disclosure statement
No potential conflict of interest was reported by the authors.
Acknowledgements
The authors thank Jonas Vlachos, editor Colin Green, and two anonymous reviewers for their useful advice. Mats Hammarstedt thanks Marianne and Marcus Wallenberg Foundation for financial support. Ali Ahmed and Mats Hammarstedt thank the Swedish Research Council for financial support.
Additional information
Funding
References
- Ahmed, A. M., L. Andersson, and M. Hammarstedt. 2013. “Are Gay Men and Lesbians Discriminated Against in the Hiring Process?” Southern Economic Journal 79 (3): 565–585. doi:10.4284/0038-4038-2011.317.
- Ameri, M., L. Schur, M. Adya, F. S. Bentley, P. McKay, and D. Kruse. 2018. “The Disability Employment Puzzle: A Field Experiment on Employer Hiring Behavior.” ILR Review 71 (2): 329–364. doi:10.1177/0019793917717474.
- Aranda, C. L. 2015. “Targeting Disability Discrimination: Findings and Reflections from the National Study on Housing Discrimination Against People Who Are Deaf and People Who Use Wheelchairs.” Cityscape (Washington, D C ) 17 (3): 103–122. https://www.jstor.org/stable/26326963.
- Baert, S. 2018. “Hiring Discrimination: An Overview of (Almost) All Correspondence Experiments Since 2005.” In Audit Studies: Behind the Scenes with Theory, Method, and Nuance, edited by S. Gaddis, 63–77. Cham: Springer.
- Becker, G. S. 1957. The Economics of Discrimination. Chicago: University of Chicago Press.
- Bergman, P., and I. McFarlin Jr. 2020. “Education For All? A Nationwide Audit Study of School Choice.” NBER Working Paper 25396. https://www.nber.org/papers/w25396.
- Bertrand, M., and E. Duflo. 2017. “Field Experiments on Discrimination.” In Handbook of Field Experiment, edited by A. Banerjee and E. Duflo, 309–393. Amsterdam: North Holland.
- Böhlmark, A., H. Holmlund, and M. Lindahl. 2016. “Parental Choice, Neighbourhood Segregation, or Cream Skimming? An Analysis of School Segregation After a Generalized Reform.” Journal of Population Economics 29 (4): 1155–1190. doi:10.1007/s00148-016-0595-y.
- Cox, D. J., and L. Gonder-Frederick. 1992. “Major Developments in Behavioral Diabetes Research.” Journal of Consulting and Clinical Psychology 60 (4): 628–638. doi:10.1037/0022-006X.60.4.628.
- Deuchert, E., L. Kauer, H. Liebert, and C. Wuppermann. 2017. “Disability Discrimination in Higher Education: Analyzing the Quality of Counseling Services.” Education Economics 25 (6): 543–553. doi:10.1080/09645292.2017.1325838.
- Diaz-Serrano, L., and S. Flamand. 2020. “Schools’ Attitudes Towards Single Parents: Experimental Evidence.” IZA Discussion Paper Series 13699. http://ftp.iza.org/dp13699.pdf.
- Diaz-Serrano, L., and E. Meix-Llop. 2016. “Do Schools Discriminate Against Homosexual Parents? Evidence from An Internet Field Experiment.” Economics of Education Review 53 (August): 133–142. doi:10.1016/j.econedurev.2016.06.001.
- Dietrichson, J., I. L. Kristiansen, and B. C. V. Nielsen. 2018. “Universal Preschool Programs and Long-Term Child Outcomes: A Systematic Review.” IFAU Working Paper 19. https://www.ifau.se/sv/Forskning/Publikationer/Working-papers/2018/universal-preschool-programs-and-long-term-child-outcomes/.
- Eisenberg, D., and H. and Schneider. 2007. “Perceptions of Academic Skills of Children Diagnosed with ADHD.” Journal of Attention Disorders 10 (4): 390–397. doi:10.1177/1087054706292105.
- Figlio, D. N. 2007. “Boys Named Sue: Disruptive Children and Their Peers.” Education Finance and Policy 2 (4): 376–394. doi:10.1162/edfp.2007.2.4.376
- Fletcher, J. 2010. “Spillover Effects of Inclusion of Classmates with Emotional Problems on Test Scores in Early Elementary School.” Journal of Policy Analysis and Management 29 (1): 69–83. doi:10.1002/pam.20479.
- Fumarco, L. 2017. “Disability Discrimination in the Italian Rental Housing Market: A Field Experiment with Blind Tenants.” Land Economics 93 (4): 567–584. doi:10.3368/le.93.4.567.
- Hinnerich, B. T., E. Höglin, and M. Johannesson. 2015. “Discrimination Against Students with Foreign Backgrounds: Evidence from Grading in Swedish Public High Schools.” Education Economics 23 (6): 660–676. doi:10.1080/09645292.2014.899562.
- Jones, M. K. 2008. “Disability and the Labor Market: A Review of the Empirical Evidence.” Journal of Economic Studies 35 (5): 405–424. doi:10.1108/01443580810903554.
- Kristoffersen, J. H. G., M. V. Krægpøth, H. S. Nielsen, and M. Simonsen. 2015. “Disruptive School Peers and Student Outcomes.” Economics of Education Review 45 (April): 1–13. doi:10.1016/j.econedurev.2015.01.004.
- Mueller, A. K., A. B. Fuermaier, J. Koerts, and L. Tucha. 2012. “Stigma in Attention Deficit Hyperactivity Disorder.” ADHD Attention Deficit and Hyperactivity Disorders 4 (3): 101–114. doi:10.1007/s12402-012-0085-3.
- Patterson, C., L. Guariguata, G. Dahlquist, G. Soltész, G. Ogle, and M. Silink. 2014. “Diabetes in the Young–A Global View and Worldwide Estimates of Numbers of Children with Type 1 Diabetes.” Diabetes Research and Clinical Practice 103 (2): 161–175. doi:10.1016/j.diabres.2013.11.005.
- Polanczyk, G., M. S. De Lima, B. L. Horta, J. Biederman, and L. A. Rohde. 2007. “The Worldwide Prevalence of ADHD: A Systematic Review and Metaregression Analysis.” American Journal of Psychiatry 164 (6): 942–948. doi:10.1176/ajp.2007.164.6.942.
- Schabert, J., J. L. Browne, K. Mosely, and J. Speight. 2013. “Social Stigma in Diabetes.” The Patient - Patient-Centered Outcomes Research 6 (1): 1–10. doi:10.1007/s40271-012-0001-0.
- Skogli, E. W., M. H. Teicher, P. N. Andersen, K. T. Hovik, and M. Øie. 2013. “ADHD in Girls and Boys–Gender Differences in Co-Existing Symptoms and Executive Function Measures.” BMC Psychiatry 13 (298): 1–12. doi:10.1186/1471-244X-13-298.
- Soltesz, G., C. C. Patterson, G. Dahlquist, and EURODIAB Study Group. 2007. “Worldwide Childhood Type 1 Diabetes Incidence–What Can We Learn from Epidemiology?” Pediatric Diabetes 8 (s6): 6–14. doi:10.1111/j.1399-5448.2007.00280.x.
- Swedish Code of Statutes. 2008:567. The Discrimination Act. https://www.riksdagen.se/sv/dokument-lagar/dokument/svensk-forfattningssamling/diskrimineringslag-2008567_sfs-2008-567.
- Swedish Code of Statutes. 2010:800. The Education Act. http://www.riksdagen.se/sv/dokument-lagar/dokument/svensk-forfattningssamling/skollag-2010800_sfs-2010-800.
- Swedish National Agency for Education. 2018. Curriculum for the Compulsory School, Preschool Class and School-Age Educare. Stockholm: Norstedts Juridik. https://www.skolverket.se/getFile?file=3984.
- Swedish National Agency for Education. 2020. Välja förskoleklass och grundskola eller grundsärskola. https://www.skolverket.se/regler-och-ansvar/ansvar-i-skolfragor/valja-forskoleklass-och-grundskola-eller-grundsarskola.
- Willcutt, E. G. 2012. “The Prevalence of DSM-IV Attention-Deficit/Hyperactivity Disorder: A Meta-Analytic Review.” Neurotherapeutics 9 (3): 490–499. doi:10.1007/s13311-012-0135-8.
- World Health Organization. 2011. World Report on Disability. Geneva: World Health Organization. https://apps.who.int/iris/rest/bitstreams/53067/retrieve.