
 ?Mathematical formulae have been encoded as MathML and are displayed in this HTML version using MathJax in order to improve their display. Uncheck the box to turn MathJax off. This feature requires Javascript. Click on a formula to zoom.
ABSTRACT
We use sequence analysis to compare the different trajectories that individuals take through the education system and into work and identify the characteristics that could be used to target those who are at most risk of poorer labour market outcomes. As well as age 16 exam performance, we find that parental advice, aspirations, and attitudes towards HE are important predictors of the pathways through education and into work. However, these pathways are not strongly determined at the end of compulsory education, and thus there are still opportunities for individuals to change their trajectory even after leaving school.
1. Introduction
In the economics of education literature, the benefits of education in terms of labour market outcomes are typically examined through estimating the wage returns either to the number of years of education or to particular qualifications. The first approach fails to account for different qualifications studied and achieved during the years of education, while the second approach fails to account for the fact that different pathways through the education system can ultimately result in the same qualification. Each of these various education pathways may be associated with broadly similar or very different labour market outcomes in terms of earnings and employment and while some pathways may facilitate smooth ‘school to work transitions’, others may lead to less successful transitions into the labour market (Dorsett and Lucchino Citation2014). The transition from school to work is a key stage in individuals’ lives which has long-term social and economic consequences. Pathways involving protracted job search and prolonged unemployment are likely to lead to less favourable long-term outcomes, since youth unemployment has been found to have adverse effects on the probability of finding work, pay and life chances (Bell and Blanchflower Citation2011; Machin and Manning Citation1999; Gregg and Tominey Citation2005).
Over the past 30 years across industrialised countries, a growing demand for higher-skilled and more highly educated workers, coinciding with increasing participation in Higher Education (HE), has led to an expansion in the number and variety of routes that individuals take in their transition from education into work. Pathways from education to employment have become lengthier, more complex and de-standardised, often consisting of a sequence of transitions as opposed to a single event during which an individual leaves education and joins the labour market (Keep Citation2012; OECD Citation2000; Quintini, Martin, and Martin Citation2007; Raffe Citation2008). Both the US (Boylan Citation2020) and the UK (Anders and Dorsett Citation2017; Dorsett and Lucchino Citation2014) have experienced this phenomenon. Even in Germany, where the proportion of young people broadly following a general pathway from compulsory education to vocational education and training or tertiary education and into employment has increased over time, transition patterns have become more heterogeneous and protracted (Brzinsky-Fay and Solga Citation2016; Achatz, Jahn, and Schels Citation2022). More generally, a rich literature has documented considerable diversity in the transition pathways from education into work for young people. This includes: Quintini, Martin, and Martin (Citation2007) for the EU; Cebulla and Whetton (Citation2018) for Australia; Opheim (Citation2007) and Markussen (Citation2017) for Norway; OECD (Citation2010) for Canada; and Middeldorp, Edzes, and van Dijk (Citation2019) for Dutch students. These papers variously highlight the importance of individual characteristics, social and economic circumstances, as well as the role of institutions in accounting for the differences between individuals across countries and over time.
In the UK, the commitment to the widening participation agenda has initiated an expansion in the number and variety of pathways that can lead individuals into HE, beyond the traditional route of school exit and direct entry into the labour market. As a result, there are a multitude of pathways through which individuals can progress through the education system. A UK graduate entering the labour market, for example, may have taken their RQFFootnote1 Level 6 undergraduate degree following two years of A-levels (RQF Level 3) in either a school/6th form or in a Further Education (FE) college, or possibly after acquiring a Level 3 vocational qualification, or maybe after a ‘gap year’.
It is well documented in the returns to education literature that graduates benefit from positive earning differentials and better employment prospects than non-graduates on average (Walker and Zhu Citation2013; Blanden and McMillan Citation2016: Belfield et al. Citation2018).Footnote2 Thus, efforts have been made by policymakers and institutions alike to improve the rates of university attendance and completion by those who are typically under-represented in HE, for example, those from disadvantaged backgrounds, such as those eligible for Free School Meals (FSM), from low-income families, the first in family to attend HE and ethnic minorities (Britton et al. Citation2016; Gorard et al. Citation2017; Walker and Zhu Citation2018: Henderson, Shure, and Adamecz-Völgy Citation2019).Footnote3 The increased flexibility in the route to HE entry, outside of the typical A-level route, has allowed for the incorporation of other pathways through FE into HE, and the number of students entering university with Level 3 vocational qualifications is significant and growing (Hupkau et al. Citation2016).
The majority of students in the UK, however, do not enter HE, but take non-graduate pathways into the labour market. These pathways are equally varied and may comprise of education in the form of vocational qualifications, apprenticeships, or A-levels. Heterogeneity exists even within these steps with vocational education, for example, offering a vast array of qualifications. These non-graduate pathways have received the least attention in terms of policy and are the pathways for which the evidence is most limited with regard to the labour market value of each pathway and, moreover, the characteristics associated with selection into these ‘in-between routes’ (D’Arcy and Finch Citation2016). Current policy and evidence alternatively focus on estimating the returns to, and widening participation in high-skilled qualifications and pathways (e.g. HE) and, at the other end of the spectrum, improving the prospects of the low-skilled and those who follow pathways leading to poor labour market outcomes.
Policymakers have demonstrated an ongoing commitment to understanding the risk factors and characteristics associated with vulnerability to poor outcomes. Though the study of the specific pathways that lead to outcomes such as Not in Education, Employment or Training (NEET), is currently limited, the existing evidence identifies that individual characteristics associated with poorer outcomes, such as NEET, include looked after children, Special Educational Needs (SEN) and young careers (Powell Citation2018). The Department for Education (Citation2018) recognise that poor attainment is a major barrier to progression in education in certain pathways and is an avenue to less favourable labour market outcomes. For example, not achieving any GCSEs A*-C at the end of KS4 is a significant determinant of NEET while progression into higher-level qualifications from vocational or lower-level qualifications is dependent on GCSE attainment (Robinson Citation2019; Machin, McNally, and Ruiz-Valenzuela Citation2020). Identifying and characterizing the pathways to poor outcomes may assist policymakers in strategies to limit the damaging individual-level implications for health, long-term employment and earnings prospects (Public Health England Citation2014; Robinson Citation2019). In doing so, the economic repercussions may be alleviated, in terms of youth unemploymentFootnote4 and precarious employment, which has become an issue of policy concern following the recent growth in zero-hours contracts, agency work or involuntary temporary employment in the UK (Standing Citation2011; Farina, Green, and McVicar Citation2020).
In this paper, we incorporate the heterogeneity in the pathways through the education system that individuals can take from school into the labour market by constructing the post-school transition histories of individuals in Next Steps [formerly the Longitudinal Study of Young People in England (LSYPE)], a sample of the cohort who completed their compulsory schooling in England in 2006. We consider the various combinations of qualifications studied and other activities, and examine their early labour market experiences, in order to address three main research questions: Firstly, what are the principal pathways taken through compulsory, further, and higher education into the labour market by young people in England? Secondly, what are the earnings and employment differentials associated with the different pathways? We assess whether some routes lead to better labour market outcomes than others for the same qualification level outcomes. Thirdly, can the pathways that individuals follow after the end of compulsory schooling be robustly predicted based on their characteristics while still at school? If pathways can be predicted, this provides us with the opportunity to explore whether it is possible to identify the (groups of) individuals more likely to make pathway choices which lead to poorer labour market outcomes, for example, NEET.
Methodologically, we make use of sequence analysis techniques (Abbott Citation1995) in order to compare and contrast the different transitions through education and into work. Sequence data are ordered lists of elements, where each element describes a particular state. Sequences are considered as whole entities, with the group of events treated as a single unit of analysis. Analysis of such data is complex, in part due to the large number of different sequences that can occur.Footnote5 Sequence analysis techniques derive measures of ‘distance’ between different sequences which can be used to group more similar sequences into clusters in order to reduce the dimensionality of the analysis. In this paper, sequence methods allow us to consider individuals’ education outcomes and early labour market experiences as a single entity, rather than treating them as distinct and separate events. Our findings indicate that young people follow a range of diverse pathways upon completion of compulsory education. A range of parental, family and individual characteristics influence the pathway initially followed with gender, ethnicity, deprivation, individual and parental attitudes and parental encouragement all playing a role in the likelihood of following a particular pathway through post-compulsory education. However, these pathways are not strongly pre-determined at the age of 16, and there is potential to change trajectory one, two, or even three years after leaving compulsory education.
The remainder of the paper is structured as follows. Section 2 provides a review of the education to labour market transitions literature which applies sequence analysis. Section 3 gives an overview of sequence analysis method and introduces the data. Section 4 presents the results of our analysis; finally, Section 5 summarises and concludes.
2. Sequence analysis of education to employment transitions
There are a few previous applications of sequence analysis techniques in the economics of education literature which have utilised these methods to study the transitions from education into the labour market of young people in the UK. McVicar and Anyadike-Danes (Citation2002) adopt sequence methods to study the trajectories of individuals in Northern Ireland from school into work. Their analysis produced five distinct pathways described as (1) employment dominated; (2) higher education (HE) dominated; (3) FE dominated; (4) joblessness dominated; and (5) long spell of vocational education/training dominated. The fourth cluster is described as an ‘unsuccessful’ transition due to the prevalence of joblessness, a definition we adopt in our own characterisation of pathways when we distinguish between ‘successful’ and ‘unsuccessful’ pathways. McVicar and Anyadike-Danes (Citation2002) predict the probability of an individual experiencing each type of pathway. They find males to be more likely to take the employment dominated pathway and find a strong positive effect of achieving five or more GCSEs at grades A*-C on the likelihood of both HE and FE-dominated transitions. Family background characteristics are also found to be influential in predicting the transition pathway, including the father’s employment status, living in a single-parent household, and the father’s employment in a managerial or professional occupation. The paper concludes that the individuals most at risk of eventually following an unsuccessful pathway are characterised by poor qualifications, located in western Northern Ireland, unemployed fathers or fathers employed in low-paying occupations, single-parent households, female, and Catholic backgrounds.
De Coulon et al. (Citation2017) use sequence analysis to characterise the first three years of post-compulsory education, using the Longitudinal Education Outcomes (LEO)Footnote6 administrative data to analyse one cohort of school leavers in England, born during the 1994/95 academic year. The analysis focuses on the 10% of individuals in the cohort who transition from school into low-level vocational training (below Level 2). Four pathways are identified for this group: (1) progression to higher-level vocational training; (2) progression to apprenticeships; (3) NEET status; and (4) sustained employment. They find that achievement of a low-level qualification can lead to better employment and earnings outcomes. Our study takes a similar approach, but we consider all of the potential pathways young people can take immediately following school, rather than focusing on those that a restricted set of individuals might select. Furthermore, our data sources contain a much richer set of variables which capture individual, parental, and family background characteristics, measured prior to leaving school, with which we can potentially explain the pathways individuals eventually follow upon leaving compulsory education, as well as an analysis of outcomes from those pathways.
Anders and Dorsett (Citation2017) similarly use sequence methods to study transitions into the labour market. They use a number of cohort studies, including Next Steps,Footnote7 to construct sequences for different cohorts of English school-leavers over a 30-year period. In contrast to this paper, they do not use the final wave of Next Steps and therefore cannot follow those who go into higher education prior to their entry into the labour market. Anders and Dorsett (Citation2017) consider three broad pathways termed: (1) Entering the Labour Market; (2) Acquiring Human Capital; and (3) Potential Cause for Concern. Such a broad typology allows them to observe the same types of pathway over the three-decade period they consider. However, their typology lacks any differentiation in the pathways through education in which we are particularly interested. As in McVicar and Anyadike-Danes (Citation2002), Anders and Dorsett (Citation2017) focus on the determinants of following each type of pathway and how the transition from school into work has changed over time. They find indicators of low socio-economic background to be a strong predictor of experiencing unsuccessful transitions.
Scherer (Citation2001) and Brzinsky-Fay (Citation2007) also use sequence methods to investigate labour market transitions for the UK and also for West Germany (in Scherer Citation2001) and for other EU countries (in Brzinsky-Fay Citation2007). Scherer (Citation2001) utilises the German Socio-Economic Panel (GSOEP) and the British Household Panel Survey (BHPS). The sequences analysed do not include spells of education, the focus being on post-education transitions into the labour market. The paper finds that while there are common sequence types, there are also unique pathways in each country. In addition, the proportion of unemployment-dominated careers is much higher in the UK. Using European Community Household Panel (ECHP) data, Brzinsky-Fay (Citation2007) partitions the set of pathways of individuals who left school between 1993 and 2000 into meaningful groupings. As with Anders and Dorsett (Citation2017), he does not consider different types of education in any detail nor does he further model the determinants of the membership of the resulting clusters. Interestingly, Brzinsky-Fay (Citation2007) finds that all of the clusters identified appear in every EU country in the data.Footnote8
In this paper, we contribute to the existing literature on transitions into the labour market using sequence analysis by examining a relatively recent cohort of young people who not only have finished their schooling but have also had time to come to the end of their post-compulsory education and to enter the labour market. We use the Next Steps data for its rich variety of background characteristics such as those which were found to be important determinants of transition pathways by McVicar and Anyadike-Danes (Citation2002) but which are not generally available in administrative data such as that used by De Coulon et al. (Citation2017). By incorporating the recently released final wave of Next Steps into our analysis, we are able to examine a longer set of sequences than other studies have considered, covering a nine-year period from age 16 in 2006 to age 25 in 2015. The data allows us to not only model the determinants of the pathways we identify but also to analyse the labour market outcomes associated with these different pathways.Footnote9
3. Data and methodology
3.1 Data
We make use of the Next Steps data collected from the cohort of individuals born during the 1989/1990 academic year. This is linked to information on prior attainment from the NPD.Footnote10 The advantage in using the Next Steps data is its breadth of information about the individual, their aspirations and attitudes, family background, and parental attitudes, all of which are potentially informative about the decisions and constraints young people face at the end of their compulsory schooling and as they transition into the labour market. Next Steps also contains information on labour market outcomes at age 25, including employment status and earnings.
Initially, 15,770 individuals were interviewed in Next Steps Wave 1, when they were in Year 9 aged 13/14. Following Anders and Dorsett (Citation2017), we remove individuals lost to the sample through attrition. We construct sequences of individuals’ monthly activities from Next Steps Waves 4–7 (i.e. from September 2006, the first month of the academic year commencing after the Next Steps cohort have completed their compulsory education, up until May 2010), yielding sequences of length 45 elements (months) for each individual. We combine the histories files with wave-specific information on the type of qualifications being studied if the individual is in education. In constructing our sequences, we use data from individuals who remained in the sample up to Wave 7, yielding 8234 individuals. This number falls further when we combine the sequence data with outcomes from Next Steps Wave 8 at age 25. In Wave 8, just under 50% of the initial sample provided responses.
We address the issue of attrition by applying probability weights throughout all of our regressions. We use a logit model to estimate, firstly, the probability that an individual from the full original sample of 15,770 remains in our sample of sequences as a function of characteristics observable in Wave 1. We then use the inverse of the predicted probabilities to construct an attrition weight for the analysis of the determination of pathway taken. We estimate an additional attrition model for the individuals who remain in Wave 8 from our sample of sequences, in order to construct a similar weight for our outcomes analysis, based on the inverse of the product of both of these probabilities. This second attrition model uses the same Wave 1 information as the first attrition model and additionally includes characteristics observable up to Wave 7.
3.2 Methodology
3.2.1 Sequence and cluster analysis
We are interested in characterising and modelling the sequence of events and the pathway that an individual takes to reach a given outcome. In such a setting, typical panel data econometric techniques are undesirable since their strengths lie in modelling a particular individual’s status at a given point in time. We alternatively employ sequence analysis techniques to evaluate the myriad of different pathways that individuals can take through the education system into the labour market. A sequence is an ordered list of elements, where each element records a particular state or status. These sequences are considered collectively as an entity, rather than having regard to their individual elements. Sequence analysis identifies groups of individuals with more similar ordered lists of elements. Scoring algorithms are used to decide the degree to which any two individuals’ sequences are similar. For the purpose of further analysis, similar sequences are then grouped together by cluster analysis.
A more comprehensive description of sequence analysis is provided in the online Appendix. For a particularly detailed discussion and comparison of the different approaches to sequence analysis, see Studer and Ritschard (Citation2016).
This paper addresses our research questions in a three-stage analysis. In the first stage, we obtain the dissimilarity matrix containing the costs associated with transforming each pairwise comparison of sequences. We then perform a cluster analysis to group more similar sequences (i.e. individuals’ histories) together based on their (dis)similarities. In the second stage of our analysis, we identify the labour market outcomes (at age 25) associated with these groups of individuals by including cluster indicators as explanatory variables in standard (Mincerian) wage and employment regressions. The final stage of the analysis is to estimate a multinomial logit model to predict the pathways individuals typically follow based on their observable prior characteristics – that is, their characteristics while still in compulsory schooling. These characteristics can potentially be targeted by policymakers in order to maximise the chances of young people experiencing transitions through post-compulsory education and into the labour market which are associated with ‘good’ labour market outcomes.
In the initial stage of our empirical work, we construct sequence data which describe the transitions young people make from school to the labour market by age 25. We use the Next Steps Wave 7 activity history files to construct monthly sequences of activity. Education is one category of activity in the history files. In order to obtain more detailed information on the type of education individuals are undertaking, we use the main interview file of each wave and allocate to each individual the highest qualification they are studying (as recorded in the RQF) in that wave to the corresponding months of their sequence.
The nine possible states an individual can be in at a given point in time in the sequence are listed in , along with the labels used for each of the states and the percentage of the (8234 individuals by 45 months = Footnote11) 370,530 elements in each state. One of the states is defined as ‘Unknown’, comprising around 1% of the total number of sequence elements and representing months where there was no activity history recorded. Such observations can be left missing and dealt with in the sequence analysis using insertions or coded as a distinct state with its own specified indel and substitution costs.Footnote12 We take the latter approach. Education is subdivided into five categories: GCSEs (GCSE); vocational qualifications below Level 3 (VBL3); vocational qualifications at Level 3 (VL3); A-Levels (ALEV); and Level 4+ qualifications including higher education (HE). The latter category overwhelmingly consists of individuals while attending university. A negligible number of individuals in this category take higher-level vocational qualifications but not in large enough numbers to form a distinct category. Individuals can potentially study a combination of qualifications which means the education categories are not mutually exclusive, so individual elements are categorised by the highest RQF level being attempted at that point in time.
Table 1. Possible states and activities in the sequence data.
Having constructed our sequence data, we next calculate measures of dissimilarity between each pairing of the sequences in our data. This requires the specification of the indel and substitution costs. We take a data-driven approach to assigning these costs. Following Studer and Ritschard (Citation2016) we set indel costs independently for each state where the cost is a monotonic – logarithmic – function of the inverse of the frequency, , of state observations. Substitution costs between any two states are equal to the sum of the respective indel costs. The indel costs,
, and substitution costs,
, are therefore defined as:
Indel costs are state-dependent and set to be inversely proportional to the frequency,
, of observing the state in the data. This approach has the benefit of being completely data driven, with no subjective determination of parameters by the researcher thus removing the criticism of subjective bias being introduced into the analysis. Further, since costs are data-driven, it also introduces consistency into the costs of an editing operation – substitution of state a with state b can only be done at a single fixed cost. If indel costs were fixed and constant across states, then a deletion of state b and insertion of state a may have a different cost to the substitution of state a for state b. presents the indel and substitution costs.Footnote13
Table 2. Sequence indel and substitution costs.
We explore a number of the algorithms (as discussed in detail in the online Appendix), using the classical optimal matching (OM) algorithm as well as optimal matching of spells (OMspell), optimal matching of transitions (OMstran), and Dynamic Hamming Distances (DHD). In our main results, we use the output of the OMstran algorithm with the w parameter set to 0.5, giving equal weight to the origin state and to the type of transition, as discussed in the Appendix. We simply use the substitution costs presented in for the transition costs required for OMstran, i.e. we set. .
Finally, we perform cluster analysis of the dissimilarity matrix obtained from the sequence analysis which combines the data into a smaller number of manageable groupings for further analysis. While each resulting cluster will consist of pathways which differ from each other, each sequence is grouped with other sequences which are more similar to each other than to the sequences in the other clusters. There is consequently a trade-off between reducing within-cluster heterogeneity and maintaining a sufficiently small number of clusters for meaningful analysis. We use an agglomerative (bottom-up) hierarchical clustering approach. Under this approach, each observation (or sequence) is initially considered its own cluster. Clusters are then combined sequentially, at each stage finding the ideal pairing of clusters to merge based on an objective function. We choose the Wards method, which at each stage minimises within-cluster variance. This is chosen to give us the most homogenous clusters possible at each stage. McVicar and Anyadike-Danes (Citation2002) and Scherer (Citation2001) also both use hierarchical clustering, while Anders and Dorsett (Citation2017) use the non-hierarchical k-medians approach.
3.2.2. Pathway outcomes and determinants analysis
We next use the categorical variable indicating their cluster as an explanatory variable in regression models of outcomes at age 25. This stage of the analysis addresses our second research question. These regressions indicate the conditional outcomes associated with each pathway, allowing us to categorise the pathways in terms of the employment and earnings outcomes they lead to. We consider three outcome variables; log weekly income, log hourly wage of individuals in employment, and the probability that an individual is observed in employment at the time of their Wave 8 interview. The first two outcomes are modelled using OLS regression, and the third by logit, from which we recover marginal effects.
Formally, we estimate three equations:
where
is total weekly income at age 25,
is the hourly wage (conditional on employment) at age 25, and
is a dummy variable indicating that the individual is observed in employment at age 25;
is a vector of background characteristics including gender, ethnicity, government office region, and whether or not the individual has received any on the job training since the wave 7 interview;
comprises variables measuring prior attainment – standardised point scores at Key Stages 2, 3, and 4, and indicators for having obtained a Grade C or above in GCSE Maths and English.
The final stage of analysis addresses our final research question; we identify the characteristics of individuals, while they are still in school, which are significant predictors of the pathways that they ultimately follow and construct a model aiming to predict as accurately as possible the pathway that an individual will follow. Similar to the existing literature, we jointly estimate the probability that an individual takes each of the pathways identified in our cluster analysis in a multinomial logit framework. With our pathways composed of sequences beginning in the autumn after the individual completes compulsory schooling at age 16, we use a rich set of background characteristics available to us when the cohort were aged between 14 and 16 (Waves 1, 2 and 3 of the Next Steps surveys linked with the NPD) to construct an empirical model which predicts the pathway the individual followed. We also consider the ability of subsets of variables independently to predict the pathway the individual takes.
We consider a range of individual and family characteristics alongside the attitudes and behaviours of the young person and of their parents and school characteristics. In addition, given the role that educational attainment plays in allowing for progression through different routes of education (Collier, Valbuena, and Zhu Citation2018; Stopforth, Gayle, and Boeren Citation2021), we explore the role of attainment measures including the number of GCSEs at A*-A, B-C, and D-G, A*-C GCSE in Maths, A*-C GCSE in English, overall KS4 point score, KS3 and KS2 English and Maths. Gender differences exist in the route through post-compulsory education and within routes, in subject choice (McDool and Morris Citation2020), thus the role of gender in determining the pathways taken is explored. Similarly, the role of ethnicity is examined since not only does the level of education obtained vary by ethnic group but so does labour market participation and returns (Metcalf Citation2009). We also explore the role of SEN which is associated with poor outcomes such as NEET (Powell Citation2018), in addition to government office region due to the role of local labour markets and access to educational institutions which may vary by region. Family background characteristics include FSM and the index of multiple deprivation (IMD) to measure socio-economic disadvantage which significantly influences attainment (Vignoles and Meschi Citation2010) though arguably fail to capture the multi-dimensionality of social advantage (Stopforth, Gayle, and Boeren Citation2021) and the likelihood of staying on in education (Hupkau et al. Citation2016); we therefore also examine household tenure which is associated with school outcomes (Gayle, Murray, and Connelly Citation2016) and home access to computer and/or internet as a proxy for educational resources available in the home learning environment. We also explore the influence of living in a single-parent household and parental occupation since McVicar and Anyadike-Danes (Citation2002) identify that fathers that are unemployed or employed in low paying occupations and single-parent households put individuals at greater risk of eventually following an unsuccessful pathway. In addition to parental background characteristics, we consider the number of parents attending parents evening and the parents’ aspirations for the young person at age 16, as proxies for general parental engagement which is positively associated with school progress (Feinstein and Symons Citation1999) and is likely to influence positive attitudes towards pathways involving remaining in education. Furthermore, we explore the role of individual attitudes and behaviours including risk factors (a 1–8 scale indicating the number of self-reported risky behaviours engaged in including smoking, drinking, cannabis, graffiti, and shoplifting) since engagement in risky behaviours has adverse effects on outcomes at age 18, including NEET (Campbell et al. Citation2020). In addition to taking vocational qualifications at school which may increase the likelihood of continuing on a vocational path of study or training, we observe the relationship between the reported likelihood of applying to university and the advice on continuing in FE from parents, family, siblings, friends, teachers, and careers advisors on the pathway taken since aspirations and advice are both likely to influence the likelihood of taking particular pathways (Dickerson, Maragkou, and McIntosh Citation2018). Finally, we explore school characteristics, in particular, the school’s: proportion of pupils with 5 A*-C GCSE attainment, proportion of pupils receiving FSMs and the proportion of non-white pupils. The ability and socio-economic background of school peers has an influential role in an individual’s aspirations to follow a particular route through post-compulsory education, conditional on their plans to remain in education (Dickerson, Maragkou, and McIntosh Citation2018).
4. Analysis
We present our analysis in three stages. First, we present descriptive statistics of the sequences and results of the cluster analysis on the dissimilarity matrix as discussed in the previous section, before assessing the labour market outcomes associated with the different pathways by modelling outcomes at age 25 as a function of pathway taken, controlling for qualifications taken. Finally, having identified the labour market returns to each pathway, we present our analysis of the determinants of the pathway taken.
4.1 Sequence analysis and clustering
and summarise the sequence data in an index plot and a distribution plot, respectively. plots each sequence in the data, each individual represented by a horizontal line indexed on the y-axis, which represents the number of observations. Sequences are arrayed vertically in order of similarity to the modal sequence in the data which is two years of A-Levels (ALEV) followed by a continuous spell of higher education (HE) as the individual progresses onto university. shows the proportion of the sequences distributed across states at each point in time. Almost 60% of the sample begin their sequence in the A-Level state (ALEV), falling to around 40% by the end of the first 24 months. Around 25% of the sample begins the period in some form of vocational education – predominantly taking qualifications below Level 3 (VBL3), though this proportion reduces and the proportion studying at Level 3 (VL3) increases one year into the sequences. As shown in , this is due to progression – some individuals advance from Level 2 vocational qualifications in the first year out of school to Level 3 qualifications in the second year. Note that, while the analysis is based on individuals’ 45 monthly records of their activities, many of the transitions observed are at the beginning of the school/academic year in September.
Figure 1. Full sample sequence index plot.
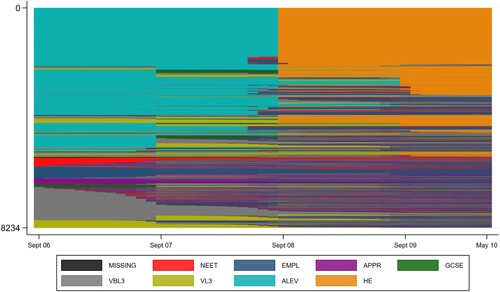
Figure 2. Full sample sequence distribution plot.
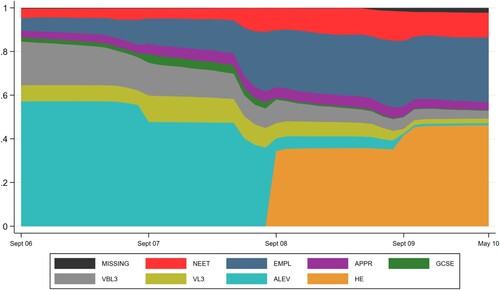
A smaller fraction of individuals begins an apprenticeship (APPR) or are observed re-sitting GCSE qualifications (GCSE) without undertaking additional vocational or academic qualifications. Although the Next Steps cohort pre-date the requirement for young people to remain in education or training until age 18, around 90% of the sample are observed doing so.Footnote14 The remaining 10% of the sample are observed progressing directly into employment or a minority into NEET status. As would be expected, over time we observe an increase in the proportion of individuals in employment or NEET status as they leave FE.Footnote15 Those not in any form of education or training by the end of the sequences account for around 40% of the sample, of which around three quarters are in employment and the remainder NEET with a negligible number of unknowns. Just over 40% of the sample are observed in HE from September 2009 (or the fourth-year post-school), a noticeable increase from the approximately 35% who enter HE in September 2008, suggesting a significant number of individuals who take a gap year or undertake three years of FE before progressing into HE.
The choice of number of clusters to use for the subsequent analysis represents a trade-off between parsimony and reducing within-cluster heterogeneity in the composite sequences. The smaller the number of clusters, the greater the variation in sequences within clusters. Alternatively, too many clusters will produce a large number of pathways which may not be sufficiently differentiated. Following McVicar and Anyadike-Danes (Citation2002) we therefore initially produced a larger number of clusters (12) than we intended to use to identify the key pathways and then reduced the number of clusters while still keeping the key pathways of interest in distinct clusters. This approach produced six clusters. and show the sequences when divided into the six groups obtained from the cluster analysis applied to the dissimilarity matrix.
Figure 3. Six-pathway typology sequence index plots – 45-month sequences.
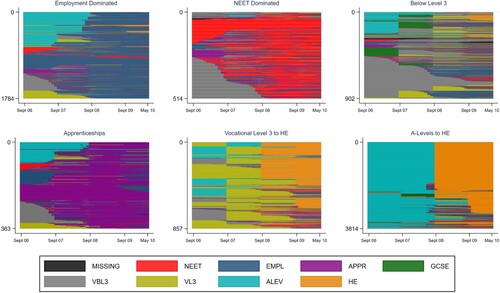
Figure 4. Six-pathway typology modal plot of sequences.
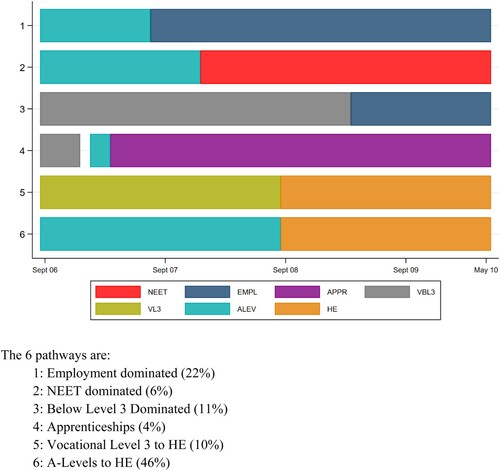
shows index plots for each cluster analogous to the aggregate index plot presented in . is a modal plot, showing the modal state at each point in time separately for each of the six clusters. These six clusters represent our typology of educational pathways which we characterise as follows.
Pathway 1 (P1): Employment dominated – Early labour market entry either immediately after school or within two years after some initial FE. Sequences allocated to this cluster: 22%
Pathway 2 (P2): NEET dominated – Immediate entry into permanent NEET status or entry after a spell of predominantly low-level education or in some cases a short apprenticeship or employment spell. Sequences allocated to this cluster: 6%
Pathway 3 (P3): Below Level 3 Dominated – Mostly starting with below Level 3 vocational education, or GCSE re-sits. Some progression to employment or vocational Level 3. Sequences allocated to this cluster: 11%
Pathway 4 (P4): Apprenticeships – Spells of apprenticeship training, often following a spell of A-level or vocational study. Sequences allocated to this cluster: 4%
Pathway 5 (P5): Vocational Level 3 to HE – Level 3 vocational qualifications, often combined with A-Levels, mostly leading to progression to HE. Sequences allocated to this cluster: 10%
Pathway 6 (P6): A-Levels to HE – The ‘standard’ academic route – mostly two years of A-Levels followed by progression to HE. Sequences allocated to this cluster: 46%
and indicate a potential problem in attempting to predict the pathways individuals take based on their characteristics while still at school. This issue stems from the heterogeneity evident in the clusters. For example, the two most observed states in the first months – vocational below Level 3 (VBL3), and A-Levels (ALEV) – are prevalent in a number of the pathways. Across the first five pathways in , vocational below Level 3 leads on to employment, NEET status, apprenticeships, or vocational qualifications at Level 3. Even if individuals’ characteristics and test scores at age 16 may be able to accurately predict those more likely to take lower-level vocational qualifications immediately after completing compulsory education, it is probably the subjects studied and subsequent education performance which will determine the pathway which is followed beyond that. This suggests that predicting entire pathways on the basis of characteristics observable at age 16 may be difficult. In the case of vocational qualifications below Level 3, the model could allocate the individual between any one of four or five pathways, unless prior characteristics are strongly associated with both subject and performance and potential changes in preferences over time through experience of studying the qualification. This is likely to be a strong assumption and we investigate this further below.
4.2 Analysis of pathway outcomes
presents the results from the Wave 8 labour market outcome equations.Footnote17 We model three outcomes: weekly income, hourly wage and employment, and estimate three specifications for each; starting with pathway indicator dummies only. We add a basic set of demographic characteristicsFootnote18 then a set of controls capturing innate ability and educational attainment at age 16.Footnote19 In the third specification, we, therefore, obtain the impact of pathway taken on outcomes over and above differences in both observable characteristics at age 25 and in ability as proxied by educational achievements while in compulsory education. The coefficients in all models report the impact of taking the respective pathway relative to the base category which is those individuals who follow Pathway 6 (P6): A-Level to HE.
Table 3. Age 25 (Wave 8) labour market outcomes by pathway.
Examining first the baseline specifications in columns (1), (4) and (7), all coefficients on the pathway indicators are negative and statistically significant when examining weekly income and hourly wages. This indicates that the pathway P6: A-Levels to HE is associated with a significantly higher overall weekly income and higher hourly wage than the other pathways.Footnote20 Even for those who follow P5: Vocational Level 3 into HE – which attains the same RQF level as P6 – there is a negative differential in weekly income (hourly wages) of 9% (14%). Unsurprisingly, those who experience P2: NEET-dominated pathway face the largest penalty, of around 26% in weekly income and 29% in hourly wages relative to P6: A-Levels to HE. Notably, those whose pathway is predominantly below Level 3 in the first few post-compulsory years do not earn hourly wages significantly different from the NEET group at age 25, though their overall weekly income is significantly higher.
In this baseline specification, there are few differentials in the age 25 employment probability across pathways. The likelihood of being employed at age 25 does not significantly differ between those who followed P6: A-Level to HE, and P1: Employment, P4: Apprenticeship, and P5: Vocational Level 3. However, those who undertook low-level vocational education or were predominantly NEET in their initial years after compulsory schooling are still significantly less likely to be employed at age 25. This differential for P2: NEET-dominated (−19%) is more than double that for P3: Below Level 3 group (−9%). Thus, while the below Level 3 group do have poorer employment prospects on average than those who progress directly into employment/training or higher-level education, there is still some advantage in taking these low-level routes relative to not being in employment or training at all.Footnote21
Adding in basic control variables as in columns (2), (5) and (8) has a small or negligible impact. The negative income differentials widen for those who followed P1: Employment and P4: Apprenticeship while the income differential for P5: Vocational Level 3 to HE narrows slightly. The hourly wage differentials are also largely unchanged, reducing in magnitude slightly for each pathway but not significantly so when compared to the baseline specification. Differentials also narrow in employment probabilities, in particular the conditional probability of being in employment for P2: NEET relative to P6: A-Levels to HE, falls from −19% to −7%, and also falls from −9% to −3% for P3: Below Level 3, and is only significantly different from zero at the 10% significance level. Including controls produces a small positive employment probability differential for those in P1: Employment dominated with a 2% higher likelihood of being in employment relative to P6: A-Levels to HE.
When controlling both for characteristics and prior attainment, in the third specification, the income and wage differences change somewhat. For log weekly income, the negative differentials in column (3) are substantially attenuated for each pathway relative to the base category. The significant difference in log weekly income between P6: A-Level to HE and P5: Vocational Level 3 to HE is negligible and insignificantly different from zero. The negative income differential for P1: Employment falls from −8% to −2%, and for the P3: Below Level 3 falls by 10 percentage points from −14% to −4%. The negative differentials for P2: NEET and P4: Apprenticeship is reduced by approximately 50 percent, from −26% to −13%, and from −15% to −8% respectively, but are still large and statistically significantly different from zero.
Similarly, large decreases in the magnitude of the negative differentials in log hourly wages are observed when including a full set of controls as in column (6). For pathways P5: Vocational Level 3 to HE, P3: Below Level 3, P1: Employment, and P2: NEET, significant decreases are observed with all of the differentials falling in the −5% to −7% range. A particularly noticeable change is that the differential associated with P4: Apprenticeships becomes positive, associated with a 7% higher hourly wage than P6: A-Level to HE. This suggests that the relatively low hourly earnings from the apprenticeship route are due largely to differences in prior ability (as measured by qualifications attained while in compulsory schooling). If an apprentice is compared to a cluster member of P6: A-Level to HE, with the same prior ability, their hourly wages are greater on average. This finding for +7% higher wages for P4: Apprenticeship pathway wages contrasts with the −8% differential in weekly income relative to the P6: A-Level to HE group.
There are two potential explanations for the differences in income and wages for the P4: Apprenticeship pathway. Firstly, while having higher hourly earnings in employment, apprentices may work fewer hours on average. Secondly, the impact of self-employment, which apprentices have a much higher propensity for relative to other groups (double the likelihood of self-employment compared to the next most likely group). Self-employed individuals do not report hourly wage data in LSYPE and so the hourly wage results may be ignoring a substantial group of relatively low-earning self-employed former apprentices. However, Table A3 in the online Appendix suggests that it is unlikely to be due to low-earning self-employed workers, as restricting the income equations to the same estimation sample as that for hourly wages – i.e. estimating for employees only and removing the self-employed – produces almost identical results for income.
When controlling both for personal characteristics and prior attainment, the findings for the differentials in employment rates are relatively little changed from controlling for characteristics only. Once prior ability is taken into account, those who followed the P1: Employment pathway have a 3% higher likelihood of being in employment, while those who experienced the P2: NEET dominated pathway are around 6% less likely to be in employment at age 25 than the P6: A-Levels to HE pathway cluster members.
Overall, these results indicate that even after controlling for a wide range of characteristics and ability (as reflected in prior attainment), the adverse consequences of the NEET-dominated pathway are strongly evident in poorer outcomes for employment and, relatedly, weekly income at age 25. However, those who follow this pathway but manage to secure employment at age 25 are not particularly negatively impacted in terms of their (conditional) hourly wages relative to others, although the ‘protective factor’ of employment is harder to attain for this group of course: 15% of the P2: NEET pathway group are unemployed at age 25 as compared to an average of 5% across the other pathways. The P4: Apprenticeship pathway has positive wage outcome even compared to those who achieve a higher level of qualification by age 25 via HE, and hence as a pathway from education into employment seems to be particularly advantageous, consistent with the findings of McIntosh and Morris (Citation2018), Cavaglia, McNally, and Ventura (Citation2018), and Speckesser and Xu (Citation2022). Finally, other routes into the labour market have quite similar outcomes in terms of wages, income and employment probability relative to P6: A-level to HE, at least at age 25. Therefore, with the exception of NEET, the heterogeneity in the pathways chosen from education into employment is perhaps of less consequence than might first be apparent.
4.2.1 Oster (Citation2019) bias-corrected estimates of pathway outcomes
One potential caveat to the results discussed above is the potential effect of unobserved heterogeneity impacting on the coefficients reported in .Footnote22 First, it should be noted that in the LSYPE data, we have a very rich set of control variables which should help to limit the potential bias from unobserved confounders. Moreover, we also have good measures of ability as captured by prior attainment which has previously been shown to be a strong determinant of the three labour market outcomes under investigation. None-the-less, the observed correlations between the pathways through post-compulsory education and labour market outcomes at age 25 could be biased as a result of ‘selection on unobservables’ – i.e. factors which impact on the choices of pathways and also on outcomes. We, therefore, employ the methodology of Oster (Citation2019), itself an extension of earlier methods developed by Altonji, Elder, and Taber (Citation2005), in order to investigate the robustness of the results in to this potential bias.
The identification issue is that there may be unobserved characteristics, such as motivation, which determine both labour market outcomes and the education pathway taken and thus bias the estimated coefficients on the pathways. The Oster method can be used to construct estimates of the bias-adjusted coefficients and is based on the notion that the (direction and) magnitude of the bias from unobserved variables is reasonably assumed to be proportionately related to that from the included observed variables (including any proxies for the unobserved variables). While many applied researchers argue this heuristically in their discussion of ‘robustness’ around coefficient stability as additional control variables are added to their regressions, Oster (Citation2019) formalises this argument, and shows that the bias can be related to the change in the coefficient of interest and the associated change in the explanatory power of the regression as control variables are added.
Specifically, Oster (Citation2019) demonstrates that a bias-adjusted ‘treatment’ effect can be approximated asFootnote23:
where
and
are the R-squared and point estimate from the baseline regression without additional controls, and
and
are the corresponding parameters with the full set of controls. δ is the coefficient of proportionality which defines how strong the effect of the unobservables is, relative to the observables. A sensible upper bound for this parameter is
, indicating that the effect of the unobservables is just as large as the impact of the observables.
is the R-squared from the hypothetical model which includes all observable and unobservable determinants of the outcome. Oster (Citation2019) suggests setting
to reflect any variation in the dependent variable resulting from choices made after the independent variables were determined, or measurement error in the dependent variable, which would mean that the theoretical upper bound would not be
.
We have employed these techniques for all three outcomes measures of interest – weekly income, hourly wages, and employment probability. For the latter, given that the Oster method is only applicable to linear regression models, we have re-estimated the logit models for employment using a linear probability model (LPM) specification. These LPM estimates differ little from the marginal effects from the logit specification as presented in . We condition our robustness analysis on prior achievement scores at KS2 and KS3 which are capturing innate ability determined before pathway selection (‘additional controls’ in Oster Citation2019). Finally, standard errors for can be obtained by bootstrapping, and we report those obtained from 1000 replications in each case.
The results from employing the Oster method are reported in for the three outcomes of interest. We consider two variants; first which corresponds to the unobservables being half as important as the observables and, second
such that the unobservables and observables are assumed to have equal impact on the pathway selection.
Table 4. Bias-adjusted coefficients based on Oster (Citation2019).
For weekly income, the estimated negative income differentials associated with the other pathways relative to the omitted pathway P6: A-level to HE are numerically greater when we allow for the potential impact of unobservable confounders, particularly for the pathway which is dominated by employment (P1). If greater variance is permitted due to unobservables (column (3) vs column (2)), the negative differentials relative to P6 are estimated to be even larger. These results suggest that, at least for weekly income, the advantage accruing to those who transition through A-levels to HE may be even greater than indicated in .
For hourly wages, the potential impact of unobservables seems to be fairly small. Relative to the OLS results in column (4), those in column (5) (with ) are similar in magnitude and statistical significance, but with some slight attenuation towards zero (with the exception of P5). When we allow for larger unobservable effects, as in column (6), a similar pattern is observed as in column (5), but with some loss of significance particularly for P1 and P4 which are no longer statistically significantly different from the baseline P6.
Finally, for employment, both the magnitude and the statistical significance for the differential between pathways P1 and P2, and P6 are little changed when we allow for the potential bias from unobservable variables as in columns (8) and (9). They remain positive for those who selected pathway P1: Employment, and negative for those on pathway P2: NEET.
We conclude that, while there may potentially be some differences in the estimated pathway coefficients due to unobservables, these are not likely to be sufficient to overturn the tenor of the results reported in .
4.3 Analysis of pathway determinants
We now turn to investigate the individual, family and household characteristics, behaviours and attitudes at ages 14–16, which predict the pathway that individuals choose from age 16. In particular, we explore the characteristics that are most strongly associated with poor labour market outcomes. There is a substantial base of evidence which examines the determinants of educational attainment such as socio-economic status and childhood circumstances (Goodman and Gregg Citation2010; Stopforth, Gayle, and Boeren Citation2021). This literature generally finds that children from less advantaged backgrounds achieve lower levels of education, and this is a concern to policymakers as educational attainment allows or disallows progression through some pathways. For example, GCSE achievement determines the ability to participate in different types of education and the opportunity to engage with other forms of training which has implications for labour market options and thereby social mobility (Machin, McNally, and Ruiz-Valenzuela Citation2020). Educational attainment is therefore likely to influence the pathway taken into the labour market, although individual characteristics are also likely to also influence the decisions that an individual makes and the pathways that they take, with some, in turn, leading to poor outcomes such as NEET. It is important for policymakers to understand which pathways are most likely to lead to poor outcomes but also who is more likely to take these pathways and the characteristics that put individuals at risk. Policies to intervene and divert at-risk individuals away from poor labour market outcomes may limit both the associated individual and economic repercussions.
4.3.1 Characteristics influencing pathway choice
presents the results of the multinomial logit model, showing the marginal effects of key variables on the probability that an individual is observed in the respective pathway cluster. Dummy variables indicating missing values are omitted from the table, as are control variables which are found to have insignificant or marginally significant associations with the probability of an individual following any of the six pathways. These variables include region, occupation of parent, household tenure type, family structure, availability of computer or internet at home, whether the young person experienced troublemaking in class, and the indicator variable for whether or not the young person was taking vocational qualifications at age 15/16.
Table 5. Characteristics influencing pathway choice: Multinomial logit marginal effect estimates.
The results for the remaining variables presented in reveal that gender and ethnicity are influential in predicting post-16 education and employment pathways. Males are 2–3 percentage points more likely to undertake P4: Apprenticeships or P5: Vocational Level 3 qualifications into HE than females, ceteris paribus. Individuals from a non-white background are 10 percentage points more likely to follow P6: A-Level into HE, and 4 percentage points significantly more likely to follow P5: Vocational Level 3 into HE pathways than equivalent white students. Correspondingly, non-whites are significantly less likely to take an apprenticeship, proceed into employment, or to become NEET. There is also evidence that family background does play some role predicting later education trajectories. Though small in magnitude, individuals from more deprived backgrounds – represented by the index of multiple deprivation, IMD – are less likely to follow the A-Levels and HE route, while being more likely to end up NEET after leaving school.
Behaviours and attitudes play a significant role. Those who identify themselves as likely to apply to university in future, at age 14, are significantly more likely to do so, specifically through the A-Level route. However, they are not any more likely to follow a vocational route to HE than those who are not likely to apply to university. Also, being associated with a larger number of risk factors make it more likely a young person will follow the employment or NEET trajectories and 2.5 percentage points less likely to take the P6: A-Levels to HE pathway.
Parental engagement and attitudes are also important. Amongst the dummy variables indicating advice given to continue with full-time education (FTE) at age 16, it is when this advice is given by parents that it has a significant association with the pathway taken. Only parents’ and teachers’ advice to continue in full-time education are significantly correlated with the likelihood of following P6: A-Levels to HE, while siblings, other family, and friends do not have a significant impact on the probability of taking this pathway. Parental advice to continue in FTE also significantly increases the probability of following a vocational education route and decreases the likelihood of the apprenticeship, employment or NEET pathways. Careers advisors are not significantly correlated with the probability of any of the pathways. A lack of engagement of parents in parents’ evenings, as a proxy for general parental engagement, is significantly correlated with the probability of becoming NEET. Parents’ aspirations are also important. When the parents would like the young person to undertake an apprenticeship rather than continue in full-time education, the young person is 2.9 percentage points more likely to take an apprenticeship, 6.8 percentage points more likely to follow the employment route, and correspondingly 10 percentage points less likely to take A-Levels and progress to HE.
As expected, an individual’s GCSE performance is an important determinant of the pathway taken. Both GCSE English and GCSE Maths in isolation increase the probability of taking A-Levels and progressing to HE, being associated with a 6.3 percentage point and 4.5 percentage point higher probabilities, respectively, of taking this route. These findings echo those presented by Machin, McNally, and Ruiz-Valenzuela (Citation2020). As identified by Department for Education (Citation2018), GCSE attainment is influential in becoming NEET; in particular, GCSE maths and the overall KS4 score are significant determinants of following the NEET dominated pathway.
reports the results of a cross-validation exercise which attempts to introduce some external validity to the assessment of the predictive accuracy of the model. The procedure is to randomly allocate 75% of the estimation sample (stratified by cluster) to a ‘training’ dataset and use the remaining 25% of the sample as a ‘testing’ dataset. The multinomial logit is estimated using the training data, while the testing data is used to assess the out-of-sample predictive accuracy of the model.Footnote24 The process is repeated 500 times. The predictive accuracy of a model with no explanatory variables is maximised when all individuals are allocated to the modal category (in this case P6). This gives a benchmark against which the predictive accuracy of the models with covariates can be compared.
Table 6. Assessment of prediction accuracy.
When no model is specified, 46.41% of the sample sequences are correctly predicted – the percentage of the sample made up of those in the largest cluster. Including all covariates leads to a significant 10 percentage point increase in prediction accuracy. GCSE outcomes are the most important contributing factor to this overall increase; when only test scores are included in the model, the prediction accuracy rate is 53.54% compared to 56.35% when all covariates are included. This compares to a prediction accuracy rate of 58.3% when the full sample is used for both estimation and prediction.
Taken together, these findings highlight the importance of parental advice, guidance and support in the selection of the pathways that young people take from education into work. Individual characteristics, aspirations and educational performance are significantly more important than school or area characteristics in determining pathways. And while educational attainment is undoubtedly a factor in limiting some of the choices available at the end of compulsory education, there is considerable heterogeneity remaining indicating that young peoples’ futures are not simply determined by their outcomes in the ‘high stakes’ GCSE exams that take place at age 16.
5. Discussion and conclusions
There are a myriad of different pathways that individuals take through the education system into the labour market (Hupkau et al. Citation2016). In recent years, the UK has experienced growth in the variation of pathways that can lead individuals into Higher Education (HE) and simultaneously, an expansion in the uptake of vocational study and apprenticeships. In this paper we employ sequence analysis techniques to address three core research aims centred around the variation in these pathways: We firstly identify the principal pathways taken through compulsory, further, and higher education into the labour market by young people in England. Secondly, we examine the earnings and employment differentials associated with the different pathways and distinguish the pathways that lead to poorer labour market outcomes. Finally, we predict which pathways individuals follow after the end of compulsory schooling based on their characteristics while still at school.
Our data enables us to trace the activities of a cohort of young people in England who completed their compulsory education at age 16 in 2006. The analysis reveals that there is considerable heterogeneity in the pathways that these young people select after the end of their compulsory education. However, these can be usefully grouped into a small range of six distinctive pathways each characterised by a modal activity reflecting the dominance of time spent in a particular education or labour market state. Parental advice and support, as well as individual and parental attitudes and aspirations are found to significantly influence the pathway followed. As expected, GCSE performance is also an important pathway determinant; GCSE Maths significantly reduces the likelihood of becoming NEET for example. However, provision of advice and guidance beyond teachers and parents seems to impact little. The consequences of following different pathways from education into work are also investigated. The adverse consequences of the NEET-dominated pathway are strongly evident in poorer outcomes at age 25. In contrast, the Apprenticeship pathway has positive wage outcomes even compared with those who achieve a higher level of qualification by age 25 via HE. However, the impact on hourly wages, weekly income and the probability of employment of selecting other routes into the labour market seems relatively unimportant, at least at age 25, with statistically significant, but relatively small differences in outcomes relative to those who take the traditional academic route through A-levels into HE. Successful transitions from education into employment are certainly not limited to just those that take this traditional academic pathway.
The results also suggest some interesting implications for policy. There are significant differences by gender and, particularly, ethnicity, suggesting that targeted interventions might improve the outcomes particularly for some groups. It is also clearly important to engender high aspirations and expectations of both the young people themselves and of their parents, not least because other forms of advice and guidance, including schools’ careers services, are unimportant and/or ineffective in helping young people navigate the pathways that are available to them. Achieving a set of good results at KS4 (GCSE) is a protective factor for NEET, and hence the current policy in England of students retaking their GSCE Maths and English if they have not achieved a pass grade in these subjects seems warranted. However, the results also clearly indicate that the measure of ‘success’ in education should not be limited to outcomes which enable the A-level to HE pathway (thereby indirectly consigning the ‘other 50%’ of the cohort to being labelled as failing). Promoting the other pathways with ‘good’ outcomes such as Apprenticeships and encouraging and supporting young people to embark on these other pathways would serve to enhance the outcomes achieved.
Finally, we find that young people have the potential to change trajectory after one, two, or even three years after leaving compulsory education. That is, their pathways are not strongly pre-determined at age 16 – there is still considerable variation post-16. This makes it difficult to develop a small but homogenous typology of pathways which can then be predicted by a model specified as a function of characteristics observable before the individuals embark on these pathways. While this finding presents challenges in providing strong policy conclusions as to how prior characteristics may be used in order to identify individuals who are more likely to make pathway choices which may lead to less favourable labour market outcomes, this can also be considered an encouraging finding in the sense that individuals can still make choices during their first few years out of school that will influence their overall career trajectories in their early 20s.
Supplemental Material
Download PDF (908.9 KB)Acknowledgements
The authors would like to thank participants at the 2019 CVER Conference for helpful suggestions, and a referee and editor of this journal for their useful comments on a previous version of the paper.
Disclosure statement
No potential conflict of interest was reported by the author(s).
Notes
1 The RQF (Regulated Qualifications Framework) system for England and Northern Ireland enables individuals to compare different qualifications according to their level (knowledge and skills), from Entry Level 1 through to Level 8. For example, GCSEs are RQF Level 2 and UG (bachelors) degrees are RQF Level 6. The RQF replaced the National Qualifications Framework (NQF) and the Qualifications and Credit Framework (QCF) in 2015 (Ofqual Citation2019).
2 There is heterogeneity in the value of qualifications, most commonly by gender, ability, and the type of qualification such as degree classification, subject and the awarding institution (Sienessi Citation2003: Belfield et al. Citation2018). This is similarly the case in vocational education (McIntosh Citation2006; McIntosh and Morris Citation2021).
3 A body of literature attempts to identify which measures of disadvantage are the most valuable in identifying social disadvantage with reference to the widening participation agenda; see for example: Henderson, Shure, and Adamecz-Völgy (Citation2019), Ilie, Sutherland, and Vignoles (Citation2017) and Hobbs and Vignoles (Citation2010).
4 In December 2020, 11.6% of 16- to 24-year-olds were classified as NEET in the UK (ONS Citation2021).
5 If there are m elements in the sequence, and each element can be any one of n states, then the number of possible sequences is mn.
6 This is linked data comprising of the National Pupil Database (NPD) and Individualised Learner Records (ILR) matched to HMRC tax records
7 Unlike this paper, they only have Next Steps Waves 1–5 and therefore are only able to consider event histories up to age 19, whereas we construct histories up to (and observe outcomes at) age 25. This is an important distinction, since we are then able to identify different trajectories into the labour market, particularly of the individuals who go to university between age 18-21.
8 Other studies which have exploited sequence analysis to study the pathways from education into work include: Cebulla and Whetton (Citation2018) (Australia); Boylan (Citation2020) (US); Middeldorp, Edzes, and van Dijk (Citation2019) (Netherlands); Quintini and Manfredi (Citation2009) (EU); and Achatz, Jahn, and Schels (Citation2022) (Germany).
9 This will complement planned analysis using the Longitudinal Educational Outcomes (LEO) data which will exploit the larger sample sizes to identify more detailed and distinct pathways through different levels and types of vocational qualifications for all learners, building on the previous analysis by De Coulon et al. (Citation2017) which focused on low-level learners only.
10 Access is via the Secure Data Service at the UK Data Archive
11 We also consider sequences of only 12 months in duration after the end of compulsory schooling; the results of this analysis can be found in Table A2 of the Appendix. While the overall prediction accuracy is improved by focusing on the first 12 months, the value added from specifying a model to predict pathways is broadly similar for to the sequence analysis focusing on 45 months.
12 Sequences are converted into other sequences by using substitution and 'indel' (insertions and deletion) operations. Substitutions change a given element from one state to another state; indels remove an existing element and/or add a new one. For a more detailed discussion see the online Appendix.
13 The substitution costs are simply the sum of the two indel costs following Studer and Ritschard (Citation2016). For example, for the ALEV and APPR states, indel costs in Panel A are 0.44 and 0.65. The sum of those is 1.09, which is the substitution cost for ALEV-APPR in Panel B.
14 Although this figure may be inflated due to the attrition issues discussed previously.
15 We define Further Education (FE) as 16–18 post-compulsory education encompassing both sixth form schools/ colleges and Further Education colleges.
16 3814/8234 = 46% of all sequences are allocated to this pathway cluster.
17 The labour market outcomes by cluster are reported in Table A1 in the online Appendix, while the distribution of the log hourly wage by cluster is depicted in Figure A1.
18 Including gender, ethnicity, Government Office Region where the individual lives at age 25, an indicator for receipt of state benefits, and an indicator for if the individual has received any on the job training.
19 These are the standardised point scores at ages 11, 14, and 16, and indicator variables for obtaining a grade C or above in GCSE Maths and GCSE English.
20 While this might be as expected in terms of lifetime earnings, recall that this is for income and wages as measured at age 25, when those who attended university are only 3- or 4-years post-graduation.
21 The coefficients on the pathways together with their standard error bounds are illustrated in the online Appendix Figure A2, A3 and A4 for income, wages and employment respectively for each of the 3 specifications considered.
22 We would like to thank an anonymous referee for this suggestion.
23 This approximation is useful for gauging the degree of bias that can be expected, but Oster (Citation2019) presents the actual consistent bias-corrected estimator in her paper and in her STATA code (-psacalc-), and it is this that is reported below.
24 We provide a further investigation of the misallocated individuals in the Appendix.
References
- Abbott, A. 1995. “Sequence Analysis: New Methods for Old Ideas.” Annual Review of Sociology 21: 93–193. doi:10.1146/annurev.so.21.080195.000521
- Abbott, A., and A. Tsay. 2002. “Sequence Analysis and Optimal Matching Methods in Sociology, Review and Prospect.” Sociological Methods and Research 29 (1): 3–33. doi:10.1177/0049124100029001001
- Achatz, J., K. Jahn, and B. Schels. 2022. “On the Non-standard Routes: Vocational Training Measures in the School-to-Work Transitions of Lower-qualified Youth in Germany.” Journal of Vocational Education & Training 74 (2): 289–310. doi:10.1080/13636820.2020.1760335
- Altonji, J. G., T. E. Elder, and C. R. Taber. 2005. “Selection on Observed and Unobserved Variables: Assessing the Effectiveness of Catholic Schools.” Journal of Political Economy 113: 151–184. doi:10.1086/426036
- Anders, J., and R. Dorsett. 2017. “What Young English People do Once They Reach School-Leaving Age: A Cross-Cohort Comparison for the Last 30 Years.” Longitudinal and Life Course Studies: International Journal 8 (1): 75–103. doi:10.14301/llcs.v8i1.399.
- Belfield, C., J. Britton, F. Buscha, L. Dearden, M. Dickson, L. Van de Erve, L. Sibieta, A. Vignoles, I. Walker, and Y. Zhu. 2018. “The Relative Labour Market Returns to Different Degrees.” Institute for Fiscal Studies Research Report.
- Bell, D., and D. Blanchflower. 2011. “Young People and the Great Recession.” Oxford Review of Economic Policy 27 (2): 241–267. doi:10.1093/oxrep/grr011
- Biemann, T. 2011. “A Transition-Oriented Approach to Optimal Matching.” Sociological Methodology 41 (1): 195–221. doi:10.1111/j.1467-9531.2011.01235.x
- Blanden, J., and L. McMillan. 2016. “Educational Inequality, Educational Expansion and Intergenerational Mobility.” Journal of Social Policy 45 (4): 589–614. doi:10.1017/S004727941600026X
- Boylan, R. 2020. “Predicting Postsecondary Pathways: The Effect of Social Background and Academic Factors on Routes Through School.” Socius: Sociological Research for a Dynamic World 6: 1–25. doi:10.1177/2378023119895174
- Britton, J., L. Dearden, N. Shephard, and A. Vignoles. 2016. “How English Domiciled Graduate Earnings Vary with Gender, Institution Attended, Subject and Socio-economic Background.” Institute for Fiscal Studies working paper W16/06.
- Brzinsky-Fay, C. 2007. “Lost in Transition? Labour Market Entry Sequences of School Leavers in Europe.” European Sociological Review 23 (4): 409–422. doi:10.1093/esr/jcm011
- Brzinsky-Fay, C., and H. Solga. 2016. “Compressed, Postponed, or Disadvantaged? School-to-Work-Transition Patterns and Early Occupational Attainment in West Germany.” Research in Social Stratification and Mobility 46 (A): 21–36. doi:10.1016/j.rssm.2016.01.004
- Campbell, R., C. Wright, M. Hickman, R. Kipping, M. Smith, T. Pouliou, and J. Heron. 2020. “Multiple Risk Behaviour in Adolescence is Associated with Substantial Adverse Health and Social Outcomes in Early Adulthood: Findings from a Prospective Birth Cohort Study.” Preventive Medicine 138 (106157). doi:10.1016/j.ypmed.2020.106157.
- Cavaglia, C., S. McNally, and G. Ventura. 2018. “Do Apprenticeships Pay? Evidence for England.” Centre for Vocational Education Research Discussion Paper 014.
- Cebulla, A., and S. Whetton. 2018. “All Roads Leading to Rome? The Medium Term Outcomes of Australian Youth’s Transition Pathways from Education.” Journal of Youth Studies 21 (3): 304–323. doi:10.1080/13676261.2017.1373754
- Collier, W., J. Valbuena, and Y. Zhu. 2018. “What Determines Post-compulsory Academic Studies? Evidence from the Longitudinal Survey of Young People in England”.” Applied Economics Letters 25 (9): 607–610. doi:10.1080/13504851.2017.1352069
- D’Arcy, C., and D. Finch. 2016. “Finding your Routes: Nongraduate Pathways in the UK’s Labour Market.” Social Mobility and Child Poverty Commission.
- De Coulon, A., S. Hedges, V. Nafilyan, and S. Speckesser. 2017. “Young People in Low Level Vocational Education: Characteristics, Trajectories and Labour Market Outcomes.” Centre for Vocational Education Research Discussion Paper 004.
- Department for Education. 2018. “Characteristics of Young People who are Long-term NEET.” London. https://assets.publishing.service.gov.uk/government/uploads/system/uploads/attachment_data/file/679535/Characteristics_of_young_people_who_are_long_term_NEET.pdf
- Dickerson, A., T. Maragkou, and S. McIntosh. 2018. “The Causal Effect of Secondary School Peers on Educational Aspirations.” Centre for Vocational Education Research Discussion Paper 017.
- Dorsett, R., and P. Lucchino. 2014. “Explaining Patterns in the School-to-Work Transition: An Analysis Using Optimal Matching”.” Advances in Life Course Research 22: 1–14. doi:10.1016/j.alcr.2014.07.002
- Farina, E., C. Green, and D. McVicar. 2020. “Zero Hours Contracts and Their Growth”.” British Journal of Industrial Relations 58 (3): 507–531. doi:10.1111/bjir.12512
- Feinstein, L., and J. Symons. 1999. “Attainment in Secondary School.” Oxford Economic Papers 51 (2): 300–321. doi:10.1093/oep/51.2.300
- Gayle, V., S. Murray, and R. Connelly. 2016. “Young People and School General Certificate of Secondary Education Attainment: Looking for the ‘Missing Middle.” British Journal of Sociology of Education 37 (3): 350–370. doi:10.1080/01425692.2014.935292
- Goodman, A., and P. Gregg. 2010. “Poorer Children’s Educational Attainment: How Important are Attitudes and Behaviour?” Joseph Rowntree Foundation. file:///C:/Users/cm1emm/Downloads/poorer-children-education-full.pdf
- Gorard, S., V. Boliver, N. Siddiqui, and P. Banderjee. 2017. “Which are the Most Suitable Contextual Indicators for Use in Widening Participation to HE?” Research Papers in Education 34 (1): 99–129. doi:10.1080/02671522.2017.1402083
- Gregg, P., and E. Tominey. 2005. “The Wage Scar from Male Youth Unemployment.” Labour Economics 12 (4): 487–509. doi:10.1016/j.labeco.2005.05.004
- Henderson, M., N. Shure, and A. Adamecz-Völgy. 2019. “‘First in Family’ University Graduates in England.” IZA Discussion Paper 12588.
- Hobbs, G., and A. Vignoles. 2010. “Is Children’s Free School Meal ‘Eligibility’ a Good Proxy for Family Income?” British Educational Research Journal 36 (4): 673–690. doi:10.1080/01411920903083111
- Hollister, M. 2009. “Is Optimal Matching Sub-optimal?” Sociological Methods & Research 38 (2): 235–264. doi:10.1177/0049124109346164
- Hupkau, C., S. McNally, J. Ruiz-Valenzuela, and G. Ventura. 2016. “Post-compulsory Education in England: Choices and Implications.” Centre for Vocational Education Research Discussion Paper 001.
- Ilie, S., A. Sutherland, and A. Vignoles. 2017. “Revisiting Free School Meal Eligibility as a Proxy for Pupil Socio-Economic Deprivation.” British Educational Research Journal 43 (2): 253–274. doi:10.1002/berj.3260
- Keep. 2012. “Youth Transitions, The Labour Market and Entry into Employment: Some Reflections and Questions.” ESRC Centre on Skills, Knowledge and Organisational Performance (SKOPE), Research Paper 108.
- Machin, S., and A. Manning. 1999. “The Causes and Consequences of Long-term Unemployment in Europe.” In Handbook of Labor Economics, vol. 3, Part C, 3085–3139, edited by O. Ashenfelter and D. Card. Amsterdam: Elsevier.
- Machin, S., S. McNally, and J. Ruiz-Valenzuela. 2020. “Entry Through the Narrow Door: The Costs of Just Failing High Stakes Exams.” Journal of Public Economics 190 (C), Article 104224.
- MacIndoe, H., and A. Abbot. 2004. “Sequence Analysis and Optimal Matching Techniques for Social Science Data.” In Handbook of Data Analysis, edited by M. Hardy and A. Bryman, 387–406. London: SAGE Publications Ltd.
- Markussen, E. 2017. “Education Pays Off! On Transition to Work for 25-year-olds in Norway with Upper Secondary Education or Lower as their Highest Educational Level.” Educational Research for Policy and Practice 16 (1): 27–42. doi:10.1007/s10671-016-9201-z
- McDool, E., and D. Morris. 2020. “Gender and Socio-Economic Differences in STEM Uptake and Attainment.” Centre for Vocational Education Research Discussion Paper 029.
- McIntosh, S. 2006. “Further Analysis of the Returns to Academic and Vocational Qualifications.” Oxford Bulletin of Economics and Statistics 68 (2): 225–251. doi:10.1111/j.1468-0084.2006.00160.x
- McIntosh, S., and D. Morris. 2018. “Labour Market Outcomes of Older Versus Younger Apprentices: A Comparison of Earnings Differentials.” Centre for Vocational Education Research Discussion Paper 016.
- McIntosh, S., and D. Morris. 2021. “Variation in the Labour Market Rewards to Vocational Qualifications in the UK.” Scottish Journal of Political Economy 68 (5): 535–552. doi:10.1111/sjpe.12299
- McVicar, D., and M. Anyadike-Danes. 2002. “Predicting Successful and Unsuccessful Transitions from School to Work by Using Sequence Methods.” Journal of the Royal Statistical Society A 165 (2): 317–334. doi:10.1111/1467-985X.00641
- Metcalf, H. 2009. “Pay Gaps Across the Equality Strands: A review.” Equality and Human Rights Commission Research Report 14. https://www.equalityhumanrights.com/sites/default/files/research-report-14-pay-gaps-across-equality-strands.pdf
- Middeldorp, M., A. Edzes, and J. van Dijk. 2019. “Smoothness of the School-to-Work Transition: General Versus Vocational Upper-Secondary Education.” European Sociological Review 35 (1): 81–97. doi:10.1093/esr/jcy043
- OECD. 2000. From Initial Education to Working Life: Making Transitions Work. Paris: OECD.
- OECD. 2010. Pathways to Success: How knowledge and skills at age 15 shape future lives in Canada. OECD/PISA.
- Office for National Statistics (ONS). 2021. Young people not in education, employment or training (NEET), UK: March 2021. https://www.ons.gov.uk/employmentandlabourmarket/peoplenotinwork/unemployment/bulletins/youngpeoplenotineducationemploymentortrainingneet/march2021
- Office of Qualifications and Examinations Regulation (Ofqual). 2019. “Referencing the Qualifications Frameworks of England and Northern Ireland to the European Qualifications Framework.” https://assets.publishing.service.gov.uk/government/uploads/system/uploads/attachment_data/file/840837/Referencing_the_Qualifications_Frameworks_of_England_and_Northern_Ireland_to_the_European_Qualifications_Framework.pdf
- Opheim, V. 2007. “Equal Opportunities? The Effect of Social Background on Transition from Education to Work among Graduates in Norway.” Journal of Education and Work 20 (3): 255–282. doi:10.1080/13639080701464533
- Oster, E. 2019. “Unobservable Selection and Coefficient Stability: Theory and Evidence.” Journal of Business Economics and Statistics 37 (2): 187–204. doi:10.1080/07350015.2016.1227711
- Powell, A. 2018. “NEET: Young People Not in Education, Employment or Training.” House of Commons Briefing Paper SN 06705.
- Public Health England. 2014. “Reducing the Number of Young People not in Employment, Education or Training (NEET).” https://assets.publishing.service.gov.uk/government/uploads/system/uploads/attachment_data/file/356062/Review3_NEETs_health_inequalities.pdf
- Quintini, G., and T. Manfredi. 2009. “Going Separate Ways? School-to-Work Transitions in the United States and Europe” OECD Social, Employment and Migration Working Papers No. 90. Paris: OECD.
- Quintini, G., J. Martin, and S. Martin. 2007. The Changing Nature of the School-to-Work Transition Process in OECD Countries, IZA Discussion Papers No 2582, Institute of Labor Economics (IZA), https://EconPapers.repec.org/RePEc:iza:izadps:dp2582
- Raffe, D. 2008. “The Concept of Transition Systems.” Journal of Education and Work 21 (4): 277–296. doi:10.1080/13639080802360952
- Robinson, D. 2019. “Further Education Pathways: Securing a Successful and Healthy Life after Graduation.” Education Policy Institute. https://epi.org.uk/publications-and-research/further-education-pathways/
- Scherer, S. 2001. “Early Career Patterns: A Comparison of Great Britain and West Germany.” European Sociological Review 17 (2): 119–144. doi:10.1093/esr/17.2.119
- Sienessi, B. 2003. “Returns to Education: A Non-Technical Summary of CEE Work and Policy Discussion.” Institute for Fiscal Studies and Centre for the Economics of Education.
- Speckesser, S., and L. Xu. 2022. “Return to Apprenticeships: A Comparison Between Existing Apprentices and Newly Recruited Apprentices.” Oxford Economic Papers 74 (1): 14–39. doi:10.1093/oep/gpab003.
- Standing, G. 2011. The Precariat: The new dangerous class. London: Bloomsbury Academic.
- Stopforth, S., V. Gayle, and E. Boeren. 2021. “Parental Social Class and School GCSE Outcomes: Two Decades of Evidence from UK Household Panel Surveys.” Contemporary Social Science 16 (3): 309–324. doi:10.1080/21582041.2020.1792967
- Stovel, K. 2001. “Local Sequential Patterns: The Structure of Lynching in the Deep South, 1882-1930.” Social Forces 79: 843–880. doi:10.1353/sof.2001.0026
- Studer, M., and G. Ritschard. 2016. “What Matters in Differences Between Life Trajectories?: A Comparative Review of Sequence Dissimilarity Measures.” Journal of the Royal Statistical Society A 179 (2): 481–511. doi:10.1111/rssa.12125
- Vignoles, A., and E. Meschi. 2010. “The Determinants of Non-Cognitive and Cognitive Schooling Outcomes.” Centre for the Economics of Education Special Report 004.
- Walker, I., and Y. Zhu. 2013. “The Impact of University Degrees on the Lifecycle of Earnings: Some Further Analysis.” Department for Business Innovation and Skills Research Paper 112.
- Walker, I., and Y. Zhu. 2018. “University Selectivity and the Relative Returns to Higher Education: Evidence from the UK.” Labour Economics 53, 230–249. doi:10.1016/j.labeco.2018.05.005
Data citation
- University College London, UCL Institute of Education, Centre for Longitudinal Studies. (2018) Next Steps: Sweeps 1–8, 2004–2016: Secure Access. 4th Edition. UK Data Service. SN:7104, http://doi.org/10.5255/UKDA-SN-7104-4