
 ?Mathematical formulae have been encoded as MathML and are displayed in this HTML version using MathJax in order to improve their display. Uncheck the box to turn MathJax off. This feature requires Javascript. Click on a formula to zoom.
ABSTRACT
While it has been shown that university attendance is strongly predicted by parental education, we know very little about why some potential first-generation students make it to university and others do not. This paper looks at the role of non-cognitive skills in the university participation of this disadvantaged group in England. We find that having higher levels of locus of control, academic self-concept, work ethic, and self-esteem in adolescence is positively related to intergenerational educational mobility to university. Our results indicate these skills help potential first-generation students to compensate for their relative disadvantage, and they are especially crucial for boys.
1. Introduction
Higher education (HE) brings substantial benefits to its graduates and society. Individuals who earn a university degree earn more over their careers, are less likely to become unemployed, and even live longer than their peers who do not earn a university degree (Oreopoulos and Petronijevic Citation2013). Obtaining a university degree has therefore also been identified as a key driver of social mobility (Blanden, Gregg, and Macmillan Citation2007; Chetty et al. Citation2014). University participation, however, is associated with socioeconomic status (SES), whereby those from more advantaged backgrounds are more likely to attend university (Blanden and Machin Citation2004; Britton et al. Citation2016; Walker and Zhu Citation2018). This means that the aforementioned benefits to attending university may concentrate amongst the already advantaged in society, thereby limiting social mobility and exacerbating existing inequality.
In this paper, we look at a specific group of disadvantaged youth: those whose parents did not go to university, namely, potential first-generation students. This is the group that has the most to gain from attending university, however, empirical evidence shows that potential first-generation students are between 5.4 and 11.4% less likely to earn a Bachelor’s degree than those with two college-educated parents (Toutkoushian, May-Trifiletti, and Clayton Citation2019). Comparing different sources of disadvantage, Adamecz-Völgyi, Henderson, and Shure (Citation2020) show that parental education, specifically parents who do not have a university degree, is the most important social-background-related barrier to university participation. While it is documented that first-generation students have different experiences at university than children of graduate parents (Ishitani Citation2006; Pascarella et al. Citation2004; Pike and Kuh Citation2005; Thompson Citation2021), there is less evidence regarding why some students beat the odds and attend university, but others do not. We know that early educational attainment (test scores and grades) matters (Gorard, Siddiqui, and Boliver Citation2017; Adamecz-Völgyi, Henderson, and Shure Citation2020), and young people from disadvantaged backgrounds, including potential first-generation individuals, have lower average secondary school performance than their peers whose parents are university graduates (Henderson, Shure, and Adamecz-Völgyi Citation2020; Woessmann Citation2004). However, educational attainment explains only a limited share of the variation in the probability of going to university, whilst a growing literature proves the importance of non-cognitive skills in education and life outcomes (Kautz et al. Citation2014).
Non-cognitive skills may encompass personality characteristics, motivation, attitudes, efforts, emotions, etc. (Almlund et al. Citation2011), and many of these characteristics are associated with educational progression. For example, Heckman, Stixrud, and Urzua (Citation2006) find that high inner locus of control, when one believes that they themselves are responsible for their life outcomes as opposed to luck or faith, and self-esteem just as strongly influence schooling decisions as cognitive skills. Jacob (Citation2002) shows that other non-cognitive factors, such as those akin to work ethic, influence college enrolment even after controlling for educational attainment in high school. Similarly, Prada and Urzúa (Citation2017) show that locus of control, self-esteem, and a measure of adolescent reckless behaviour increase the probability of four-year college attendance, over and above cognitive abilities. Moreover, academic self-concept, the belief in one’s own academic ability, has been shown to be associated with an increase in educational attainment (e.g. Hansen and Henderson Citation2019; Valentine, DuBois, and Cooper Citation2004; Chowdry, Crawford, and Goodman Citation2011). Looking at a cohort of university entrants at an Australian university, Edwards et al. (Citation2022) find that non-cognitive skills, in particular, conscientiousness, one of the Big Five personality traits, help first-generation students to compensate for the academic penalties produced by social origin. Taken together, this literature shows that non-cognitive skills have predictive power in explaining education and life outcomes, but there remains a gap about how they are related to the probability of university participation among potential first-generation individuals.
We make four contributions to the literature. Our first contribution is investigating the role of non-cognitive skills in the probability of HE participation among potential first-generation individuals. We exploit a cohort study from England, Next Steps, which has been linked to administrative data on test scores from national high-stakes school examinations. We investigate four non-cognitive skills, measured between ages 13 and 17: locus of control, academic self-concept, work ethic, and self-esteem. We employ regression and decomposition techniques to test whether these skills are related to the probability of university participation conditional on rich data on family background and educational achievements.
Second, we quantify the gap in non-cognitive skills across four groups of young people: (1) those who follow their parents in terms of not earning a HE degree; (2) the downwardly mobile group: young people who do not go to university despite their parents being graduates; (3) the upwardly mobile group: first-generation students; (4) those who go to university and whose parents are graduates (see Section 3.1 for more information on these four groups).
Our third contribution is to quantify the relative roles of non-cognitive skills and early educational attainment in the first-generation gap in university participation. To do this, we decompose the gap in the probability of university participation between potential first-generation students and children of graduate parents using the Kitagawa-Blinder-Oaxaca decomposition. The final contribution of the paper is to investigate a potential channel of the effects of childhood non-cognitive skills on university participation: test scores taken at the end of compulsory schooling, at age 16, by adding these scores to the decomposition model.
We find that potential first-generation students with lower external locus of control, and higher academic self-concept, work ethic and self-esteem in adolescence are more likely to go to university, even after controlling for national exam scores at age 11 (i.e. measured at a younger age than non-cognitive skills were measured), and rich measures of individual characteristics and family background. Interestingly, we also find that after controlling for early educational attainment and family background, first-generation university participants possess the highest levels of adolescent non-cognitive skills in terms of locus of control, academic self-concept, and work ethic, even compared to university students whose parents are graduates. With respect to the relative roles of non-cognitive skills and early educational attainment in explaining the HE participation gap, we find that the contribution of academic self-concept to the difference in participation rates is substantially larger among boys than among girls. In terms of the potential channels of effects of childhood non-cognitive skills on university participation, we find that once the decomposition is extended to include age 16 test scores, they explain the largest share of the university participation gap. As age 16 test scores might already be the consequence of adolescent non-cognitive skills, we decompose the age 16 test score gap between potential first-generation students and children of graduate parents. We find that on average, adolescent academic self-concept explains more than two times as large a share of the gap as age 11 test scores among boys, while among girls, the contributions are similar in magnitude.
The rest of the paper proceeds as follows. Section 2 describes the data and presents some descriptive statistics on our sample and Section 3 explains our empirical methods. Section 4 presents our results while Section 5 provides a discussion and conclusion.
2. Data and descriptive statistics
We use the Next Steps study (previously known as the Longitudinal Study of Young People in England, LSYPE), which follows a cohort of young people who attended Grade 9 in 2004. They were born in 1989/1990 in England. Next Steps began in 2004 when the sample members were aged between 13 and 15, with the most recent sweep of data collection at ages 25–27 (University College London, UCL Institute of Education, Centre for Longitudinal Studies Citation2018).Footnote1 The data are linked with the National Pupil Database (NPD), which provides a census of pupils attending schools in England, allowing us to access their national school exam results.
Respondents of the Next Steps study were selected to be representative of young people in England using a stratified random sample of state and independent schools, with disproportionate sampling for deprived schools, i.e. those in the top quintile of schools in terms of the share of pupils eligible for Free School Meals (FSM) (Department for Education Citation2011). Design weights were constructed to take care of the oversampling of deprived schools using inverse probability weighting (Department for Education Citation2011). Some schools that were chosen to be in the sample decided not to participate. The first wave thus started with a 21,000-observation issued sample in 28 independent and 646 maintained schools with an average response rate of 74%, resulting in a 15,770-observation initial sample. Starting from Wave 1, attrition weights are estimated by stratum to take care of the initial school-level non-compliance as well as individual attrition from the study. All results that we present in this paper are estimated using the final weights available in the data.
Schools are the primary sampling units of Next Steps, then pupils within schools. The two-stage sampling design presents a possible clustering effect due to school-specific unobserved random shocks; therefore, we apply robust standard errors clustered by schools in all models (Abadie et al. Citation2017). In the first four waves both young people and their parents were interviewed, and the information content of all variables on family background and parental education that we use in this paper was reported directly by the parents. From Wave 5, only young people were interviewed.
In terms of information on HE participation, we make use of the Next Steps age 25 data. The age 25 wave of Next Steps covers 7,707 young people, 36.7% of the initially drawn sample and 49% of the actual sample of the first wave. In Wave 4, an ethnic boost sample (N = 352) was added to the study, selected from the schools that were chosen at the beginning but did not participate in Wave 1 (Centre for Longitudinal Studies Citation2018). As measures of non-cognitive skills are missing for these individuals, we exclude them from the sample (this means 138 individuals out of the 7,707 individuals in Wave 8), along with 33 further individuals for whom information on parental education is missing. The construction of our analytical sample is shown in Figure A1 in Appendix A.
2.1. Non-cognitive skills
We use non-cognitive measures from adolescence, collected in the first four waves of Next Steps, at ages between 13 and 16, to construct four indexes of non-cognitive skills: external locus of control, academic self-concept, work ethic and low self-esteem. Importantly, all these measures are collected before the individuals would have been applying to university and are described in more detail below.
External locus of control captures whether one believes that external circumstances, like luck or faith, are responsible for the outcomes of their life, and not they themselves (Rotter Citation1966). Having high external locus of control has been shown to be negatively associated with numerous educational, behavioural, labour market, and health outcomes (Mendolia and Walker Citation2014). Therefore, we expect higher levels of external locus of control to be negatively related to university participation. Following Schurer (Citation2017) and Mendolia and Walker (Citation2014), we conduct a principal component analysis (PCA) on the answers to six questions on locus of control (listed in Appendix A) from the second waveFootnote2 (). We use the first resulting factor as an index of external locus of control and standardize it to mean 0 and standard deviation 1. This allows us to interpret our results as the change in probability in going to university for a one standard deviation increase in locus of control. As the Cronbach’s alpha is below 0.6 (0.44), we provide a robustness check using Confirmatory Factor Analysis (CFA) as detailed at the end of this section.
Table 1. Next steps data used to construct non-cognitive skill measures.
Academic self-concept is a student’s general perception of their ability in schoolFootnote3 (Gutman and Schoon Citation2016). Empirical evidence shows that self-concept of ability is malleable in school; interventions targeting the development of academic self-concept are effective on average (O’Mara et al. Citation2006). We expect higher values of academic self-concept to be positively related to university participation since a positive perception of ability in school should mean that individuals want to continue their education. We use questions on how individuals perceive their school achievement (Appendix A) to construct a standardized measure of academic self-concept using a PCA (Cronbach’s alpha: 0.68). Out of the six questions, five (Q2-Q6 in Appendix A) come exclusively from the age 13 wave (Wave 1); while in the case of one question (Q1 in Appendix A), 95.5% of the answers come from the first wave, 3.8% come from the second wave and 0.7% come from the third wave (). Among those who provided an answer for Q1 multiple times, about 2/3 gave the exact same answer all the time (Table A1 in Appendix A, block A). Creating the measure of academic self-concept using answers for Q1 exclusively from Wave 1, 2 or 3 (as opposed to replacing missing values from later waves) results in measures that are highly correlated with our original measure (the correlation coefficient is above 0.93); probably, because only one out of the six questions was asked multiple times.
Work ethic is closely related to conscientiousness, the first of the Big Five personality inventory (Mendez and Zamarro Citation2016), which has been shown to positively influence many educational and other outcomes (Almlund et al. Citation2011; Shure Citation2021). Therefore, we expect higher work ethic to be positively related to university participation since these individuals should have higher motivation and drive for applying to university. We create a standardized index of work ethic using a PCA (Cronbach’s alpha: 0.56) on three questions that capture hard work and the importance of school success (Appendix A). Two questions (Q2 and Q3 in Appendix A) come exclusively from the second wave; while for one question (Q1 in Appendix A), 96%, 3.6%, 0.4% of the answers come from the first, second and third waves, respectively (). Comparing answers to Q1 across the three waves (among those who provided data multiple times) reveals that more than half of individuals chose the same answers, and the correlation between our measure of work ethic and alternative measures using data exclusively from Wave 1, 2 or 3 for Q1 is high (around 0.93, Table A1 in Appendix A, block B).
Self-esteem captures one’s perceptions of their own value (Coopersmith Citation1959). Following Mendolia and Walker (Citation2014), we use two questions from the age 14 and age 16 waves that capture how useful/worthless one perceives themselves. In this case, as we only have two questions, we do not use PCA but define individuals having low self-esteem if they put themselves in the lowest category at least once. We expect low self-esteem to be negatively related to university participation since individuals must have confidence in their value to apply to university. We also provide robustness checks using four alternative measures of low self-esteem: reporting low self-esteem in the age 14 wave; reporting low self-esteem in the age 16 wave; reporting low self-esteem both in the age 14 and 16 waves; and the average of low self-esteem reported in the age 14 and 16 waves.Footnote4
shows the descriptive statistics of the non-cognitive skills, while the correlation matrix of the four indexes is shown in Table A2 in Appendix A. We estimate our main results on the complete case subsample of the data in terms of non-cognitive skills (4755 individuals in the total sample and 3775 individuals in the sample of potential first-generation students). As mentioned above, the construction of our main analytical sample is shown in Figure A1 in Appendix A.
Table 2. Sample descriptive statistics: means and proportions of variables of interest.
Since PCA only produces a score for an individual if they gave an answer to all questions that belong to a measure, the first three non-cognitive skill measures have a high share of missing values. Thus, we provide a robustness check using Confirmatory Factor Analysis (CFA) estimated via Full Information Maximum Likelihood (Structural Equation Modeling Reference Manual Citation2017). This method allows us to predict a score for all individuals who gave an answer to at least one question that belongs to a measure. The correlation between the PCA and CFA version of the measures is well above 0.9 (Table A2 in Appendix A). In Section 4, we provide results with PCA on the complete case sample while we replicate the main results with CFA on the largest possible sample in Appendix B.
2.2. The stability of non-cognitive skills over time
When measuring non-cognitive skills, it is important to consider whether these skills would be stable over time – especially in our timeframe, between ages 13 and 17. In other words, should it matter whether we measure them at age 13, 14, 15, 16, or 17? As detailed above, most questions that we use (12 out of 16) were measured only once, so we cannot compare how stable they are within individuals in Next Steps. The literature suggests that most non-cognitive skills are relatively stable in adulthood; however, we know much less about how they change in adolescence. Elkins, Kassenboehmer, and Schurer (Citation2017), for example, argue that most non-cognitive skills are fairly stable in this period. They follow young people between age 15 and age 24 and find that except for conscientiousness, the other four facets of the Big 5 personality inventory as well as locus of control only change slightly over these ages. In contrast, Hoeschler, Balestra, and Backes-Gellner (Citation2018) find that grit (perseverance) and three out of the five facets of the Big 5 increase between ages 15/16 and 20/21. Our study cannot contribute to the dialogue on the stability of non-cognitive skills in adolescence, and we cannot answer the question what would have happened if we measured these skills in different ages. However, we provide a robustness test to our main results where we explicitly control for the age when these skills were measured (Figure B1 and Table B1 in Appendix B), as well as for an indicator variable capturing whether any of the two questions indicated in were imputed from a later wave (Table B2 in Appendix B).
2.3. Higher education participation
We look at the relationship between adolescent non-cognitive skills and the probability of higher education participation, instead of graduation. The reason for this is that participation is a product of application, acceptance, and attendance, whereas graduation is a measure of all of these factors plus completion of the degree. Whilst both measures are important for different reasons, we are particularly interested in participation as this is a more salient measure of university access.
The data provides information on HE participation in the most recent, age 25 wave. The variable is based on related information gathered from all waves and has no missing values. University participation is defined broadly as ever been to university, independent from the length of university attendance.
In the total sample, the weighted average of university participants is 40 percent (, Total sample), which is very similar to the cumulative ratio of the Higher Education Initial Participation Rate (HEIPR)Footnote5 for this cohort, 40.4 percent, calculated by the Department for Education for English domiciled young people aged 17–25 (Department for Education Citation2017). Among the potential first-generation students, 33 percent, while among the children of graduate parents, 72 percent have ever been to university by age 25 (, Total sample).
2.4. Control variables
In our main empirical models, we control for variables that are expected to affect university participation but are unlikely to be affected by adolescent non-cognitive skills. This includes the following variables:
Demographics and family background: gender, age, number of siblings, fixed effects (FE) for the region of school at age 13, whether the young person is a care leaver, whether the young person had a low birth weight or was born prematurely, ethnicity, mother’s social class, father’s social class, age of mother, age of father, single parent household, an area-level measure of income deprivation (IDACI), disability, whether or not their grandparent(s) attended university, FSM eligibility status, whether they went to private school, and highest qualifications of the mother and the father (only in models where parents are non-graduates). For all missing values for these variables, we include a missing flag.
We are interested in whether non-cognitive skills affect university participation over and above cognitive skills. We do not have a direct measure of cognitive skills, but we observe the results of national exam scores in school. Thus, we control for national exam scores measured at the end of primary school at age 11, Key Stage 2 (KS2) scores, as a proxy for cognitive abilities. Note that this educational attainment measure was measured years before the non-cognitive measures. However, it is still likely that individuals’ inherent non-cognitive skills, that we cannot measure before age 11, already affected age 11 test scores. Thus, age 11 test scores might pick up some of the effects of non-cognitive skills already at the baseline. In some models, we also control for high-stake exam test scores measured at age 16, capped linear GCSE (Key Stage 4) scores.Footnote6 As they are likely to have been affected by adolescent non-cognitive skills, we use these scores as a potential channel on the causal pathway between non-cognitive skills and university participation. Note that we don’t see in the data when these young people took their GCSE exams exactly. It is possible that for some people, we measure some non-cognitive skills after they had taken their GCSE’s. This is a limitation of our study. We use all test scores as categorical variables based on the quintiles of achievement and set a sixth category to capture their missing values.
3. Empirical methods
3.1. Graphical comparison
We start with a visual comparison where we plot the average of non-cognitive skills for each of the four groups mentioned earlier (). We plot the raw as well as the conditional means of non-cognitive skills. We construct the conditional means by estimating linear regression models with one of the standardized indexes of non-cognitive skills at a time as a dependent variable and the control variables listed in Section 2.3. Then, we predict the outcome variables from the models and plot the residuals for each of the four groups.
Table 3. Comparison groups used in this paper.
3.2. Modelling intergenerational educational mobility
We are interested in whether certain non-cognitive skills decrease or increase the probability of educational mobility among potential first-generation individuals. In an ideal world, we would want to compare the educational outcomes of young people in a random experiment in which low vs. high levels of non-cognitive skills have been randomly allocated to the individuals. As we cannot exploit such a random experiment, we face a selection problem. Those with low vs. high levels of non-cognitive skills might genuinely differ from each other on many other observed and unobserved domains, and this difference might be related to their educational outcomes. While we cannot fully solve the problem of unobserved selection, we make use of a rich dataset that allows us to control for several observed sources of selection (e.g. family background, educational attainment).
We estimate linear probability models as:
(1)
(1) where
is a binary variable capturing whether individual
ever attended university by age 25;
is one of (or a vector of) the non-cognitive measures of individual
;
is a vector of individual characteristics for individual
;
is an individual-level error term, robust and clustered by sampling schools.
We first estimate models that include one non-cognitive measure at a time (Model 1–4) and the control variables listed in Section 2.3.Footnote7 Then, we re-estimate the model including all four non-cognitive measures in the model at once.Footnote8 Lastly, we test whether non-cognitive skills still matter conditional on age 16 test scores.
Then, following Kalil and Khalid (Citation2010), we re-estimate the main model by age 11 test score quintiles to investigate whether adolescent non-cognitive skills are more or less important to those having lower versus higher early educational attainment. Recall that all non-cognitive measures are measured from age 13 onwards, so after age 11 exams. Since men and women have different non-cognitive skills and associated mechanisms (Almlund et al. Citation2011), we replicate these results separately for boys and girls in Section 4.3.
3.3. Kitagawa-Blinder-Oaxaca decomposition
Next, we decompose the difference in the probability of university attendance between potential first-generation individuals and children of graduate parents using the Kitagawa-Blinder-Oaxaca decomposition (Kitagawa Citation1955; Oaxaca Citation1973; Blinder Citation1973). The method decomposes the difference in an outcome variable across two groups to an explained part that is due to the different distributions of explanatory variables in the two groups (endowments), and to an unexplained part that is not attributable to the distributions of the explanatory variables (rather it captures the returns to those characteristics). We apply common coefficients estimated from a pooled regression (Neumark Citation1988);Footnote9 thus, the estimated coefficient of the unexplained gap is identical to the coefficient of potential first-generation status in a regression model that pools together the data of the two groups and controls for potential first-generation status as well as the same control variables (Słoczyński Citation2020). In other words, the unexplained gap is the gap that remains after including all control variables. The value added of this method compared to a regression is that it shows how large is the relative contribution of each non-cognitive skill to the raw gap in one step.
3.4. Testing a potential channel: compulsory school leaving exams
Lastly, we extend the Kitagawa-Blinder-Oaxaca decomposition with age 16 test scores from national, compulsory school leaving exams (GCSEs). This exercise is not straightforward, because as discussed earlier, test scores at age 16 could already be the consequence of having different non-cognitive skills at age 13. Note that the educational attainment measure that we have used in our main models was measured at age 11, years before the non-cognitive measures. We add age 16 test scores to the models to investigate whether they could be a potential channel of the effects of non-cognitive skills on university participation. Since we find that they are, we replicate the same decomposition exercise placing age 16 test scores on the left hand-side to show that non-cognitive skills are an important source of the variation in test scores between the potential first-generation individuals and children of graduate parents.
4. Results
4.1. Graphical comparison
First, we compare the unconditional and conditional means of non-cognitive skills across the four groups defined in . shows that those who went to university, the upwardly mobile group of first-generation university students (Group 3) and the group whose parents are graduates (Group 4), had substantially higher levels of non-cognitive skills in adolescence even after controlling for individual characteristics and prior educational attainment, than those who did not go to university (Groups 1 and 2). Interestingly, in three out of the four domains, first-generation students (Group 3) have significantly higher non-cognitive skills even than those university entrants whose parents are graduates (Group 4). The first-generation individuals have the lowest external locus of control, the highest academic self-concept and work ethic, while in terms of self-esteem, they are similar to the group whose parents are graduates (Group 4).
Figure 1. Non-cognitive skills, raw and conditional means.
Notes: N = 4937, 6538, 7259 and 7507, respectively. Weighted using Wave 8 weights. Conditional means control for gender, age, number of siblings, region, whether the young person is a care leaver, whether the young person had a low birth weight or was born prematurely, ethnicity, mother’s social class, father’s social class, age of mother, age of father, single parent household, income deprivation, disability, whether their grandparent attended university, Free School Meal (FSM) status, private school, the highest qualification of the mother and father, and Key Stage 2 quintile of achievement. Source: University College London, UCL Institute of Education, Centre for Longitudinal Studies. (Citation2018).
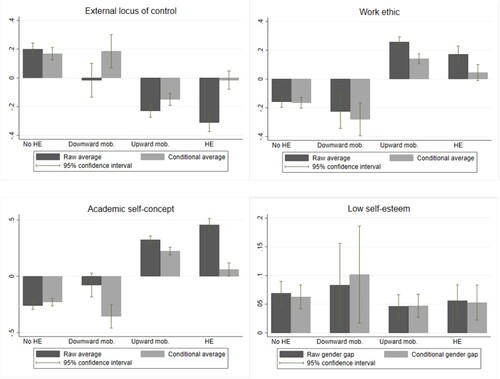
When we look at the potential first-generation group, first-generation students (Group 3) had about 0.3 standard deviations (SD) lower level of external locus of control, more than 0.4 SD higher level of academic self-concept, 0.3 SD higher level of work ethic and roughly 0.1 SD lower probability of having low-esteem in adolescence than those matching their parents with not going to university (Group 1), even after controlling for individual characteristics and prior educational attainment. This suggests that non-cognitive skills are important factors for intergenerational educational mobility.
4.2. Intergenerational educational mobility
We now turn our attention to how non-cognitive skills predict university attendance for potential first-generation individuals (Groups 1 and 3). As outlined in Section 3.2, we estimate a series of linear probability models where the outcome is a binary variable for attending university. The sample includes potential first-generation individuals only, as we want to understand how non-cognitive skills facilitate intergenerational educational mobility for those whose parents are non-graduates. The results of this analysis are presented in . In Models 1–4, we regress the binary outcome variable on each of the non-cognitive measures one at a time while controlling for the background characteristics listed in Section 2.3. In Model 5, we enter all four non-cognitive measures at the same time, and in Model 6, we additionally control for age 16 exam score quintiles. To address concerns about missing data, we replicate the main model, Model 5, using CFA instead of PCA to create the non-cognitive measures in Table O1 in the Online Appendix; the results are very similar.
Table 4. The relationship between non-cognitive skills and university attendance among potential first-generation individuals.
shows that non-cognitive skills play an important role in facilitating intergenerational educational mobility. All non-cognitive skills are statistically significant predictors of university attendance on their own. In a joint model, when all measures are included at the same time, their magnitudes decrease, but they all remain statistically significant. One standard deviation higher external locus of control decreases the probability of university participation by 3.8 percentage points, while one standard deviation higher work ethic and academic self-concept increase it by 2.5 and 8.9 percentage points, respectively. Having low self-esteem is associated with 5.4 percentage points lower likelihood of university participation. These relationships are over and above prior attainment (age 11 test scores) and a range of socio-demographic characteristics, all measured prior to these non-cognitive skills. Even in Model 6, where we introduce age 16 exam performance, which is expected to decrease the estimated coefficients on non-cognitive scores in terms of magnitude (assuming that age 16 exam performance is a channel through which adolescent non-cognitive skills affect the probability of HE participation), the statistical significance of work ethic and academic self-concept remain. One standard deviation higher work ethic is associated with 1.7 percentage point higher probability of university participation, while one standard deviation higher academic self-concept is associated with 2.8 percentage point higher probability of university participation.
We explore whether the relationship between non-cognitive skills and university participation is heterogeneous along the distribution of prior educational attainment, test scores measured at age 11, in Table A3 in Appendix A (and in Table O2 in the Online Appendix using CFA). The association between external locus of control and university participation seems to be the strongest in the middle of the distribution, although the estimated coefficient in the third quintile doesn’t differ from the others in a statistical sense (pairwise two-sided t-test p-values are between 0.136 and 0.476). Similarly, academic self-concept matters along the whole distribution the same way. Interestingly, work ethic is especially important in the upper-middle quintile, and the differences between the coefficient in the fourth quintile and three lower quintiles are statistically significant on conventional levels (two-sided t-test p-values are between 0.032 and 0.093). Having low self-esteem is only harmful to those at the top of the ability distribution, with statistically significant differences again between the coefficient of the top quintile compared to the first, second and third quintile (two-sided t-test p-values are between 0.005 and 0.091).
4.3. Heterogeneous effects by gender
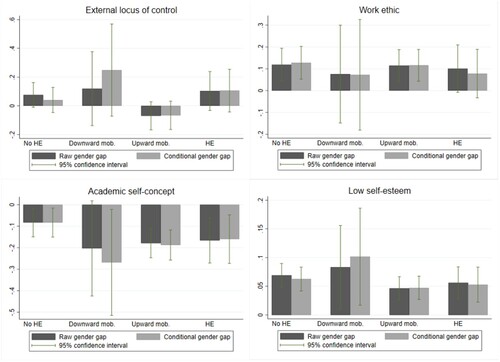
In this section we look at the effects of non-cognitive skills separately by gender. First, we plot the gender gap in each non-cognitive skill for the four groups as specified in . Similarly to , also shows the raw as well as the conditional gender gap (that is, the coefficient on female after controlling for the variables listed in Section 2.3). The gender gap is insignificant in external locus of control in all groups. Girls have higher work ethic in three out of the four groups, and lower academic self-concept and lower self-esteem in all groups.
Figure 2. The gender gap in non-cognitive skills.
Notes: Positive gaps indicate that women have higher level of a skill. Total N = 4937, 6538, 7259 and 7507, respectively. Weighted using Wave 8 weights. Conditional gender wage gap models control for age, number of siblings, region, whether the young person is a care leaver, whether the young person had a low birth weight or was born prematurely, ethnicity, mother’s social class, father’s social class, age of mother, age of father, single parent household, income deprivation, disability, whether their grandparent attended university, Free School Meal (FSM) status, private school, the highest school qualification of the mother and father, and their Key Stage 2 quintile of achievement. Source: University College London, UCL Institute of Education, Centre for Longitudinal Studies. (Citation2018).
reproduces the models of , adding the interaction terms of female and the non-cognitive skills. These results show that having high external locus of control is more detrimental for girls, while having high academic self-concept is somewhat more important for boys (Column 5). These results prevail even after controlling for GCSE scores as well (Column 6). Again, to address missing data concerns, we replicate the main model, Model 5, using CFA instead of PCA to create the non-cognitive measures in Table O2 in the Online Appendix.
Table 5. The relationship between non-cognitive skills and university attendance, by gender*non-cognitive skills interactions (sample of potential first-generation individuals).
Looking at these interaction terms by KS2 quintiles (Table A4 in Appendix A) reveals that external locus of control is only important for girls at the bottom of the skill distribution, while having low self-esteem is equally problematic for boys and girls at the top of the skill distribution. Furthermore, the coefficient on the female variable suggests that girls are increasingly more likely to go to university than boys moving up along the skill distribution. While in the lowest quintile, potential first-generation girls are not significantly more likely to go to university than potential first-generation boys (0.056), in the highest quintile, they are 16 percentage point more likely to attend. This pattern is similar using the CFA method as well (Table O2 in the Online Appendix).
4.4. Kitagawa-Blinder-Oaxaca decomposition
In this section we look at the relative contributions of non-cognitive skills to the gap in university participation between potential first-generation and non-first-generation young people. In all decompositions presented below, we control for the same variables as before; for simplicity, grouped into intuitive categories.
Decomposing the gap in the probability of university participation between children of non-graduate and graduate parents reveals that endowments explain about 60% of the difference (0.187 out of 0.300, see ). Out of the variable groups, differences in parental background (that is, beyond whether parents went to university) explain the largest share of the difference, 27%. The contribution of high-stakes test scores measured at age 11 explains 7% of the difference, while the contribution of academic self-concept is 10% and the contribution of external locus of control is 3%. The contribution of the other two skills, low self-esteem and work ethic is close to zero. Interestingly, academic self-concept seems to be more important for boys’ university participation (13% vs. 7%), while external locus of control is somewhat more important for girls (4% vs. 2%).
Table 6. Kitagawa-Blinder-Oaxaca decomposition of university attendance among potential first-generation individuals and children of graduate parents.
4.5. Potential channel: compulsory school leaving exams at age 16
In this section, we extend the decomposition exercise with compulsory school-leaving exams taken at age 16. As mentioned, these could already be affected by adolescent non-cognitive skills hence we have not included them in our main model in the previous section. As expected, age 16 test scores make a substantial contribution to the difference in university participation of the potential first-generation students and children of graduate parents (). On average, age 16 test scores explain about 49 percent of the university participation gap. Conditional on age 16 test scores, the contribution of academic self-esteem is three percent. while the contribution of age 11 test scores is reduced to just two percent. When both age 11 and age 16 test scores are included in a model, we could interpret the earlier measure as a proxy for cognitive abilities or baseline educational attainment, while age 16 test scores capture everything that happened to the educational attainment of a young person between age 11 and age 16; we could call this as a measure of educational progression. These results suggest that for university participation, age 16 educational attainment is an important channel of the effects of non-cognitive skills.
Table 7. Kitagawa-Blinder-Oaxaca decomposition of university attendance among potential first-generation individuals and children of graduate parents: the role of age 16 test (GCSE) scores.
As age 16 test scores prove to be an important channel of the effects of non-cognitive skills on university participation, we turn to decomposing these using the same method. This allows us to determine how important our measures of non-cognitive skills are for this crucial intermediate outcome. We find that on average, potential first-generation students have 0.551 SD lower age 16 test scores than children of graduate parents (). In terms of education effect sizes, this is a substantial difference (Kraft Citation2020). Most of this gap, 27 percent, is explained by parental background factors (parents’ social class and age). The contribution of academic self-concept is 15 percent, the contribution of external locus of control is six percent, while that of age 11 test scores is eight percent. Thus, the contribution of academic self-concept to age16 test scores is even a bit higher than the contribution of early educational attainment. Looking separately by gender, the contribution of academic self-concept to age 16 test scores is higher for boys than girls (18 vs. 2%).
5. Discussion
This paper looked at the role of non-cognitive skills in facilitating intergenerational educational mobility. We have shown that comparing university participants, first-generation students possess lower external locus of control, higher work ethic, and higher academic self-concept in early adolescence than those whose parents are graduates. Thus, we document that conditional on early education attainment, having higher non-cognitive skills helps potential first-generation students to compensate for their relative disadvantage and beat the odds in terms of going to university. Our results cohere with Edwards et al. (Citation2022) who find that non-cognitive skills are important for compensating the social disadvantage of first-generation students.
When we turn our attention to the heterogeneity of these results, we find that while work ethic and academic self-concept seem to be important for everybody, and especially crucial for boys, low self-esteem harms only those at the top of the ability distribution, boys and girls alike. This points to the need for a special focus on high-achieving, but underconfident disadvantaged young people.
We further explore how much these non-cognitive skills matter in explaining the socioeconomic gap in university participation using the Kitagawa-Blinder–Oaxaca decomposition. Decomposing the gap in the probability of university participation among the potential first-generation individuals and children of graduate parents by gender reveals that the importance of academic self-concept is higher for boys than for girls. Previous research has indicated that academic self-concept and achievement are mutually reinforcing, leading to gains in a ‘virtuous cycle’ (Hansen, Henderson, and Shure Citation2017). Together with our findings this highlights the potential power of interventions that develop academic self-concept, especially for boys from disadvantaged backgrounds.
Surprisingly, girls only have an advantage in work ethic while boys on average have higher academic self-concept and higher self-esteem. We believe that the result of boys having higher levels of these two non-cognitive skills is due to the nature of these measures. Academic self-concept and self-esteem are measures of self-beliefs, while work ethic, in which girls exhibit higher levels in this paper, is more related to how people behave. Previous research has shown that there are established differences in how men and women perceive their own abilities (Jerrim, Shure, and Wyness Citation2020) and, as a result, decide to behave (Niederle and Vesterlund Citation2007). This may be especially important in the lead-up to high-stake examinations and university applications.
Lastly, we provide evidence that age 16 test scores are an important channel between adolescent non-cognitive skills and university participation. Once we control for both age 11 and age 16 test scores, age 16 test scores turn out to be more important, suggesting that what happens in school between age 11 and age 16 is critical for university participation. We probe the importance of age 16 test scores by exploring how important our measures of non-cognitive skills are in explaining the socioeconomic gap in these high stakes, compulsory school-leaving exams. This analysis shows that academic self-concept is more important than attainment at age 11 for explaining the SES gap in age 16 test scores, especially for boys. Again, this highlights the potential of interventions targeting academic self-concept. Overall, our results indicate that non-cognitive and cognitive skills (as proxied by prior attainment) are not substitutes for each other, but rather complement each other: having high educational attainment is necessary but not sufficient for individuals to beat the odds and make it to university.
This study is not without limitations. First, non-cognitive skills are not allocated randomly to people, so we cannot measure the causal effects of these skills on educational mobility. All our results describe correlational relationships. Second, we make use of the first eight waves of a cohort study. As in the case of all such studies, people attrit over time, and even those who made it to Wave 8 (that we use to measure university participation) might lack data from earlier waves due to item non-response. Attrition and item non-response are not random, and they are probably related both to non-cognitive skills and educational outcomes. As our results show, people with lower levels of non-cognitive skills are more likely to drop out of the study; thus, our results are more valid for those with higher skills.
Third, the data measure non-cognitive skills at different ages for different individuals, between age 13 and age 16. This means they do not allow us to test how stable these skills are over time. While we provide several robustness tests to show that the age of measurement does not bias our main conclusions, this is still a limitation to keep in mind. Fourth, we are not able to control for inherent cognitive skills, completely unaffected by non-cognitive skills. Although our baseline proxy for cognitive skills, age 11 test scores, was measured before the measurement of non-cognitive skills for everybody, they might have already been affected by these young people’s childhood non-cognitive skills (that we cannot measure). In terms of GCSE scores measured around age 16, for some people some non-cognitive skills were captured after taking these exams, so they might have been affected by them. In general, as there is an inherent connection between cognitive and non-cognitive skills, it is challenging to measure one without being affected by the other.
Taken together, our results provide evidence that non-cognitive skills, and especially academic self-concept, are important facilitators of intergenerational educational mobility. If societies and universities want to improve the diversity of their university cohorts and promote intergenerational educational mobility, then interventions to target the development of these crucial skills should be prioritized. Conducting a meta-analysis, O’Mara et al. (Citation2006) show that targeted interventions can increase academic self-concept by 0.51 standard deviation, which is a meaningful impact.
Our results also underline the importance of early interventions (i.e. well before university application and crucial entrance exams). For policymakers and practitioners interested in developing interventions to target these non-cognitive skills and improve socioeconomic gaps in access to higher education, this may be a critical period to intervene. While continuing to improve the academic performance of disadvantaged students should remain a policy priority, focusing on the development of their complementary non-cognitive skills may be just as important in improving intergenerational educational mobility.
Supplemental Material
Download MS Word (44.5 KB)Acknowledgements
The Nuffield Foundation is an endowed charitable trust that aims to improve social wellbeing in the widest sense. It funds research and innovation in education and social policy and also works to build capacity in education, science and social science research. The Nuffield Foundation has funded this project (grant number EDO/43570), but the views expressed are those of the authors and not necessarily those of the Foundation. More information is available at www.nuffieldfoundation.org. We thank the participants of the Hungarian Society of Economics (HSE), the Scottish Economic Society (SES), the American Educational Research Association (AERA), and the European Society for Population Economics (ESPE) annual conferences and János Kiss Hubert, John Jerrim and Jake Anders for helpful comments.
Additional information
Funding
Notes
1 Note that in the rest of the paper, we always use the lower age (t) to indicate the age of cohort members at a particular wave, but in practice, their age was between t and t+2.
2 In adolescence, Next Steps measured locus of control only once, in Wave 2 for most people. Although the same questions were asked again in Wave 4, only for those in the ethnic boost sample that we do not use. Locus of control was measured again in young adulthood (after university applications), but we do not use those data collections.
3 Self-efficacy is a similar skill, but while self-concept focuses on how individuals feel about their past (or recent) achievements, self-efficacy measures expectations about their future performance (Gutman and Schoon Citation2016). In this paper we only look at self-concept.
4 The descriptive statistics of these alternative measures are reported in Table B3 in Appendix B, their correlations with each other and with our original measure are reported in Table B4 in Appendix B, while our main results re-estimated using these measures are reported in Tables B5 and B6 in Appendix B.
5 The HEIPR is applicable to students who live in England, enter HE for the first time, attend UK HE institutions and English, Welsh and Scottish further education colleges, and, stay in HE for at least six months (Department for Education Citation2017). It is an estimate of the likelihood of a young person participating in HE, in our case, by age 25, i.e. the sum of the likelihoods of HE entry at ages 17–25. This is estimated using the administrative data of the Higher Education Statistics Agency on the number university participants and the size of each cohort from the UK Census (Office for National Statistics). As the yearly publications of the Department for Education cover the data of those at age 17–25 in each year, we constructed the HEIPR rate of our particular cohort (those born in 1989–1990) by using the appropriate year of observation for all ages (i.e., the data of the 2014/2015 academic year for age 25, the data of the 2013/14 academic year for age 24, … , etc.).
6 This linear measure is created by assigning values to the grades, for example, Grade G is worth 16 points. Each grade improvement thereafter, for example, from G to F, C to B, or A to A*, is equivalent to an additional six points. The capped linear score takes the best eight GCSE subjects scores. This measure accounts for the fact that students may take a different number of GCSEs (and resits) and enables better comparability than the total GCSE score.
7 The hierarchical structure of the data raises the question of applying fixed effects (FE) (or hierarchical) models. However, as in our main estimation sample the number of observations is 3,753 and the sample was taken from 674 schools, the average number of observations per school is lower than the number of explanatory variables in the model. Thus, we decided not to present the results from FE models (which were similar in terms of magnitude). This similarity reflects the fact that we control for socioeconomic background extensively and it is unlikely that there is systematic selection to schools based on non-cognitive skills.
8 We also provide a robustness test for our main results in Table B7 in Appendix B using a probit model.
9 We also applied the binary-dependent-variable-extension of the decomposition as in Fairlie (Citation2005) in Table B8 in Appendix B, which yields similar results.
References
- Abadie, A., S. Athey, G. W. Imbens, and J. Wooldridge. 2017. When Should You Adjust Standard Errors for Clustering? (Working Paper No. 24003; Working Paper Series). Cambridge, MA: National Bureau of Economic Research. doi:10.3386/w24003.
- Adamecz-Völgyi, A., M. Henderson, and N. Shure. 2020. “Is ‘First in Family’ a Good Indicator for Widening University Participation?” Economics of Education Review, doi:10.1016/j.econedurev.2020.102038.
- Almlund, M., A. L. Duckworth, J. Heckman, and T. Kautz. 2011. “Personality Psychology and Economics.” In Handbook of the Economics of Education (Vol. 4), edited by E. A. Hanushek, S. Machin, and L. Woessmann, 1–181. Elsevier. doi:10.1016/B978-0-444-53444-6.00001-8.
- Blanden, J., P. Gregg, and L. Macmillan. 2007. “Accounting for Intergenerational Income Persistence: Noncognitive Skills, Ability and Education.” The Economic Journal 117 (519): C43–C60. doi:10.1111/j.1468-0297.2007.02034.x.
- Blanden, J., and S. Machin. 2004. “Educational Inequality and the Expansion of UK Higher Education.” Scottish Journal of Political Economy 51 (2): 230–249. doi:10.1111/j.0036-9292.2004.00304.x.
- Blinder, A. S. 1973. “Wage Discrimination: Reduced Form and Structural Estimates.” The Journal of Human Resources 8 (4): 436–455. doi:10.2307/144855.
- Britton, J., L. Dearden, N. Shephard, and A. Vignoles. 2016, April 13. How English Domiciled Graduate Earnings Vary With Gender, Institution Attended, Subject and Socio-Economic Background. https://www.ifs.org.uk/publications/8233.
- Chetty, R., N. Hendren, P. Kline, E. Saez, and N. Turner. 2014. “Is the United States Still a Land of Opportunity? Recent Trends in Intergenerational Mobility.” American Economic Review 104 (5): 141–147. doi:10.1257/aer.104.5.141.
- Chowdry, H., C. Crawford, and A. Goodman. 2011. The Role of Attitudes and Behaviours in Explaining Socio-Economic Differences in Attainment at Age 16. 18.
- Coopersmith, S. 1959. “A Method for Determining Types of Self-Esteem.” The Journal of Abnormal and Social Psychology 59 (1): 87–94. doi:10.1037/h0048001.
- Department for Education. 2011. LSYPE User Guide to the Datasets: Wave 1 to Wave 7, 103. http://doc.ukdataservice.ac.uk/doc/5545/mrdoc/pdf/lsype_user_guide_wave_1_to_wave_7.pdf.
- Department for Education. 2017, September 28. Statistics: Participation Rates in Higher Education. Participation Rates in Higher Education for England. https://www.gov.uk/government/collections/statistics-on-higher-education-initial-participation-rates.
- Edwards, R., R. Gibson, C. Harmon, and S. Schurer. 2022. “First-in-Their-Family Students at University: Can Non-Cognitive Skills Compensate for Social Origin?” Economics of Education Review 91: 102318. doi:10.1016/j.econedurev.2022.102318.
- Elkins, R. K., S. C. Kassenboehmer, and S. Schurer. 2017. “The Stability of Personality Traits in Adolescence and Young Adulthood.” Journal of Economic Psychology 60: 37–52. doi:10.1016/j.joep.2016.12.005.
- Fairlie, R. W. 2005. “An Extension of the Blinder-Oaxaca Decomposition Technique to Logit and Probit Models.” Journal of Economic and Social Measurement 30 (4): 305–316. doi:10.3233/JEM-2005-0259.
- Gorard, S., N. Siddiqui, and V. Boliver. 2017. “An Analysis of School-Based Contextual Indicators for Possible Use in Widening Participation.” Higher Education Studies 7 (2): 79. doi:10.5539/hes.v7n2p79.
- Gutman, L. M., and I. Schoon. 2016. “A Synthesis of Causal Evidence Linking Non-Cognitive Skills to Later Outcomes for Children and Adolescents.” In Non-Cognitive Skills and Factors in Educational Attainment, edited by M. S. Khine, and S. Areepattamannil, 171–198. SensePublishers. doi:10.1007/978-94-6300-591-3_9.
- Hansen, K., and M. Henderson. 2019. “Does Academic Self-Concept Drive Academic Achievement?” Oxford Review of Education 45 (5): 657–672. doi:10.1080/03054985.2019.1594748.
- Hansen, K., M. Henderson, and N. Shure. 2017. Does Academic Self-Concept Predict Further and Higher Education Participation? (Centre for Global Higher Education Working Paper No. 16). Centre for Global Higher Education, UCL Institute of Education. https://www.researchcghe.org/publications/working-paper/does-academic-self-concept-predict-further-and-higher-education-participation/.
- Heckman, J. J., J. Stixrud, and S. Urzua. 2006. “The Effects of Cognitive and Noncognitive Abilities on Labor Market Outcomes and Social Behavior.” Journal of Labor Economics 24 (3): 411–482. doi:10.1086/504455.
- Henderson, M., N. Shure, and A. Adamecz-Völgyi. 2020. Moving On Up: ‘First in Family’ University Graduates in England. Oxford Review of Education. doi:10.1080/03054985.2020.1784714.
- Hoeschler, P., S. Balestra, and U. Backes-Gellner. 2018. “The Development of Non-Cognitive Skills in Adolescence.” Economics Letters 163: 40–45. doi:10.1016/j.econlet.2017.11.012.
- Ishitani, T. T. 2006. “Studying Attrition and Degree Completion Behavior among First-Generation College Students in the United States.” Journal of Higher Education 77 (5): 861–885. doi:10.1353/jhe.2006.0042.
- Jacob, B. A. 2002. “Where the Boys Aren’t: Non-Cognitive Skills, Returns to School and the Gender Gap in Higher Education.” Economics of Education Review 21 (6): 589–598. doi:10.1016/S0272-7757(01)00051-6.
- Jerrim, J., N. Shure, and G. Wyness. 2020. Driven to Succeed? Teenagers’ Drive, Ambition and Performance on High-Stakes Examinations (IZA Discussion Papers No. 13525). IZA Institute of Labor Economics. https://www.iza.org/publications/dp/13525/driven-to-succeed-teenagers-drive-ambition-and-performance-on-high-stakes-examinations.
- Kalil, A., and S. Khalid. 2010. Non-Cognitive Skills and Educational Attainment [Unpublished manuscript]. https://paa2011.princeton.edu/papers/112079.
- Kautz, T., J. J. Heckman, R. Diris, B. ter Weel, and L. Borghans. 2014. Fostering and Measuring Skills: Improving Cognitive and Non-Cognitive Skills to Promote Lifetime Success (Working Paper No. 20749). National Bureau of Economic Research. doi:10.3386/w20749.
- Kitagawa, E. M. 1955. “Components of a Difference Between Two Rates.” Journal of the American Statistical Association 50 (272): 1168–1194. doi:10.2307/2281213.
- Kraft, M. A. 2020. “Interpreting Effect Sizes of Education Interventions.” Educational Researcher 49 (4): 241–253. doi:10.3102/0013189X20912798.
- Mendez, I., and G. Zamarro. 2016. “Noncognitive Skills.” In Non-cognitive Skills and Factors in Educational Attainment, edited by M. S. Khine, and S. Areepattamannil, 411–428. SensePublishers. doi:10.1007/978-94-6300-591-3_19.
- Mendolia, S., and I. Walker. 2014. “The Effect of Noncognitive Traits on Health Behaviours in Adolescence.” Health Economics 23 (9): 1146–1158. doi:10.1002/hec.3043.
- Neumark, D. 1988. “Employers’ Discriminatory Behavior and the Estimation of Wage Discrimination.” The Journal of Human Resources 23 (3): 279–295. doi:10.2307/145830.
- Niederle, M., and L. Vesterlund. 2007. “Do Women Shy Away from Competition? Do Men Compete Too Much?” The Quarterly Journal of Economics 122 (3): 1067–1101. doi:10.1162/qjec.122.3.1067.
- O’Mara, A. J., H. W. Marsh, R. G. Craven, and R. L. Debus. 2006. “Do Self-Concept Interventions Make a Difference? A Synergistic Blend of Construct Validation and Meta-Analysis.” Educational Psychologist 41 (3): 181–206. doi:10.1207/s15326985ep4103_4.
- Oaxaca, R. 1973. “Male-Female Wage Differentials in Urban Labor Markets.” International Economic Review 14 (3): 693–709. doi:10.2307/2525981.
- Oreopoulos, P., and U. Petronijevic. 2013. Making College Worth It: A Review of Research on the Returns to Higher Education (Working Paper No. 19053). National Bureau of Economic Research. doi:10.3386/w19053.
- Pascarella, E. T., C. T. Pierson, G. C. Wolniak, and P. T. Terenzini. 2004. “First-Generation College Students: Additional Evidence on College Experiences and Outcomes.” The Journal of Higher Education 75 (3): 249–284. doi:10.1080/00221546.2004.11772256.
- Pike, G. R., and G. D. Kuh. 2005. “First- and Second-Generation College Students: A Comparison of Their Engagement and Intellectual Development.” The Journal of Higher Education 76 (3): 276–300. doi:10.1080/00221546.2005.11772283.
- Prada, M. F., and S. Urzúa. 2017. “One Size Does Not Fit All: Multiple Dimensions of Ability, College Attendance, and Earnings.” Journal of Labor Economics 35 (4): 953–991. doi:10.1086/692477.
- Rotter, J. B. 1966. “Generalized Expectancies for Internal Versus External Control of Reinforcement.” Psychological Monographs: General and Applied 80 (1): 1–28. doi:10.1037/h0092976.
- Schurer, S. 2017. “Bouncing Back from Health Shocks: Locus of Control and Labor Supply.” Journal of Economic Behavior & Organization 133: 1–20. doi:10.1016/j.jebo.2016.10.019.
- Shure, N. 2021. “Non-Cognitive Peer Effects in Secondary Education.” Labour Economics 73: 102074. doi:10.1016/j.labeco.2021.102074.
- Słoczyński, T. 2020. “Average Gaps and Oaxaca–Blinder Decompositions: A Cautionary Tale About Regression Estimates of Racial Differences in Labor Market Outcomes.” ILR Review 73 (3): 705–729. doi:10.1177/0019793919874063.
- Structural Equation Modeling Reference Manual, Release 16. 2017. Stata Press. https://www.stata.com/bookstore/structural-equation-modeling-reference-manual/.
- Thompson, M. E. 2021. “Grade Expectations: The Role of First-Year Grades in Predicting the Pursuit of STEM Majors for First- and Continuing-Generation Students.” The Journal of Higher Education 92 (6): 961–985. doi:10.1080/00221546.2021.1907169.
- Toutkoushian, R. K., J. A. May-Trifiletti, and A. B. Clayton. 2019. “From “First in Family” to “First to Finish”: Does College Graduation Vary by How First-Generation College Status Is Defined?” Educational Policy, doi:10.1177/0895904818823753.
- University College London, UCL Institute of Education, Centre for Longitudinal Studies. 2018. Next Steps: Sweeps 1-8, 2004-2016: Secure Access [data collection]. doi:10.5255/UKDA-SN-7104-4.
- Valentine, J. C., D. L. DuBois, and H. Cooper. 2004. “The Relation Between Self-Beliefs and Academic Achievement: A Meta-Analytic Review.” Educational Psychologist 39 (2): 111–133. doi:10.1207/s15326985ep3902_3.
- Walker, I., and Y. Zhu. 2018. “University Selectivity and the Relative Returns to Higher Education: Evidence from the UK.” Labour Economics 53: 230–249. doi:10.1016/j.labeco.2018.05.005.
- Woessmann, L. 2004. How Equal are Educational Opportunities? Family Background and Student Achievement in Europe and the United States. In IZA Discussion Papers (No. 1284; IZA Discussion Papers). Institute of Labor Economics (IZA). https://ideas.repec.org/p/iza/izadps/dp1284.html.