
 ?Mathematical formulae have been encoded as MathML and are displayed in this HTML version using MathJax in order to improve their display. Uncheck the box to turn MathJax off. This feature requires Javascript. Click on a formula to zoom.
ABSTRACT
This paper examines the presence of systematic differences in teachers' grading behaviour across gender and whether these can be attributed to teacher bias. This study measures these differences by comparing teachers' grades with national exams, which are externally and anonymously marked. Consistent with the literature, the gender gap in teacher grading is against boys. Using a dataset with gender gaps at class-subject level – which allows to follow teachers in different classes over time – this study shows that teachers' grading behaviour is not persistent across classes. Results suggest that gender grading gaps are explained by differences in students' behaviour.
1. Introduction
School grades are one of many tools that teachers use to provide feedback to students about their learning. However, teachers' evaluations conflate student cognitive performance with non-cognitive factors, such as student effort, engagement, and class behaviour; and therefore, may potentially reflect teachers' biases (Brookhart et al. Citation2016). In addition, previous research has established the direct influence of teachers' grading behaviour on student motivation, self-confidence, and effort (e.g. Bonesrønning Citation2008; Burgess and Greaves Citation2013; Figlio and Lucas Citation2004; Mechtenberg Citation2009).
In recent years, there has been growing interest in whether gender-biased perceptions affect teachers' grading behaviour. This question has taken on significance in the context of widely known and documented gender gaps in student performance. Do teachers grade differently according to gender? Can grading gaps be interpreted as evidence of teachers' biases, or do they only reflect differences in student behaviour? This paper addresses these two questions. I proceed in two steps. First, using precise and comprehensive student-level administrative data, I examine whether teachers' grading behaviour systematically differs across gender. Based on prior studies (Blank Citation1991; Goldin and Rouse Citation2000; Lavy Citation2008), I use a difference-in-differences strategy to capture gender differences in teachers' grading. I compare school grades marked by teachers and national exams marked externally and blindly. Second, I explore whether these differences can be attributed to bias on the part of teachers or differential behaviour on the part of children in their performance on different tests.
This paper connects to the literature on gender bias in teachers' grading. Usually, the research methodology in this literature is based on the comparison of blind and non-blind test scores. This strategy exploits the fact that in the blind test the student's identity is not revealed – and therefore it is assumed free of any teacher bias – while in the non-blind test, the student's identity is known. Then, provided that both tests measure the same abilities, the blind score can be conceived as a counterfactual measure to the non-blind score, and so the difference between the two test scores corresponds to a measure of the teacher's bias.Footnote1 Contrary to the general belief that teachers may be biased against female students (Ceci et al. Citation2014; Tiedemann Citation2000), most of the studies have found that the gender gap is against male students. Teachers' pro-female bias has been documented in several countries and educational contexts, including Czech Republic (Protivínský and Münich Citation2018), France (Terrier Citation2020), Israel (Lavy Citation2008; Lavy and Sand Citation2018), Italy (Casula and Liberto Citation2017), Norway (Falch and Naper Citation2013), and the United States (Cornwell, Mustard, and Parys Citation2013).Footnote2
In this paper, I provide new and more definitive evidence on the extent and causes of grading gaps between non-anonymised and anonymised central test scores. As previous studies, I exploit the fact that the national test is anonymously marked, and therefore is a blind test; whereas the school grades are marked by the teacher who knows the identity of the student, and therefore it can be considered as a non-blind test. I show that deviations between school grades and standardise tests might reflect not only teacher's biases but also differences in how these two types of evaluations are linked to factors related to students' achievement, such as student effort, ability, and behaviour. I use an administrative student-level dataset on school grades and national test scores in Chile for the period 2011–2018. This information is available for two subjects: Spanish language (henceforth referred to as Spanish) and math. One particular feature of the data is that I have information about these two types of assessments at four different times – 4th grade (students aged 9–10), 6th grade (students aged 11–12), 8th grade (students aged 13–14), and 10th grade (students aged 15–16). Additionally, using teachers' administrative records I am able to match students and their subject-teachers, as well as their characteristics, including gender and teaching experience.
I start by documenting the existence of gender differences in grading behaviour. Consistent with the literature, I find that boys get lower grades than girls when they are assessed by their teachers compared to their scores in the national exams, in both Spanish and math. This suggests that there is a grading gap, and this runs against boys. The grading gap against boys remains unchanged by school type, rural/urban schools, school size and geographical location. In addition, I provide evidence that this grading gap holds for all the grades examined. Moreover, it presents a clear pattern, increasing from 4th grade to 8th grade, before falling to the transition to 10th grade. I also show that grading gap against boys is present throughout the entire ability distribution
In addition, I construct a classroom-subject dataset to quantify how much of the variation in the grading gap by gender can be attributed to schools, teachers, and classes, controlling for observed characteristics of the teachers. This dataset allows to compute teachers' grading behaviour in different classrooms, with different groups of students during the period of study. In contrast to Lavy and Megalokonomou (Citation2019), I show that teachers' grading behaviour is far from being a fixed characteristic of the teacher. In turn, it seems to be governed by the characteristics of the class and, more specifically, by the characteristics of the students.
Finally, by exploiting rich survey information, I provide evidence on the mechanisms that help to understand the grading gap against boys. In particular, I focus on the role of student behaviour at school in explaining the pro-female grading gap. To accomplish this, I include proxy variables for school effort – using administrative data of school attendance and grade retention – and students' attitudes to learning – using students' surveys. This alleviates the concern that these variables could pick up teachers' biased perceptions. I find that female students experience higher (more positive) returns to behavioural variables than male students. Specifically, I show that part of the gender grading gap is due to differential effort – i.e. girls exert more effort than boys – and part is due to girls being rewarded more for a given amount of effort – i.e. even if boys put in the same effort as girls, they would not get the same school grade.
Overall, this study contributes to the existing literature in several ways. First, it contributes with new evidence of a grading gap against boys, in a developing country as Chile. To the best of my knowledge, it is the first evidence that the grading gap in favour of girls also applies in a middle-income country with relatively low-performing schools. Second, whereas most studies analyse the gender gaps in grading using limited data samples, this paper uses student-level administrative data.Footnote3 Using administrative data not only improves the precision of the estimates but also allows to link students to teachers and schools. Third, this is the first study to evaluate whether the grading gap varies systematically with the age of the children, showing that the pro-female grading gap is present throughout all the school years, with a clear pattern increasing with age up to 8th grade and decreasing in the transition to 10th grade. Fourth, this study provides a more comprehensive understanding of sources of variation of the gaps in grading. In contrast to some earlier studies, it is concluded that teachers' grading behaviour is not persistent across classes nor is it independent of the classroom environment. Fifth, the findings of this research provide insights into the explanations behind teachers' grading behaviour. In particular, add to the literature by emphasising the role of the students' behaviour in shaping gender differences in teachers' grading.
The remainder of this paper proceeds as follows. Section 2 offers a brief discussion of the factors that may explain gender differences in teachers' grading. Section 3 gives a description of the institutional setting and the data. Section 4 presents a theoretical motivation of the gender differences in grading. Section 5 explains the econometric framework and tests the existence of these differences. Section 6 discusses mechanisms behind these differences. Specifically, Section 6.1 quantifies and identifies the sources of variation of the gender differences in grading and discusses whether these differences can be attributed to bias on the part of teachers. Section 6.2 focuses on the role of non-cognitive skills and student behaviour. Finally, Section 7 offers a summary of the main findings and discusses their implications.
2. Literature review
What might explain this observed gender bias? The literature has identified a number of explanations for the bias against boys. First, it may be driven by teachers practising statistical discrimination (Arrow Citation1973; Phelps Citation1972). Under this theory, teachers might use observable characteristics to proxy for unobservable ability. In this respect, Lavy (Citation2008) using data from public high schools' teachers in Israel argues that if teachers are influenced by the expected performance of the group, teachers should give higher marks to the sex which performs better in that school. However, he finds that regardless of the relative performance of boys and girls in a school, the bias is always against boys.
Second, previous research emphasises the role of teachers, exploring the relationship between gender bias and teachers' characteristics.Footnote4 Lavy (Citation2008) shows that the relationship between teacher characteristics (e.g. gender, age, experience, and number of children) and the gender bias varies from subject to subject.Footnote5 In another example, Falch and Naper (Citation2013) find that a higher proportion of female teachers at the school implies lower grades for female students in Norwegian language, whereas there is no effect in math and English. In a recent study, Lavy and Megalokonomou (Citation2019), using panel data on teachers and students from 21 high schools in Greece, show that the teachers' biased behaviour is highly persistent across classes.
Third, several studies have shown that women are less effective compared to men in competitive environments (e.g. Azmat, Calsamiglia, and Iriberri Citation2016; Gneezy, Niederle, and Rustichini Citation2003; Gneezy and Rustichini Citation2004; Niederle and Vesterlund Citation2007; Shurchkov Citation2012). Consequently, boys may overperform in high-stakes test compared to girls, since it is a more competitive environment. Then, if the blind test is a high-stakes test, this behaviour may explain the bias in favour of girls. However, the basic finding that the bias is against boys does not vary with different levels of competitiveness (Casula and Liberto Citation2017; Falch and Naper Citation2013; Terrier Citation2020).
Finally, it is conceivable that differences in students' behaviour explain the difference in teachers' evaluations. Several lines of evidence suggest that gender correlates with the level of non-cognitive abilities (Bertrand and Pan Citation2013). In particular, it is well established that boys tend to have more behavioural and attention problems (Ready et al. Citation2005), less self-regulation (Matthews, Cameron, and Morrison Citation2009), and less self-discipline (Duckworth and Seligman Citation2006; Kenney-Benson et al. Citation2006) than girls. Then, teachers – consciously or unconsciously – might reward positive behaviour by giving higher marks. Cornwell, Mustard, and Parys (Citation2013) using data on teachers' perception about classroom behaviour at student level show that when student behaviour is taken into account no gender bias against boys is found. One major drawback of this approach is that the measure of non-cognitive skills relies on the teacher's perception about the student's behaviour, which may also be biased.Footnote6
Together, the reason for teachers' grading bias in favour of female students remains unexplained. It does not appear to be the result of discrimination. The evidence on teacher characteristics is far from conclusive. There is no evidence that it results from anonymised tests taking place in a more competitive environment. Finally, the evidence that it results from students' behaviour relies on teachers' – possibly biased – perceptions.
3. Institutional setting and data
3.1. Institutional setting
The school system in Chile is organised in three levels: pre-primary education (up to 5 years old); primary education (6–13 years old); and secondary education (14–17 years old). Primary education consists of eight grades and is divided into two cycles: the first cycle – years 1–4 – and the second cycle – comprising years 5–8. Secondary education consists of four grades (years 9–12) and is structured in two cycles. The first 2 years offer general education and is common for all the students. During the final 2 years students choose between academic studies and technical–professional/vocational studies. Generally, students who wish to attend to higher education follow the academic path, while students who are interested in vocational education follow the path of technical education. Since 2003, both primary and secondary education are mandatory for all children up to 18 years old.
For primary and secondary education, there are three types of school providers: (1) municipal or public schools, which are administered by the municipalities and are financed through a per-student subsidy from central government; (2) private subsidized or voucher schools, which are administered by for-profit or non-profit private organizations, and receive a per-student subsidy as well as municipal schools. In addition, they can be financed through co-payment and unlike the public schools they can select their students; (3) private schools, which are run by private organizations (whether or not for profit) and receive no public funding.Footnote7
To test the presence of systematic differences in teachers' grading behaviour, we need to compare blind and non-blind assessments. The non-blind test score is based on school grades. The academic qualification in Chile uses a rating scale of 7 points with an increment of 0.1, 1 being the lowest and 7 the highest. Teachers set the final grade based on tests taken during the academic year between March and December. The evaluation standards, structure and methods are decided autonomously by each school and/or teacher. Systematic evidence on the number, structure and assessment techniques of students – used by schools or teachers – is not available. However, the Law establishes basic guidelines about student evaluations that schools must follow. First, the number and weighting of the assessments used to compute the final grade should be consistent with the planning for that subject. These criteria must be informed to the students in advance. Second, teachers can use formative and/or summative assessments in the classroom. School grades are relevant to be promoted to the next year.Footnote8 Also, high school grades are part of the eligibility criteria for admission to higher education.
The anonymised test score – which is not affected by teacher bias – is the Sistema de Medición de la Calidad de la Educación (SIMCE) test. This test corresponds to a standardised test administered by the Ministry of Education to all students in some particular grades, and it is the main instrument to measure the quality of education in Chile. The SIMCE test has no direct consequences for students' future prospects, therefore it is a low-stakes test. The test is administrated by external examiners and provides information about students' performance relative to the country's National Curriculum Framework. The test measures the areas of language (Spanish) and mathematics, and for some cohorts also measures the areas of natural sciences and social sciences.Footnote9
The SIMCE test is designed based on the measurement model of Item Response Theory (IRT), which is extensively used to assess student learning in most international large-scale standardised tests, such as PISA, TIMSS and PIRLS. Scores are scaled so that the national mean in each year is 250 points, with a standard deviation of 50 points. The SIMCE test consists of both closed-ended questions (multiple choice) and open-ended questions. Both types have a different marking process. Regarding the first type, the questions are captured and then digitised. The people who execute these tasks have access to the information contained in the answers sheet, such as the name of the school, the name of the student and the marks of the answers. However, they do not know what the correct answers are. The correction of open questions is carried out by means of a software that shows the corrector an image of the answer written by a student that is not individualised, thus it protects the personal and sensitive data of the students, including student's gender. For all practical purposes therefore, the SIMCE test is an anonymous and unbiased evaluation. National test results are public at national level (including regions and municipalities or districts) as well as at school level. The SIMCE test scores at individual or class levels are only available for researchers. Children, parents, teachers, and school directors do not have access to this information. Students take the SIMCE test before they know their final grades in school. Specifically, students take the SIMCE test in October/November, whereas students know their school grade usually at the end of the academic year.
3.2. Data
To study the gender differences in grading, I use data from students' achievements in the SIMCE test, as well as data from teachers' assessments, in the subjects of Spanish and math. The data contain unique school and class identifiers. In Chilean schools, a class is a group of students that take all the subjects together with exactly the same teachers, in a specific year and grade. This information allows me to aggregate the data to the class and school level.
The data on school grades are only available for a few years (2011–2018), whereas the SIMCE test is taken every year but has a specific grade schedule determined by the Ministry of Education. Therefore, the match between school grades and SIMCE test scores is feasible for 25 year-grade combinations (see ). The school grading scale is from 1 to 7, while the SIMCE test has a mean of 250 and a standard deviation of 50. Therefore, to make the tests comparable, school grades and SIMCE test scores are standardised to a distribution with zero mean and unit variance.
Table 1. Data available for both school grades and SIMCE test scores.
shows the results obtained from a mean-difference test of school grades (non-blind test) and SIMCE test scores (blind test) by gender, in Spanish and math. This comparison is quite revealing in several ways. First, there is a gender gap in both school grades and SIMCE test scores. In school grades, girls outscore boys in both subjects, but the difference is larger in Spanish. On the other hand, in the SIMCE test girls outperform boys in Spanish, while boys outperform girls in math. Furthermore, in absolute terms and for both tests, the gender gap is larger in Spanish and tends to increase as children get older. Second, Column 3 reports the difference between non-blind and blind scores. Girls tend to receive higher school grades compared to their SIMCE test score in both subjects, while the reverse is true for boys. Third, the last element of Column 3 presents the difference-in-difference estimator, which corresponds to the difference between the non-blind and blind scores for girls minus the same difference for boys. Thus a positive number indicates that the gender gap is in favour of girls; a negative number indicates that the gender gap is in favour of boys. The standard difference-in-differences estimation ranges between 0.08–0.18 standard deviations in Spanish and 0.08–0.22 standard deviations in math, meaning that the grading gap is against boys.
Table 2. Gender test score gap, by evaluation scheme.
I link the data on school grades and SIMCE test scores, to three datasets provided by the Ministry of Education. First, I use complete enrolment records of all students in Chile from 2008 onwards. These records include information on school characteristics (e.g. school type and total enrolment), individual school attendance, ethnicity, nationality, and whether the student passed or failed that school year. Second, I use SIMCE Complementary Survey, which are answered by students and parents. The first questionnaire registers students' beliefs and attitudes about studying and learning. From parents' surveys, it is possible to obtain information about students' socio-economic background, such as mother's and father's education and income (100,000 CLP). I complement this information with the SIMCE test scores in 4th grade. Finally, as a third source of information, I use data from teachers' administrative records to identify teachers of Spanish and math. This dataset also contains information on teacher gender, teaching experience and working conditions. More importantly, it allows to match students and their teachers in each subject, and to follow teachers over time, across classes and grades.
I restrict the analysis to students with valid school grades and SIMCE test scores in both subjects, and a complete set of information on characteristics. As a result, the sample comprised 2,821,911 students, 40,044 teachers, 111,074 classes and 5,126 schools.Footnote10 presents summary statistics. Panel (a) reports information at the student level. For each student, I observe sex, family background, indicators of ethnicity and foreign student, SIMCE test scores in grade 4, school attendance, grade retention, as well as students' opinion about their own attitude towards learning. School attendance corresponds to the average attendance over the previous 3 years. Grade retention is an indicator variable that takes value of 1 if the student failed in at least one of the previous three school years. Students were asked to indicate the extent of their agreement with the following statements: ‘I always do my homework’ and ‘I like to study’. Students report their opinions on the scale of ‘I fully agree’, ‘I agree’, ‘Disagree’ and ‘I entirely disagree’. Both answers are coded as dummy variables (i.e. 1=Do homework and 1=Like to study), taking value of one if the student answers ‘I fully agree’ or ‘I agree’, and zero otherwise. Panel (b) shows information at the teacher level, including sex, average years of experience, and working conditions. Information at class level is shown in Panel (c), which includes class size, average number of boys and average number of girls. Panel (d) presents information at school level, such as average enrolment over 2011–2018, school type (i.e. public, voucher or private), urban schools, geographical location, and number of classes within the school.Footnote11
Table 3. Descriptive statistics.
4. Measuring teacher bias in theory and practice
For each student i, we observe a school grade and a SIMCE test score
. The key difference between these two assessments is the nature of the scoring process. On the one hand, school exams are marked by the teacher, who observes the identity of the students, including their gender. Then, school exams can be considered as a non-blind evaluation (NB). On the other hand, the SIMCE test is anonymously graded by external examiners, and consequently, it is a blind evaluation (B).
Hence, a true measure of teacher bias would be a comparison between school grades and SIMCE test scores under the two marking schemes, that is to say, and
. However, it is not possible to observe
or
. An alternative is to use
and consider – as a measure of bias – the difference between school grades and the SIMCE test scores:
(henceforth referred to as
). Therefore, the reliability of this measure of bias depends on the extent to which the SIMCE test score is a counterfactual for the score that the student would have received in the school if the school grade was blind.
To motivate the gender differences in grading, I assume a simple model for how school grades and test scores are determined. I assume that the school grades are determined by the student ability
, the student effort
, a teacher-level component
(which may vary by student), and a random component
:Footnote12
(1)
(1) The teacher-level component is a measure of how easy it is for student i to obtain a grade by a given teacher j.
The standardised test scores are also a function of student ability
and student effort in the test
, and a different (independent) random component
; but does not depend on
(since it is not marked by the teacher):
(2)
(2) Thus the average difference between the school grades and the SIMCE test scores would capture the teacher-level component
, as well as the difference between the two functions
and
Footnote13:
(3)
(3) The measure of gender gap in grading would be given by the comparison of this difference for girls and boys, i.e.
(4)
(4) Equation (Equation4
(4)
(4) ) would be a reliable counterfactual measure of gender bias in grading only if
. More generally, it captures not only differences in teacher behaviour, captured by the term
, but also differences in
between girls and boys. For instance, school grades might measure different types of skills compared to the SIMCE test scores. This could be the case if school grades are based on homework, while the SIMCE test is a single test, and student performance in homework differs by gender. However, even if both functions are equal, there might be differences in the production inputs. A student might try harder at the school vis-à-vis the SIMCE test, because it comes with praise from the teacher, or a student might try less hard because effort to achieve school grades is more costly than effort to achieve the SIMCE test score.
The teacher-level component might be a function of the student's behaviour
. In particular, teachers' grading behaviour might be a reaction to student engagement in the classroom. Then, student engagement in the classroom would have two effects: first, it increases both the school grades and the SIMCE test score, even though the size of the effect might be different for each evaluation; and second, it might cause the teacher to increase their school grades, as a response to this behaviour. However, to observe a gender bias in grading, teachers should weight differently the student engagement depending on the gender of the student. Otherwise, there will be a bias, but it will be the same for girls and boys.
The framework described in this section helps understand the potential explanations identified in the literature behind the gender gap in grading. For instance, gender stereotypes and discrimination will be captured by the gender bias in grading: . In this case, teachers have preferences for students of a particular gender and express their preferences through grading. The statistical discrimination hypothesis could also be analysed by extending the model, allowing
to be a function of teachers' beliefs about the average performance of the student gender and the actual result on the school exam. As discussed earlier, teachers' grading behaviour might also be explained by their characteristics. In this case, the teacher-level component will be a function of the teacher characteristics
. In addition, it is possible to include student–teacher interactions
to allow the presence of in-group bias, that is, teachers discriminate in favour of their own group. On the other hand, gender differences in attitudes towards competition might impact student effort allocation across the tests (
and
), which in turn, will affect their performance on each test. Similarly, gender differences in behaviour could be captured by the effort component, which affects both school grades and SIMCE test scores. Altogether, this framework is able to account for all the potential explanations discussed in the literature. The next section presents the empirical methods and the estimation results, using Equation (Equation4
(4)
(4) ) as a definition of the gender gap in grading.
5. The gender gap in teacher grading
To estimate the gender difference in grading I use the following difference-in-differences model:
(5)
(5) where
is the score for student i under the scheme s, which can be blind (B) or non-blind (NB);
is a dummy for female student;
is equal to one if the test is non-blind and zero otherwise; and
is a vector of student characteristics that includes socio-economic background characteristics (mother's education, father's education, and household income), demographic characteristics (indicators of ethnicity and foreign student) and the grade 4 SIMCE test score. The coefficient α represents the gender gap in the blind test and constitutes the gender gap that is common for both types of tests; whereas β is informative of the grade inflation. The parameter of interest is γ. This coefficient measures the average gender difference in scores gap. Thus a positive (negative) value for γ can be interpreted as evidence of a grading gap against boys (girls). In addition, I include the interaction between the non-blind test and student characteristics
, to assess the case in which grading differences can also be affected by these characteristics. This specification has been used by many previous studies to measure gender gaps across evaluation schemes (e.g. Falch and Naper Citation2013; Lavy Citation2008; Lavy and Sand Citation2018; Terrier Citation2020).
Because the identification strategy is based on differences-in-differences at student level, the estimation of the parameter γ in Equation (Equation5(5)
(5) ) will not be affected by the inclusion of students' characteristics, class fixed effects or school fixed effects, as long as these effects are homogeneous across evaluation schemes (i.e.blind and non-blind tests).Footnote14 We can relax this assumption by including the interaction between these variables and the non-blind dummy.
The results of Equation (Equation5(5)
(5) ) are shown in . The gender grading gap (γ) is positive and significantly different from zero for all subjects (Spanish and math) and grades (4th grade, 6th grade, 8th grade and 10th grade), and ranges between 0.08 and 0.20 standard deviations. This means that boys get lower grades than girls when they are assessed by their teachers compared to their scores in the national exams. The results are consistent with the mean comparison across evaluation schemes presented in . The interaction between the non-blind test and the student characteristics also reveals interesting results. Students from more advantaged backgrounds (higher income and more educated parents) and with higher SIMCE test scores in 4th grade tend to receive lower school grades compared to SIMCE test score, while the opposite is observed for ethnic minority students and foreign students. However, these effects – with the exception of the SIMCE test score in 4th grade – are substantially smaller than the gender interaction term.
Table 4. Estimation of gender gap in grading.
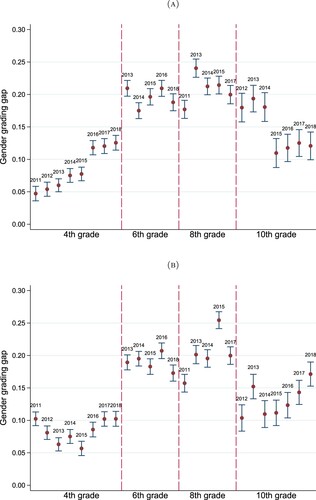
shows the value of γ for each year-grade combination for which information on school grades and SIMCE test scores is available (see ).Footnote15 As can be seen, it indicates that for all the combinations the gender gap in grading is against boys, and of the same order of magnitude than the pooled cross-sectional model. Interestingly, there is a clear pattern observable in the gender gap in grading: increasing through primary school (from 4th grade to 8th grade) and then decreasing in high school.
Figure 1. Gender gap in grading using different year-grade combinations: (a) Spanish and (b) Math.
Notes: These figures show the estimates of γ in Equation (Equation5(5)
(5) ) with 95% confidence interval for each year-grade combination.
Another dimension that is likely to be important is the ability of the student. Is the gender grading gap constant across the ability distribution? shows the relationship between the grading gap (i.e. non-blind minus blind test scores) and students' ability (measured by their grade 4 test scores) on the full sample. Conditional on ability – and for both subjects – the grading gap is larger for girls than boys, meaning that the gender grading gap is against boys. Additionally, in Spanish, this gap tends to widen when we move along the ability distribution. Those at the bottom of the ability distribution show smaller gender grading gaps than those at the top, whereas no clear changes are observed in math.Footnote16 The results in confirm the visual analysis.Footnote17
Figure 2. Gender gap in grading and students' ability: (a) Spanish and (b) Math.
Notes: These figures illustrate the relationship between the grading gap (non-blind minus blind test scores) and students' ability for female and male students. Students' ability corresponds to grade 4 SIMCE test scores. Lines are local polynomial smoothed curves of degree zero using an epanechnikov kernel function with shaded 95% confidence intervals.
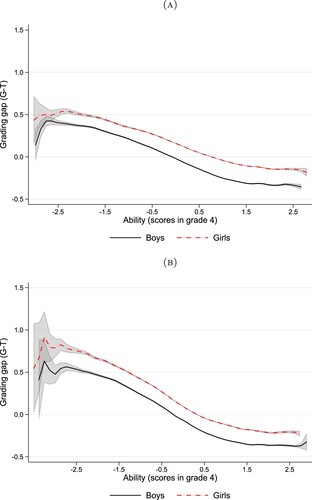
Table 5. Gender grading gap by student's ability.
As a robustness check, I consider the case in which schools are heterogeneous regarding to teachers' grading practices which might occur if, for example, teachers – with a certain grading behaviour – are not randomly assigned to schools with students of certain characteristics.Footnote18 To test whether this is the case, I follow Falch and Naper (Citation2013) and estimate a version of Equation (Equation5(5)
(5) ) that includes the interaction between school fixed effects and the non-blind dummy. Because each school decides the assignment of teachers to classes, I also estimate a version of Equation (Equation5
(5)
(5) ) that includes the interaction between class fixed effects and the non-blind dummy to account for heterogeneous grading at class level. This interaction controls for the potential effects of classroom (observed and unobserved) characteristics – for example in terms of ability or behaviour – on teachers' grading behaviour. In Table D1 (Appendix D), I report these estimates. Reassuringly, the gender grading gap is still positive and significant, and therefore runs against boys. This suggests that the gap is not a result of teacher sorting across schools or classrooms. Further checks are performed. The grading gap against boys is robust across school type (public, voucher and private), urban and rural schools, school size and geographical region (see Appendix E).
Overall, these results indicate that there is a gender gap in grading that runs against boys in both subjects. This finding is consistent with previous studies which have suggested that girls are graded more favourably than boys in all subjects. Despite this, the results differ from earlier studies, in at least three aspects. First, in math, the size of the effects differs from some of the earlier studies. The effects are more in line with the results of Casula and Liberto (Citation2017), whereas are considerably larger than Lavy (Citation2008) and Falch and Naper (Citation2013). In turn, the grading gap against boys in Spanish is considerably larger than the grading gap in native language documented by previous research. Second, and in contrast to previous studies, the magnitude of the grading gap against boys is similar for Spanish and math. Third, compared to most previous studies, the gender gap in grading is estimated more accurately.Footnote19 Among other results, it is shown that the gender gap in grading is consistently positive (against boys) across all year-grade combinations. In addition, the strong grade effect is suggestive that the gender gap is not only the result of teacher bias, but is also the result of student behaviour. Finally, the grading gap against boys is observed throughout the entire ability distribution.
Are these results indicative of teachers' gender bias in grading? As shown in the previous section, these results might also be capturing differences in the production functions (or inputs to the production functions) of the school grades vis-à-vis the SIMCE test scores for girls and boys. In other words, they might capture any unobserved factor both correlated with gender and with test type. For example, observed differences between blind and non-blind test scores could be explained by the gender effort gap in the classroom, which differs from the gender effort gap in the SIMCE test. The following section investigates the mechanisms behind the gender grading gap.
6. Mechanisms
The previous section has presented robust evidence of a grading gap against boys in teachers' assessments. The question remains as to which mechanisms can explain gender differences in grading. In this section, I explore the extent to which this gap relies on the behaviour of teachers or students.Footnote20
6.1. Does the gender grading gap capture teacher biases?
Throughout this section, I explore the extent to which teacher behaviour explains the grading gap against boys. To do this, I construct a dataset with information about the gender gap in grading at class-subject level, denoted by . The gender gap in grading at class-subject level is defined as the difference between girls' and boys' gap between the average non-blind score (school grades) and blind score (SIMCE test score):
(6)
(6) This value is computed for each class–subject combination. Each class
is observed once in each subject
. A class–subject combination has a specific teacher j, school k and year t. As a result, it is obtained a dataset of 222,148 observations, composed of 40,044 teachers, 5126 schools and 111,074 classes. On average, a teacher is observed in 5.5 different classes in the dataset (with a standard deviation of 3.4 times), whereas is observed in 1.6 different classes within the same school year (with a standard deviation of 0.8 times). The average number of classes per school is 21.7 (with a standard deviation of 18.7). The gender gap at class–subject level has the same interpretation as before: a positive (negative) value for
implies a grading gap in favour of girls (boys). Figure F1 (Appendix F) shows the distribution of the gender grading gap at classroom–subject level. In coherence with previous results, on average the gender gap in grading is 0.17 (with a standard deviation of 0.37), and therefore runs against boys.Footnote21
A particular feature of the data is that I can observe the same teacher in different classes. Then, are teachers' assessments always in favour of girls or boys? To characterise how teacher's grading changes in different classes, I compute the proportion of class–subject combinations in which a teacher exhibits a grading gap against boys (i.e. when is positive). Then, if the grading gap is a characteristic of the teacher, it should be observed that teachers are constantly biased in favour of girls or boys. This is not the case. About 23.4% of the teachers always present a grading gap against boys, whereas 2.7% of them always present a grading gap against girls. Accordingly, about one quarter of the teachers would exhibit a consistent bias.
Is teacher's grading gap stable? Following Lavy and Megalokonomou (Citation2019), I measure the persistence of teachers' grading behaviour by comparing the gender gap of class c taught by teacher j (), and the average gender gap over all the other classes taught by teacher j during 2011–2018, denoted by
. This average captures all the information available about teacher j's grading behaviour, with different groups of students and classes. Moreover, the out-of-sample approach eliminates any class-level unobserved variation in boys' and girls' behaviour, along with any gender gap in non-cognitive skills.
presents the correlation between the gender gap of class c taught by teacher j and its out-of-sample average, using a school fixed effects regression with subject, year and grade fixed effects and controlling for teacher characteristics. In Column (1), I use the out-of-sample average, whereas in Column (2) the independent variable is the average weighted by the number of students () to account for differences in classroom size. As a result, both measures produce a coefficient not statistically different from zero, meaning that teachers' grading behaviour is not persistent across classes.Footnote22
Table 6. Regression of teacher's grading gap across classes.
To further test whether the gender gap in grading corresponds to a characteristic of the teacher, I follow the methodology proposed by Lavy and Sand (Citation2018). They argue that if the measure of gender gap in grading is really capturing teachers' biased behaviour, it has to be the case that the correlation of the grading gap between subjects within the same class must be higher if both subjects are taught by the same teacher. In other words, under the hypothesis of gender gap in grading being an expression of the teacher's gender stereotypes, it is expected that a teacher persistently biases the same group of students, in both subjects.
shows the results of running a regression of the grading gap in math on the grading gap in Spanish, for the same class. Column (1) presents the coefficient estimate between the two subjects (first row), and its interaction with an indicator variable for having the same teacher in both subjects (second row). First, the results indicate that the grading gap is highly correlated across subjects (0.34 with a standard error of 0.003), even when the teachers are different. Second, the interaction coefficient is not statistically significant. Column (2) adds school fixed effects to account for school characteristics. No substantial changes are observed. The results suggest that the class is the most important element behind the gender gap in grading, and not the identity of the teachers.
Table 7. Regression of gender gap between subjects within the same class.
What explains the variation in the gender gap in grading? The grading gap might show a different pattern depending on the subject, in particular, the set of skills assessed could differ between Spanish and math. Similarly, the age of the students could also be relevant, since gender differences in motivation at school and attitudes towards learning widen as boys and girls grow and develop (Duckworth and Seligman Citation2006; Kenney-Benson et al. Citation2006; Salisbury, Rees, and Gorard Citation1999). Alternatively, as gender equality policies evolve, it is plausible to argue that the gender gap in grading may follow a particular trend over time. From an institutional point of view, it may respond to a school policy, for example, school directors may promote gender equality in the classrooms. Finally, the gender gap in grading could reflect a conscious or unconscious gender stereotype of the teacher. Then, to characterise how systematically the gender gap in grading changes due to these factors, I estimate the following regression model:
(7)
(7) where
is the gender gap in grading for the class c in the subject s;
is a dummy for math;
are grade fixed effects;
are year fixed effects;
are school fixed effects;
are teacher fixed effects; and
is a vector of teacher's characteristics, including gender, years of teaching experience, an indicator of permanent contract and working hours. It should be noted that teacher gender cannot be included with teacher fixed effects (
). The idea is to use this model to test the explanatory power of different specifications, adding in each step a different set of variables. reports the results of estimate Equation (Equation7
(7)
(7) ). Across all the specifications, math teachers present a larger grading gap against boys compare to Spanish teachers. In addition, the gender gap in grading shows a clear pattern: it increases with age until the 8th grade and then decreases until the 10th grade. On the other hand, no time trend is observed for the gender gap in grading over the years. Finally, there is very little systematic impact of the teachers' characteristics on the gender gap in grading.
Table 8. Stepwise regression: variation of gender grading gap.
shows the F-test of overall significance of the fixed effects and its p-value, and the adjusted . The first column exhibits the benchmark model which includes subject fixed effect (
), grade fixed effect (
), year fixed effects (
), and the vector of teacher characteristics (
). The adjusted
for this model is 2%. The second column adds school fixed effects to the benchmark model. Although the fixed effects are statistically significant, the adjusted
reaches only 6%. Therefore, by itself, schools do not explain a substantial part of the variation of the gender gap in grading. In the third column, teacher fixed effects are added to the benchmark specification. Again, the fixed effects are jointly significant, but the model fit is 10%. As a result, teacher biased behaviour is not persistent over time, in other words, not much of the variation is explained by the teacher identity. No further changes are observed when school and teacher fixed effects are simultaneously included (fourth column). However, when class fixed effects are included, the adjusted
jumps to 40%, besides being statistically significant.Footnote23 In other words, a group of children – a class – who have a particular gender grading gap in Spanish have a similar gender grading gap in math. This confirms the results in . Finally, no major differences are observed when teacher fixed effects and class fixed effects are jointly included (adjusted
increases to 45%).
Altogether, the results presented in this section suggest that teachers' grading behaviour is not fixed, i.e. the gender gap in grading does not substantively correlate with teachers' identity. In turn, it seems to be that the class characteristics – expressed in class fixed effects – are the key to understand the mechanism behind the gender gap in grading. These results allow us to discard two potential mechanisms: statistical discrimination and teacher characteristics; as both mechanisms are naturally linked to teachers' identity.
In terms of the theoretical motivation discussed in Section 4, the results support the idea that the comparison between school grades and SIMCE test scores is capturing differences in production functions of girls and boys, rather than actual teachers' gender biases. Nevertheless, in a more complicated setting, these results could still be driven by teacher biases that depend on student behaviour. In other words, these outcomes do not necessarily imply that teachers play no role in this respect. For example, the grading gap against boys could be explained by teachers rewarding girls' effort more than boys' effort. The next section, therefore, moves on to discuss how students' behaviour may explain the grading gap against boys in teachers' assessments.
6.2. The grading gap and the role of non-cognitive factors
As some authors point out, the grading gap against boys might be explained by the difference between the non-cognitive development of boys and girls. In particular, it is well known that boys tend to have more behavioural and attention problems. From a theoretical point of view, gender differences in behaviour might explain the gender gap either because they raise the student's achievement on school grades more than on SIMCE test
, or because they cause the teacher to be more positively biased
.
To measure student behaviour, I use survey data containing students' perception about their own school effort. There are two survey responses of interest. Students were asked to indicate the extent of their agreement with the following statements: ‘I always do my homework’ and ‘I like to study’. The first is considered a measure of student effort, whereas the second a measure of positive attitude towards learning.Footnote24 Furthermore, two additional measures of school effort are added: grade retention and school attendance. Grade retention reflects the past academic performance and can be considered as a mix of direct measure of ability and school effort. On the other hand, the school attendance rate is a direct measure of school effort in the previous years.
displays descriptive statistics for each of these variables by gender. From this data, it can be seen that female students present higher levels of effort and positive attitude towards learning, and less grade retention. In contrast, no substantial differences in school attendance are observed. It is worth noting that the behaviour gender gap, in terms of effort and positive attitude, tends to get wider as children get older. Then it is possible to hypothesize that part of the dynamics of the gender grading gap – which increases between grade 4 and grade 8 – can be attributed to differences in behaviour.
Table 9. Gender gap in behaviour.
To test the impact of student behaviour on the grading gap, I include these four behavioural variables (Do homework, Like to study, Grade retention, and School attendance) along with their interactions with gender and non-blind test in Equation (Equation5(5)
(5) ). shows the results. Column (1) displays the baseline regression based on Equation (Equation5
(5)
(5) ). Once again, the grading gap is against boys in Spanish and math.
Table 10. Effects of student behaviour on gender grading gaps.
Column (2) reports the effects of these variables and their interaction with the type of test. This model allows the coefficients to vary with the type of test. In the light of the theoretical model presented in Section 4, this could be caused by two alternative mechanisms, which in principle are not mutually exclusive. On the one hand, it would capture differences in the production function, that is to say, same effort inputs would be more valuable in one test than the other:
. On the other hand, it could be capturing teachers rewarding effort inputs:
with
.
The results show different effects according to the type of test. In particular, the effects of the behavioural variables are larger for the school tests than the SIMCE test. Also, they show that part of the grading gap against boys is explained by the differences in the behaviour by gender. The inclusion of these variables reduces the gender gap in grading by around 20%. However, the baseline grading gap is still positive (or against boys) and statistically significant. These results differ from Cornwell, Mustard, and Parys (Citation2013), who show that gender differences between external test scores and teachers' assessments vanish when behavioural variables are considered.
Column (3) presents estimates adding a triple interaction between behavioural variables, the non-blind test dummy, and the female dummy. A positive coefficient implies a higher premium in the non-blind test (school grades) for female students who exert effort. The most remarkable result to emerge from this model is that grading gap against boys completely disappears for both subjects. The results suggest that the premium due to good behaviour is gender-dependent and runs in favour of girls.
In terms of the theoretical model, this implies that . This might be explained by two reasons, which are not mutually exclusive. First, it could reflect effort inputs being more valuable for girls than boys. It could also be argued that this effect is due to effort inputs variables being subject to measurement error, that potentially can be different by gender. Since some of the variables of effort are based on students' perceptions, these results might be explained by the fact that male students develop a mistaken perception of their own behaviour and overestimate their effort.
Second, it could just express teachers' biased behaviour in favour of girls who show a specific behaviour, in other words: . Why this may be the case? It might be related to how effective are the male students in showing or demonstrating their good behaviour to the teacher compared to their female classmates. This explanation is grounded in several studies in psychology (see, e.g., Salisbury, Rees, and Gorard Citation1999) that posit that for male students it could not be socially acceptable to be seen interested in school work, because this attitude is in conflict with the society's notions of masculinity. An alternative explanation is related to teachers' expectations of male and female behaviours, either based on gender role attitudes or stereotypes. Teachers may expect students to behave in a certain manner according to specific behavioural patterns and ignore any behavioural change which diverges from this path. This phenomenon is referred to as sustaining expectation effect (Cooper and Good Citation1983). Then if teachers believe that girls present better attitudes to learning or work harder than boys, under the hypothesis of sustaining expectation effect teachers may dismiss or ignore any boys' behaviour opposite to this original belief.
A leading concern is that the behaviour of the students and teachers' grading might be jointly determined, and therefore the estimates in are biased. To address the problem of simultaneity bias – caused by student's behaviour and teacher's grading influence one another – I use lagged values for behavioural variables (i.e. Do homework and Like to study). Table I1 (Appendix I) shows that the key findings are robust to these changes.Footnote25
Overall, the findings in this section indicate that the gender gap in grading could be attributed to students' behaviour, particularly in relation to their academic effort and attitude toward learning. Female students present higher (more positive) values for behavioural variables than male students. It is important to bear in mind that this result may be explained either by effort inputs being more valuable for girls than boys or by teachers' biased behaviour in rewarding that effort.
7. Conclusion
Using a precise and comprehensive student-level data on school grades and SIMCE test scores, I find that boys tend to receive lower school grades than girls compared to their SIMCE test scores. Therefore, and in line with the previous literature, there is a gender gap in grading against boys. The grading gap against boys remains unchanged by school type, rural/urban schools, school size, geographical location, and student ability.
Gender grading gaps have been used by many researchers as a measure of teachers' biased behaviour. This paper questions the validity of this measure. I show that deviations between non-blind and blind tests might be capturing differences in the tests' production functions for girls and boys, rather than actual teachers' gender biases. I provide evidence that teachers' grading behaviour is not persistent across classes, and that most of the variation of the gender bias at class–subject level is driven by the characteristics of the class, and not from the teachers' identity. Taken together, these results challenge the idea that teachers grading bias is a fixed characteristic of the teachers. Nevertheless, these results are perfectly compatible with a model which allows teacher's grading to vary with student's behaviour.
By exploiting rich survey information and administrative data on students' school effort, I provide evidence on the mechanisms that could explain the grading gap against boys. I show that part of the gender grading gap is due to differential effort – i.e. girls exert more effort than boys – and part is due to girls being rewarded more for a given amount of effort – i.e. even if boys put in the same effort as girls, they would not get the same school grade. This could be explained either by teachers rewarding differently students' behaviour based on their gender or by female students being more effective in transforming this behaviour into higher school grades.
Another interesting finding is that the gender grading gap widens throughout primary school years and decreases in secondary school. I present some evidence that gender differences in school effort and attitudes towards learning increase with age. It is possible, therefore, that student behaviour could also be behind the grade effect in the gender grading gap. However, this evidence is far from conclusive and further research is needed to understand the dynamics of the gender grading gap. In the same vein, an important question for future research is whether this result can be verified in a different educational setting.
Grading gaps between teachers' assessments and national examinations have important effects on students' academic achievement for at least two reasons. First, the process of grading plays a crucial role in giving information and feedback to students about their work and performance. Therefore, school grades constitute a powerful channel to transmit information about student ability, allowing students to determine their optimal allocation of effort. Second, in Chile – as in many other countries – school grades are part of the criteria for admission to higher education institutions. Then, gender gaps in grading have a direct impact on student's probability of admission. Overall, this paper shows that gender differences in behavioural skills and personal attitudes towards learning play a significant role in shaping the gender gaps in grading. This encourages the design of policies aimed at improving boys' non-cognitive skills, and thus closing the gender gaps presented in this paper.
Supplemental Material
Download PDF (372.4 KB)Acknowledgments
I gratefully acknowledge financial support from the ESRC through the Research Centre on Micro-Social Change (ES/S012486/1). For discussions and comments, I am grateful to Richard Upward, Facundo Albornoz, Gianni De Fraja, Abhijeet Singh, Pamela Searle, Miguel Urquiola, Ingo Outes, and Pilar Beneito; and seminar participants at PhD Conference, University of Nottingham. I am indebted to the anonymous reviewers for providing insightful comments and directions for additional work which has resulted in this paper. I also thank the Ministry of Education (MINEDUC) of the government of Chile for giving me access to the administrative data I use in this paper.
Disclosure statement
No potential conflict of interest was reported by the author(s).
Notes
1 The differences between blind and non-blind assessments have been extensively used by the discrimination literature, see for example Goldin and Rouse (Citation2000) and Blank (Citation1991). Also, this strategy has been exploited to examine differences in teachers' assessments across ethnic groups (Burgess and Greaves Citation2013) and racial groups (Botelho, Madeira, and Rangel Citation2015).
2 An exception is Hinnerich, Höglin, and Johannesson (Citation2011). They detect no evidence of grading bias by gender in the case of Sweden. However, they only test the difference between blind and non-blind test scores for one subject (Swedish). See Protivínský and Münich (Citation2018) for a fuller overview of the literature on gender grading gaps.
3 There are only two exceptions, Falch and Naper (Citation2013) and Casula and Liberto (Citation2017).
4 Previous research has established the role of student–teacher interactions on different educational outcomes. In particular, they can have an important influence on gender differences (Dee Citation2005; Sadker and Sadker Citation1994). For example, research has highlighted that girls may benefit from being assigned to female teachers (Bettinger and Long Citation2005; Hoffmann and Oreopoulos Citation2009).
5 For example, in math, only male teachers exhibit a bias against boys, whereas no gender difference in grading is observed in the case of female teachers. In English, the effect is reversed.
6 In other words, if a teacher dislikes students – because of their gender – she will perceive them to have a ‘bad behaviour’ and will also give them low grades. If so, controlling for teacher's perception will be capturing the bias and the grading effect will disappear. In addition, as mentioned by Protivínský and Münich (Citation2018), their evidence is based on younger children, and therefore does not explore the role of students' behaviour in teachers' grading at older ages.
7 For a detailed description of the Chilean school system, see Santiago et al. (Citation2017).
8 The minimum passing grade is 4.0 on average. There are other causes of repeating the year, the most prevalent is scoring below 4.0, on two or more subjects. Students who have two subjects below 4.0 can be promoted to the next year, as long as their average across all subjects is greater or equal to 5.0. Students in 1st and 2nd years in primary school are automatically promoted to the next year, as long as they meet a minimum attendance rate of 85%.
9 Initially, students took the SIMCE test in 4th, 8th and 10th grades, although the test has expanded over the years so that students take it more frequently. Since 2012 tests also cover 2nd (only in Spanish) and 6th grades. However, in 2016 a reform was carried out in the schedule of the SIMCE test, which resulted in a reduction in the number of census-based assessments. As of 2016, the SIMCE test will be held each year for 4th and 10th grade students, while every second year, in alternate years, 6th and 8th grade students will be evaluated.
10 Table A1 (Appendix A) reports a mean comparison test of observable characteristics for the students who have valid school grades and the estimation sample. The estimation sample has students with a better average school performance (higher school grades and less grade retention), and also higher attendance. Although the differences between the two samples are, in general, statistically significant, they are not economically important.
11 Chile is administratively divided into 15 regions, including the Santiago Metropolitan Region where the national capital Santiago is located.
12 In other words, is an unbiased measure of the grade received by the student i, and the component
is a measure of how strict (or lenient) is the teacher with respect to grading.
13 Equation (Equation3(3)
(3) ) does not account for other factors that might affect
and
, such as teacher quality, parental motivation or teachers' expectations. These factors will not affect the gap between the tests as long as they affect scores equally for
and
. I also assume that the functions that characterise school grades (Equation (Equation1
(1)
(1) )) and SIMCE test scores (Equation (Equation2
(2)
(2) )) do not depend on the age (grade) of the student.
14 For the same reason, they will also have no impact on the grading inflation coefficient β.
15 Appendix B reports the value of γ for each year-grade combination.
16 The same conclusions hold for all the grade-subject combinations. See Appendix C.
17 In Table C1 (Appendix C), I explore whether the differences between low and high ability students – presented in – are statistically significant. To test this, I estimate a modified version of Equation (Equation5(5)
(5) ), which includes the interaction of the gender gap
with a dummy for high-ability student. This interaction corresponds to the additional gender grading gap on high-ability students, whereas the gender grading gap coefficient (i.e.
) corresponds to the effect on low-ability students. The results confirm the visual analysis: the gender grading gap is larger for high-ability students vis-à-vis low-ability students. This is particularly relevant for Spanish. The differences in math are much more smaller.
18 Previous research has established the existence of positive sorting between teachers and schools in Chile based on the socio-economic status and academic performance of their students: schools with the best working conditions attract higher-performing students and better teachers (e.g. Canales and Maldonado Citation2018; Correa, Parro, and Reyes Citation2015; Hsieh and Urquiola Citation2006; Mizala and Torche Citation2012; Toledo and Valenzuela Citation2015).
19 An exception is Casula and Liberto (Citation2017) estimations, which yield similar standard errors for their coefficients.
20 Specific features of the SIMCE test allow us to rule out potential channels. First, because the SIMCE test has no direct consequences for individual students' future prospects – and therefore it is a low-stakes test – it seems implausible that the gender grading gap is explained by a more competitive environment. In addition, both school exams and SIMCE tests take place in the same environment. This arguably rules out the possibility that the SIMCE test might cause higher levels of anxiety in students compared to the school tests. Second, because the time lag between blind and non-blind tests is relatively small, we can rule out time trends in learning, which in principle could be different for male and female students.
21 It is worth noting that there are classes where the gender gap in grading is negative, and therefore runs against girls. The gender grading gap at class-subject level mimics the results of the previous section, showing a clear pattern: increasing up to 8th grade and decreasing in the transition to 10th grade. The gender grading gap is larger in math, public schools, rural schools, and schools outside the Santiago Metropolitan Region (see Table F1 in Appendix F).
22 In Table G1 (Appendix G), I examine the robustness of this finding to the inclusion of class characteristics. Its inclusion does not change the results.
23 It should be noted that class fixed effects saturate the effects at grade () and year (
) level.
24 31% of the students in the estimation sample have this information. Table H1 (Appendix H) reports a mean comparison test of student, teacher and school characteristics for the estimation sample and the restricted sample. Although the differences between the two samples are, in general, statistically significant, they are not economically relevant.
25 Table I2 (Appendix I) reports the results using a 4-point scale to measure students' behaviour (i.e. Do homework and Like to study), where 1 denotes ‘I entirely disagree’ and 4 denotes ‘I fully agree’. The results are consistent with those presented in .
References
- Arrow, K. 1973. “The Theory of Discrimination.” In O. Ashenfelter & A. Rees (Eds.), Discrimination in Labor Markets (pp. 3–33). Princeton, NJ: Princeton University Press.
- Azmat, G., C. Calsamiglia, and N. Iriberri. 2016. “Gender Differences in Response to Big Stakes.” Journal of the European Economic Association 14 (6): 1372–1400. https://doi.org/10.1111/jeea.2016.14.issue-6.
- Bertrand, M., and J. Pan. 2013. “The Trouble with Boys: Social Influences and the Gender Gap in Disruptive Behavior.” American Economic Journal: Applied Economics 5 (1): 32–64.
- Bettinger, E. P., and B. T. Long. 2005. “Do Faculty Serve as Role Models? The Impact of Instructor Gender on Female Students.” American Economic Review 95 (2): 152–157. https://doi.org/10.1257/000282805774670149.
- Blank, R. 1991. “The Effects of Double-Blind Versus Single-Blind Reviewing: Experimental Evidence from the American Economic Review.” American Economic Review 81 (5): 1041–1067.
- Bonesrønning, H. 2008. “The Effect of Grading Practices on Gender Differences in Academic Performance.” Bulletin of Economic Research60 (3): 245–264. https://doi.org/10.1111/j.1467-8586.2008.00278.x.
- Botelho, F., R. A. Madeira, and M. A. Rangel. 2015. “Racial Discrimination in Grading: Evidence from Brazil.” American Economic Journal: Applied Economics 7 (4): 37–52.
- Brookhart, S. M., T. R. Guskey, A. J. Bowers, J. H. McMillan, J. K. Smith, L. F. Smith, M. T. Stevens, and M. E. Welsh. 2016. “A Century of Grading Research: Meaning and Value in the Most Common Educational Measure.” Review of Educational Research 86 (4): 803–848. https://doi.org/10.3102/0034654316672069.
- Burgess, S., and E. Greaves. 2013. “Test Scores, Subjective Assessment, and Stereotyping of Ethnic Minorities.” Journal of Labor Economics 31 (3): 535–576. https://doi.org/10.1086/669340.
- Canales, A., and L. Maldonado. 2018. “Teacher Quality and Student Achievement in Chile: Linking Teachers' Contribution and Observable Characteristics.” International Journal of Educational Development 60:33–50. https://doi.org/10.1016/j.ijedudev.2017.09.009.
- Casula, L., and A. D. Liberto. 2017. “Teacher Assessments Versus Standardized Tests: Is Acting ‘Girly’ an Advantage?.” Working Paper CRENoS 201701, Centre for North South Economic Research, University of Cagliari and Sassari, Sardinia.
- Ceci, S. J., D. K. Ginther, S. Kahn, and W. M. Williams. 2014. “Women in Academic Science: A Changing Landscape.” Psychological Science in the Public Interest 15 (3): 75–141. https://doi.org/10.1177/1529100614541236.
- Cooper, H., and T. Good. 1983. Pygmalion Grows Up: Studies in the Expectation Communication Process. New York: Longman.
- Cornwell, C., D. B. Mustard, and J. V. Parys. 2013. “Non-Cognitive Skills and the Gender Disparities in Test Scores and Teacher Assessments: Evidence from Primary School.” Journal of Human Resources48 (1): 236–264. https://doi.org/10.1353/jhr.2013.0002.
- Correa, J. A., F. Parro, and L. Reyes. 2015. “Self-Selection in the Market of Teachers.” Applied Economics47 (13): 1331–1349. https://doi.org/10.1080/00036846.2014.995365.
- Dee, T. 2005. “A Teacher Like Me: Does Race, Ethnicity, or Gender Matter?.” The American Economic Review 95 (2): 158–165. https://doi.org/10.1257/000282805774670446.
- Duckworth, A., and M. Seligman. 2006. “Self-Discipline Gives Girls the Edge: Gender in Self-Discipline, Grades, and Achievement Test Scores.” Journal of Educational Psychology 98:198–208. https://doi.org/10.1037/0022-0663.98.1.198.
- Falch, T., and L. R. Naper. 2013. “Educational Evaluation Schemes and Gender Gaps in Student Achievement.” Economics of Education Review 36:12–25. https://doi.org/10.1016/j.econedurev.2013.05.002.
- Figlio, D. N., and M. E. Lucas. 2004. “Do High Grading Standards Affect Student Performance?.” Journal of Public Economics 88 (9–10): 1815–1834. https://doi.org/10.1016/S0047-2727(03)00039-2.
- Gneezy, U., M. Niederle, and A. Rustichini. 2003. “Performance in Competitive Environments: Gender Differences.” Quarterly Journal of Economics 118 (3): 1049–1074. https://doi.org/10.1162/00335530360698496.
- Gneezy, U., and A. Rustichini. 2004. “Gender and Competition at a Young Age.” American Economic Review 94 (2): 377–381. https://doi.org/10.1257/0002828041301821.
- Goldin, C., and C. Rouse. 2000. “Orchestrating Impartiality: The Impact of Blind Auditions on Female Musicians.” American Economic Review 90 (4): 715–741. https://doi.org/10.1257/aer.90.4.715.
- Hinnerich, B. T., E. Höglin, and M. Johannesson. 2011. “Are Boys Discriminated in Swedish High Schools?.” Economics of Education Review 30 (4): 682–690. https://doi.org/10.1016/j.econedurev.2011.02.007.
- Hoffmann, F., and P. Oreopoulos. 2009. “A Professor Like Me, the Influence of Instructor Gender on College Achievement.” Journal of Human Resources 44 (2): 479–494. https://doi.org/10.1353/jhr.2009.0024.
- Hsieh, C.-T., and M. Urquiola. 2006. “The Effects of Generalized School Choice on Achievement and Stratification: Evidence from Chile's Voucher Program.” Journal of Public Economics 90 (8): 1477–1503. https://doi.org/10.1016/j.jpubeco.2005.11.002.
- Kenney-Benson, G., E. Pomerantz, A. Ryan, and H. Patrick. 2006. “Sex Differences in Math Performance: The Role of Children's Approach to Schoolwork.” Developmental Psychology 42 (1): 11–26. https://doi.org/10.1037/0012-1649.42.1.11.
- Lavy, V. 2008. “Do Gender Stereotypes Reduce Girls' or Boys' Human Capital Outcomes? Evidence from a Natural Experiment.” Journal of Public Economics 92 (10-11): 2083–2105. https://doi.org/10.1016/j.jpubeco.2008.02.009.
- Lavy, V., and R. Megalokonomou. 2019. “Persistency in Teachers' Grading Bias and Effects on Long-Term Outcomes: University Admissions Exams and Choice of Field of Study.” Working Paper 26021, National Bureau of Economic Research.
- Lavy, V., and E. Sand. 2018. “On the Origins of Gender Gaps in Human Capital: Short- and Long-Term Consequences of Teachers' Biases.” Journal of Public Economics 67:263–279. https://doi.org/10.1016/j.jpubeco.2018.09.007.
- Matthews, J., C. Cameron, and F. Morrison. 2009. “Early Gender Differences in Self-Regulation and Academic Achievement.” Journal of Educational Psychology 101 (3): 689–704. https://doi.org/10.1037/a0014240.
- Mechtenberg, L. 2009. “Cheap Talk in the Classroom: How Biased Grading at School Explains Gender Differences in Achievements, Career Choices and Wages.” Review of Economic Studies 76 (4): 1431–1459. https://doi.org/10.1111/roes.2009.76.issue-4.
- Mizala, A., and F. Torche. 2012. “Bringing the Schools Back in: The Stratification of Educational Achievement in the Chilean Voucher System.” International Journal of Educational Development 32 (1): 132–144. https://doi.org/10.1016/j.ijedudev.2010.09.004.
- Niederle, M., and L. Vesterlund. 2007. “Do Women Shy Away from Competition? Do Men Compete Too Much?.” Quarterly Journal of Economics 122 (3): 1067–1101. https://doi.org/10.1162/qjec.122.3.1067.
- Phelps, E. S. 1972. “The Statistical Theory of Racism and Sexism.” American Economic Review 62 (4): 659–661.
- Protivínský, T., and D. Münich. 2018. “Gender Bias in Teachers' Grading: What Is in the Grade.” Studies in Educational Evaluation 59:141–149. https://doi.org/10.1016/j.stueduc.2018.07.006.
- Ready, D. D., L. F. LoGerfo, D. T. Burkam, and V. E. Lee. 2005. “Explaining Girls' Advantage in Kindergarten Literacy Learning: Do Classroom Behaviors Make a Difference?.” Elementary School Journal 106 (1): 21–38. https://doi.org/10.1086/496905.
- Sadker, M., and D. Sadker. 1994. Failing At Fairness: How Our Schools Cheat Girls. New York: Touchstone.
- Salisbury, J., G. Rees, and S. Gorard. 1999. “Accounting for the Differential Attainment of Boys and Girls at School.” School Leadership and Management 19 (4): 403–426. https://doi.org/10.1080/13632439968943.
- Santiago, P., A. Fiszbein, S. G. Jaramillo, and T. Radinger. 2017. OECD Reviews of School Resources: Chile 2017. Paris: OECD Publishing.
- Shurchkov, O. 2012. “Under Pressure: Gender Differences in Output Quality and Quantity Under Competition and Time Constraints.” Journal of the European Economic Association 10 (5): 1189–1213. https://doi.org/10.1111/jeea.2012.10.issue-5.
- Terrier, C. 2020. “Boys Lag Behind: How Teachers' Gender Biases Affect Student Achievement.” Economics of Education Review 77:Article ID 101981. https://doi.org/10.1016/j.econedurev.2020.101981.
- Tiedemann, J. 2000. “Gender Related Beliefs of Teachers in Elementary School Mathematics.” Educational Studies in Mathematics 41 (2): 191–207. https://doi.org/10.1023/A:1003953801526.
- Toledo, G., and J. P. Valenzuela. 2015. “Over-estimating the Effects of Teacher Attributes on School Performance in the Chilean Education System.” Estudios de Economia 42:99–128. https://doi.org/10.4067/S0718-52862015000100005.