
 ?Mathematical formulae have been encoded as MathML and are displayed in this HTML version using MathJax in order to improve their display. Uncheck the box to turn MathJax off. This feature requires Javascript. Click on a formula to zoom.
ABSTRACT
This study uses a randomized vignette experiment to explore the impact of classroom composition on students’ teacher-perceived school performance. It hypothesizes that in classrooms with a high share of disadvantaged students, teachers rate the school performance of both disadvantaged and non-disadvantaged students lower than in classrooms with a low share of disadvantaged students. The experimental design disentangles two mechanisms behind compositional effects: ethnicity and social-status. Findings indicate the more disadvantaged perceptions of Roma and non-Roma students in classrooms with a high (rather than a low) share of Roma students. No similar findings were found concerning the share of poor students.
1. Introduction
Perceptions drive stereotypes, and stereotypes can influence perceptions. Stereotypes—perceptions of individuals based on group belonging (Fiske, Citation1998; McCauley et al., Citation1980; Hinton, Citation2017)—speed up information processing. People often rely on stereotypes about a particular social group to judge strangers who belong to that group group (Guryan & Charles, Citation2013; Macrae & Bodenhausen, Citation2000). Stereotypes can reflect accurate perceptions of real group differences, but they can also be biased and unrelated to actual group differences (Hilton and von Hippel Citation1996; Riegle-Crumb and Humphries Citation2012).
Research in teachers’ perceptions of students has shown that teachers’ grading practices and track recommendations are biased against low-status and minority students: teachers assign lower grades to minority students (Sprietsma Citation2013) and low-status students (Hanna and Linden Citation2012), even if their academic achievements are similar to their non-minority and high-status peers. Randomized experiments have also demonstrated that teachers recommend the vocational secondary track over the academic secondary track more often to minority students, even when these students have the same academic achievement as their non-minority peers (Van Ewijk Citation2011; Wenz and Hoenig Citation2020).
Previous research has examined variations in teachers’ perceptions of students’ academic performance based on factors, such as students’ actual performance (Oates Citation2003), gender (Bonefeld, Kleen, and Glock Citation2022), socioeconomic status, and personality attributes (Rubie-Davies Citation2010). Teachers tend to rate students from low socioeconomic backgrounds as less intelligent than their classmates with high socioeconomic backgrounds (Alvidrez and Weinstein Citation1999). Furthermore, teachers held elevated expectations for students they perceived as possessing self-confidence and positive work habits. (Timmermans, de Boer, and van der Werf Citation2016).
Classroom composition may also influence teachers’ perceptions of students’ school performance (Glock, Kovacs, and Cate Citation2019; McKown and Weinstein Citation2008). As recent network research has highlighted, categorization processes lead to the attribution of similar attitudes to individuals who are connected. Thus, social ties (like being classmates) provide informational cues regarding underlying qualitative similarities (Halgin, Borgatti, and Huang Citation2020) that may lead to a similar perception of those who share the same classroom context.
For various reasons, a high share of disadvantaged students might suggest a low overall classroom quality to teachers. If teachers have substantial experience that students in the classroom context with a high share of disadvantaged students tend to perform worse on average than students in a classroom context with a low share of disadvantaged students, this experience might be reflected in their perceptions. Furthermore, if teachers hold biased perceptions of disadvantaged students, they might extend these toward other students who share the same classroom context with disadvantaged students. The share of disadvantaged students may reinforce this tendency.
This paper addresses how classroom composition affects teachers’ perceptions of students’ school performance (hereafter referred to as compositional effects) and makes two specific contributions. First, the paper introduces a distinction between direct and indirect compositional effects by examining how classroom composition (the share of disadvantaged students in the classroom) affects teachers’ perceptions of disadvantaged students (direct compositional effect) and non-disadvantaged students (indirect compositional effect). Second, the paper disentangles two mechanisms that can drive compositional effects and differentiates between social-status- and ethnicity-based compositional effects. By doing so, the paper focuses on one of the most disadvantaged ethnic minority groups in Central and Eastern Europe, the Roma,Footnote1 and builds on the fact that, in Hungarian schools, the high share of Roma students is intertwined with the high share of poor students.
A vignette experiment was conducted involving primary school teachers (N = 562) in a large number of Hungarian primary schools (N = 332, approximately 10% of all primary schools). It was hypothesized that in a classroom where the share of disadvantaged students (Roma/poor) is high, teachers would perceive students’ school performance to be lower than in a classroom where the share of disadvantaged students is lowFootnote2.
The findings indicate that in classrooms with a high share of Roma students, teachers rated the school performance of both Roma and non-Roma students lower than in classrooms where the share of Roma students was low, indicating ethnicity-based direct compositional effects (targeting Roma students) and indirect compositional effects (targeting non-Roma students). This is consistent with the hypothesis. However, teachers’ perceptions of poor and non-poor students’ school performance did not differ between classrooms with a high share of economically disadvantaged (poor) students and classrooms with a low share of economically disadvantaged (poor) students. Therefore, contrary to the hypothesis, the results do not support social-status-based direct compositional effects (targeting poor students) and indirect compositional effects (targeting non-poor students). When comparing the ethnicity-based (Roma) and social-status-based (poor) compositional effects, statistically significant differences were observed in the indirect (but not direct) compositional effects. This suggests that the indirect compositional effects are mostly driven by Roma ethnicity rather than by the correlated economic disadvantage.
The identification of lower perceptions of non-Roma students in classrooms with a high share of Roma students is a novel finding which may not have been established in previous studies. As teachers’ perceptions influence their stereotypes (and vice versa), the findings may suggest the emergence of stereotypes (and potentially even discrimination) against non-Roma students in classrooms with a high share of Roma students. For instance, non-Roma students in schools with a high share of Roma students might receive lower grades, have less favorable school recommendations, and have a reduced likelihood of admission to higher-quality schools. In sum, the lower perceived performance of non-Roma students in classrooms with a high share of Roma students is an important topic for future research, especially as uncovering teachers’ stereotypes may be an effective intervention to reduce discrimination (Alesina et al. Citation2018).
This paper distinguishes itself from previous experimental research on teachers’ perceptions of students’ school performance in several ways. It utilizes a larger sample of 562 teachers; previous studies typically have used smaller samples, ranging from around 40 teachers (Costa, Pirchio, and Glock Citation2022; Glock and Krolak-Schwerdt Citation2013) to 200 teachers (Study 2 in Glock, Kovacs, and Cate Citation2019). Moreover, the sample analyzed in this paper was recruited nationwide, with invitations sent to all Hungarian primary schools; previous studies have recruited teachers through personal contacts (Bonefeld, Kleen, and Glock Citation2022; Costa, Pirchio, and Glock Citation2022; Glock and Krolak-Schwerdt Citation2013; Glock, Kovacs, and Cate Citation2019). Lastly, this paper examines teachers' perceptions of Roma minority students in Hungary, in contrast to previous studies that have examined teachers' perceptions of students with immigrant backgrounds, such as Turkish students in Germany (Bonefeld, Kleen, and Glock Citation2022; Glock and Krolak-Schwerdt Citation2013; Glock, Kovacs, and Cate Citation2019) or Arab students in Italy (Costa, Pirchio, and Glock Citation2022).
2. Previous literature on teacher perceptions of students’ performance
This section provides a literature review, identifying four limitations in prior studies that will be subsequently addressed in the current study. First, previous studies have primarily focused on examining the accuracy of teachers’ perceptions of students’ performance (Hoge and Coladarci Citation1989). Studies have typically involved teachers who already had pre-existing contact with the students they were rating (Alvidrez and Weinstein Citation1999; Oates Citation2003; Timmermans et al. Citation2018). Some studies have indicated that teachers’ perceptions of achievement gaps among students may align with the actual performance gap (Ferguson Citation2003; Jussim and Harber Citation2005)Footnote3. However, teachers’ initial perceptions about the students they know in person could influence the observed differences in students’ performance, making teachers’ perceptions endogenous. Therefore, new research should investigate teachers’ perceptions of hypothetical students’ performance to ensure that teachers’ pre-existing knowledge about specific students does not influence their perceptions.
Second, only a few studies have investigated the influence of compositional effects on teachers’ perceptions of students (Glock, Kovacs, and Cate Citation2019; McKown and Weinstein Citation2008). These studies support the idea that composition-specific information—particularly the classroom’s ethnic composition—can affect teachers’ perceptions. For instance, McKown and Weinstein (Citation2008) found that in classrooms with high ethnic diversity, the ethnic gap in teachers’ expectations for student achievement was larger than in classrooms with low ethnic diversity. Moreover, Glock, Kovacs, and Cate (Citation2019) found that German teachers who read a vignette describing an ethnically mixed classroom context exhibited more negative implicit attitudes (assessed by an Implicit Association Test) toward Turkish minority students than teachers who received a vignette describing an ethnically homogeneous classroom. The limited number of papers focusing on the compositional effects in students’ teacher-perceived school performance calls for more research.
Third, even in experimental research, it can be challenging to disentangle the differences in teachers’ perceptions attributed to students’ ethnicity and those attributed to students’ social status (Janky et al. Citation2014). Considering the frequent correspondence between students’ ethnicity and social status, it remains uncertain whether the ethnic differences observed in teachers’ perceptions are attributable to students’ ethnicity or to their associated social status. Therefore, new research should disentangle ethnicity and social status as drivers of teachers’ perceptions.
Fourth, previous research on compositional effects has overlooked the potential existence of indirect compositional effects. While the share of disadvantaged students can directly impact the perception of disadvantaged students (direct composition-specific effect), it may also have an indirect effect on non-disadvantaged students (indirect composition-specific effect). This calls for new research aimed at providing a more comprehensive understanding of indirect compositional effects.
3. Institutional background
This section provides institutional background information in three areas: primary education (1), the Roma ethnic minority (2), and schools’ ethnic composition in Hungary (3).
3.1. Primary education in Hungary
Hungarian primary education offers untracked, undivided education, encompassing general and lower-secondary education (ISCED 1 and ISCED 2 levels), comparable to elementary and middle school in the United States. The compulsory primary education lasts for eight years (from age 6–14).
Though primary education is undivided, the general (1–4 grades) and lower-secondary (5–8 grades) parts of the education are often differentiated. Teachers at the general and lower secondary levels might have different qualifications. Classes at general and lower-secondary levels are sometimes held in different buildings. In most cases, students have the same homeroom teacher in the first four years, and then another homeroom teacher for the next four years (grades 5–8). The homeroom teacher in the lower-secondary part of primary education is responsible for assisting students in the transition to secondary education. Thus, feedback and contact with the homeroom teacher in grades 5–8 could have a larger impact on students’ later educational decisions than their homeroom teacher from the first four grades.
3.2. Roma ethnic minority
The Roma are spread throughout Europe. There is a particularly large Roma community in Hungary, ranking among the highest in Europe after Bulgaria, Slovakia, Romania, and Serbia, relative to the size of the population.
The Roma are the largest and poorest ethnic minority in Hungary. Most Hungarian Roma speak Hungarian as their mother tongue, but most non-Roma Hungarians can recognize them by their appearance (Kemény and Janky Citation2006). The Roma minority makes up approximately 8 percent of the Hungarian population (Morauszki and Papp Z Citation2015; Pénzes, Tátrai, and Pásztor Citation2018). This proportion is higher among primary school-aged students. According to estimates provided by school principals in 2021, approximately 21% of students in Hungarian primary schools are Roma.
Roma people face significant economic exclusion (Kertesi and Kézdi Citation2011a) and residential segregation (Kemény and Janky Citation2006). The majority of Roma households experience poverty; in the 2010s, approximately 80% of Roma households were classified as poor, compared to around 25% of non-Roma households during the same period (Bernát Citation2018). Roma people are also the target of ethnic prejudice (Simonovits, Kézdi, and Kardos Citation2018) and discrimination (Buda et al. Citation2023), even relative to economically disadvantaged (poor) people (Janky et al. Citation2014). Illustrating the extent of entrenched prejudiced attitudes toward Roma people, a nationally representative survey found that 60 percent of Hungarians agree that ‘criminality is in the blood’ of the Roma (Bernát et al. Citation2012).
Roma students demonstrate lower academic performance than non-Roma students, reflected in lower grades and test scores. The ethnic test-score gap between Roma and non-Roma primary school students is comparable to the disparity observed between white and African-American students in the United States during the 1980s (Kertesi and Kézdi Citation2011b). Roma students also frequently encounter school segregation (Kertesi and Kézdi Citation2012) and suffer substantial discrimination, even from their own non-Roma classmates (Elwert, Keller, and Kotsadam Citation2023). Roma students attend lower-quality education and select school tracks with lower earning potential (Hajdu, Kertesi, and Kézdi Citation2019; Kertesi and Kézdi Citation2010, Citation2011a, Citation2011b). A significant proportion of Roma students do not complete secondary education, and only a small number pursue tertiary education (Kertesi and Kézdi Citation2016), even though Roma students hold similar attitudes to their non-Roma peers regarding school achievement, effort, and school behavior (Keller Citation2020).
3.3. The ethnic composition of schools in Hungary
The school composition influences students’ educational achievement and attainment in Hungary (Hermann and Kisfalusi Citation2023). Administrative data provide further insights into composition-specific differences among Hungarian primary schools. According to school principals’ estimates, a strong correlation exists between the shares of Roma students and poor students within a school.
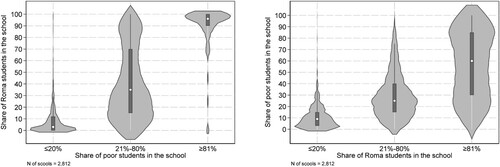
The left panel of shows that in schools with a high share of poor students (over 80%), almost all students are Roma (median: 96%)Footnote4. In schools with a low share of poor students (less than 20%), only a few Roma students attend (median: 3%). The right panel of shows that in schools with a high share of Roma students (over 80%), the majority of students are poor (median: 60%)Footnote5, whereas in schools with a low share of Roma students (less than 20%), only a small percentage of students are poor (median: 9). In summary, indicates that schools with a significant proportion of Roma students also tend to have a high proportion of economically disadvantaged students, and vice versa. As a result, it is necessary to disentangle the ethnicity- and status-related determinants of teachers’ perceptions.
Figure 1. Violin plot indicating the connection between the share of poor students and Roma students within the schools:school principals’ estimates.
Note: Data: NABC 2021, 8th grader sample, own calculation.
4. The experiment
The study underwent ethical review and received approval from the Institutional Review Board (IRB) at HUN-REN Center for Social Sciences. Supplementary materials, data, and all analytical scripts are archived on the study's project page at the Open Science Framework (OSF): https://osf.io/6z7c4/.
4.1. The survey
A vignette survey experiment was conducted among Hungarian primary school teachers from November 2021 to May 2022. An invitation letter was sent to all Hungarian primary schools through the school’s central e-mail address. The invitation letter asked the school principal to forward the letter to homeroom teachers in grades 5 to 8. The letter informed teachers of the purpose of the study: to explore teachers’ grading practices. Among those teachers who participated, five randomly selected teachers received a gift voucher worth 25 EUR; teachers were informed about the lottery in the invitation letter.
Teachers participated in the survey voluntarily and accessed the questionnaire online. The survey included one vignette and two related questions about perceptions of students’ school performance. The teachers were also asked to complete a short background questionnaire regarding their gender, age, work experience, the grade level at which they serve as homeroom teachers, and the subject they teach. On average, it took approximately three minutes for the median teacher to complete the survey.
4.2. The sample
The sample comprises 562 teachers from 322 schools across 273 settlements. The 322 schools representabout 10% of all Hungarian primary schools. Among the schools in the sample, 61% had only one participating teacher, 25% had two participating teachers, and the remaining 14% had three or more participating teachers. The maximum number of teachers participating from the same school was 11.
The sample of 322 schools is not representative of Hungarian primary schools. compares the characteristics of the sample schools to all Hungarian primary schools, using register data from 2021. The comparison highlights that schools in the sample are 16 percentage points more likely to be village schools and small-sized schools (by 6 percentage points), with a higher percentage of poor (by 3 percentage points) and Roma students (by 7 percentage points) than schools not included in the sample. Consequently, in the sample schools, the social status index of 8th-grade students is 0.32 standard deviation units lower than in schools not in the sample. Moreover, 8th-grade students in the sample schools exhibited lower math (by 0.19 standard deviation units) and reading performance (by 0.21 standard deviation units) compared to schools not included in the sample.
Table 1. The characteristics of sample schools, relative to all Hungarian primary schools.
Panel B in Appendix Table A1 shows that none of the listed school-level characteristics in consistently influence teachers’ perceptions of students’ school performance across different specificationsFootnote6. Therefore, based on teachers’ observed characteristics, the non-representativeness of the sample should not undermine the conclusions that can be drawn from this sampleFootnote7.
Using census data (the last publically available census is from 2011) further confirms that schools in the sample are situated in small settlements with an above-average share of the Roma population. While 27% of Hungarian primary schools are located in settlements with less than 2,000 inhabitants, this shareis 34% in the sample. Differences are less pronounced but still present regarding the schools’ share of Roma students. Specifically, 4% of Hungarian primary schools are in settlements where the share of the Roma population is more than 20%, compared to 6% in the sample. Furthermore, 21% of Hungarian primary schools are in settlements where the share of the Roma population is more than 5%; this percentage is 25% in the sample.
The primary school teachers in the sample (N = 562) were homeroom teachers at grades 5 (23%), 6 (19%), 7 (28%), and 8 (30%), teaching students from ages 10–14 at ISCED 2 level. The 562 teachers represent about 8% of all the teachers from the sample schools. Teachers in the sample are not representative of Hungarian primary school teachers. Women are underrepresented; the sample contains 79% female and 21% male participants, while nationally ,the proportion of primary school teachers that are women is around 85% (Varga Citation2021). The sample also contains a greater proportion of experienced middle-aged teachers than the national average; the mean age among teachers in the sample is 48 years (SD = 8.6 years). In 2020, 30% of Hungarian primary school teachers were between 40 and 49 years old; in the sample, it is 37%. In contrast, the shares of young and old teachers are both 3 percentage points lower in the sample than in the general population (Varga Citation2021). Teachers in the sample are more likely to teach Roma students and poor students. Based on school principals’ reports in 2021, 4% of Hungarian primary school teachers work in schools with more than 80% Roma students; this figure is 8% in the sample. Furthermore, 1% of Hungarian primary school teachers work in schools where the share of poor students exceeds 80%, compared to 2% in the sample. Throughout the analysis, these differences are accounted for by controlling for the participating teachers’ background characteristics and incorporating school-level fixed effects.
4.3. The experimental design
The experiment had a between-subject design. Every teacher received one vignette, and different teachers might receive different vignettes. This design allows for comparisons between teachers. Teachers were tasked with evaluating the school performance of hypothetical disadvantaged and non-disadvantaged students.
To disentangle the differences between social-status-based and ethnicity-based compositional effects, the vignettes labeled disadvantaged students as either ‘poor’ (representing the disadvantaged group in general) or ‘Roma’ (representing the disadvantaged ethnic minority group). The depiction of the classroom context also varied, describing a high or low share of disadvantaged studentsFootnote8. In the ‘poor’ vignette, the classroom context described a high or low share of poor students; in the ‘Roma’ vignette, the classroom context depicted a high or low share of Roma students. This meant having four vignettes in the survey corresponding to the four possible combinations of disadvantaged students’ labels (Roma or poor) and the share of disadvantaged students (high or low). Each teacher received one random vignette out of the four possible options.
Teachers were asked to answer two consecutive questions regarding the same vignette: one concerning the school performance of disadvantaged students (Roma/poor) and another concerning the school performance of non-disadvantaged students (non-Roma/non-poor). This design element made it feasible to distinguish between the direct and indirect compositional effects. Sample vignettes are shown in Footnote9.
Figure 2. Sample vignettes to rate (non)-poor and (non)-Roma students.
Note: Words that appear in the [squared brackets] are the alternative word used in other vignettes.
![Figure 2. Sample vignettes to rate (non)-poor and (non)-Roma students.Note: Words that appear in the [squared brackets] are the alternative word used in other vignettes.](/cms/asset/3abbfe8c-ee73-448b-bfb2-9266a7b23ea0/cede_a_2372558_f0002_ob.jpg)
The experiment was specifically designed to address the four outlined limitations identified in previous studies. Teachers were asked to rate the school performance of fictitious students based solely on the information provided in the vignettes. This design element ensured that teachers’ prior experiences with specific students would not influence their ratings; they had no contact with the (fictional) students they were asked to evaluate (1). Furthermore, since the described share of disadvantaged students in the classroom varied across vignettes, comparing teachers’ perceptions in classrooms with a high share of disadvantaged students to classrooms with a low share of disadvantaged students reveals how compositional effects influence teachers’ perceptions of students (2). In addition, the research design disentangles compositional effects related to social status and ethnicity by leveraging the semantic distinction between ‘Roma’ and ‘poor’. Since the labeling of disadvantaged students varied randomly across the vignettes, comparing the compositional effects between the ‘Roma’ and the‘poor’ vignettes can reveal how the Roma ethnicity—rather than correlated characteristics of Roma (such as being poor)—affects teachers’ perceptions (3). The study also differentiates between direct and indirect compositional effects. By comparing teacher-perceived school performance of disadvantaged (Roma/poor) students in classrooms with a high versus low share of disadvantaged (Roma/poor) students, the direct compositional effects can be revealed. Similarly, by comparing the teacher-perceived school performance of non-disadvantaged (non-Roma/non-poor) students in classrooms with a high or low share of disadvantaged (Roma/poor) students, the indirect compositional effects can be exposed (4).
4.4. Treatment, randomization, and balance
The treatment in the experiment was the assignment of teachers to a vignette. Teachers were allocated vignettes based on a randomly generated number. The share of the four deployed vignettes is equally distributed in the sample as 26, 26, 24, and 24 percent of teachers answered the above-described four vignettes, respectively. Thus,145, 149, 134, and 135 teachers are assigned to vignettes #1, #2, #3, and #4, respectively.
The randomization resulted in a good balance of teachers’ observable characteristics. Teachers randomized to different vignettes were similar in terms of gender, age, and the grade for which they were homeroom teachers. Teachers were also balanced in terms of the schools in which they teach, with similar shares of Roma students, rich and poor students in the school, and school-average math and reading test scores. Concerning these variables, the pairwise mean difference between teachers assigned to different vignettes was statistically insignificant in most cases (see Table A2 in the Appendix)Footnote10. Therefore, the applied between-subject design does not appear to be undermined by the different baseline characteristics of the teachers.
4.5. The outcome variable
The outcome variable is students’ teacher-perceived school performance, rated by teachers after the treatment. To assess teachers' overall perceptions of students' academic performance, they were asked about students' general school performance without focusing on any particular subject. Teachers used a slider to indicate students’ school performance that could theoretically range between 1 (worst) and 5 (best), corresponding to the commonly used grading scheme in Hungarian schools. The slider had a sensitivity of one decimal, meaning that there were nine categories between two integer grades.
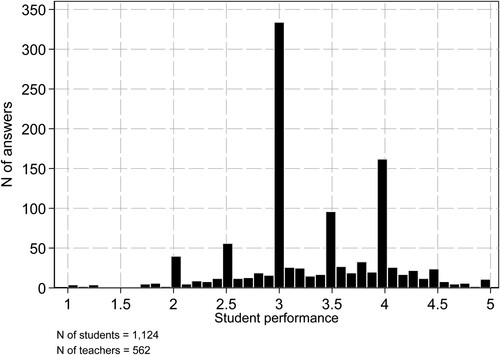
shows the distribution of the dependent variable. Although the most frequent response was 3 (indicating average performance), there was considerable variance in how teachers estimated the fictitious students’ school performance. The teachers’ mean estimate of students’ school performance was 3.3 (SD = 0.71).
Figure 3. Teacher’s perceptions of students’ school performance.
5. Empirical strategy
The following OLS model was used to estimate how the classroom’s composition affects teachers’ perception of students’ school performance.
In Equation (1), Y is teachers’ perceptions of students’ school performance. Variable S marks whether vignette v assessed by teacher t was a ‘poor’ or a ‘Roma’ vignette using the label of poor ( = 0) or Roma ( = 1) when describing the fictitious studentsFootnote11. Variable C represents the classroom context (0 = low share of disadvantaged [poor/Roma] students; 1 = high share of disadvantaged [poor/Roma] students). The vector X captures teachers’ background variables (gender, age, fixed effect for the taught subjects, and the grade level where the teacher is a homeroom teacher, introduced in dummies), represents school fixed effects and
is the individual error term. Standard errors are clustered at the school level.
(1)
(1) The coefficient
shows how teachers rated students labeled as Roma (rather than those labeled as poor) in a classroom context where the share of disadvantaged [poor/Roma] students is low. This coefficient does not have a substantive interpretation regarding the compositional effects.
The coefficients and
refer to the compositional effects, which are the focus of the analysis. The coefficient
shows the differences in students’ teacher-perceived school performance if the classroom has a high (rather than a low) share of poor students. The coefficients
show the differences in Roma students’ teacher-perceived school performance if the classroom has a high (rather than a low) share of Roma students. Coefficient
measures the difference between the two compositional effects: the social-status-based (poor) and the ethnicity-based (Roma). This coefficient tests whether the compositional effects are driven by the Roma ethnicity or rather by being poor as a correlate of Roma ethnicity.
Equation (1) is estimated for both the disadvantaged (Roma/poor) students and non-disadvantaged (non-Roma/non-poor) students in independent estimates to reveal direct and indirect compositional effects, respectively.
6. Results
shows the (non)-Roma and (non)-poor students’ average school performance in different classroom contexts: where the share of disadvantaged (Roma/poor) students is low or where the share of disadvantaged (Roma/poor) students is high. shows the compositional effects estimated by Equation (1).
Figure 4. Teachers’ perceptions of (non)-poor and (non)-Roma students’ average school performance under different classroom compositions.
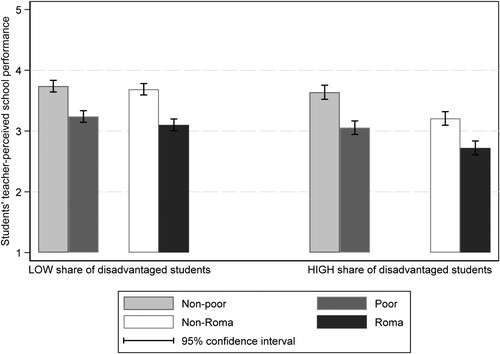
Table 2. Compositional effects in students’ teacher-perceived school performance.
Column 1 in estimates the direct compositional effects. In classrooms with a high (rather than low) share of Roma students, teachers rated Roma students’ school performance by 0.37Footnote12units lower (p = 0.01) on a scale ranging from 1 to 5. Correspondingly, there is a remarkable difference between the two black bars in . Expressing the ethnicity-based direct compositional effect in the units of the dependent variable’s standard deviation results in a medium-sized (−0.57) standardized effect. By contrast, in classrooms with a high (rather than low) share of poor students, teachers did not rate students’ performance differently ( = −0.03; p = 0.89). The difference between the two dark-gray bars in is small. There is only a small standardized effect of 0.04 for the social-status-based direct compositional effect. The two (Roma and poor) direct compositional effects are statistically not different;
is statistically not significant (
= −0.35; p = 0.16). This comparison is equivalent to the difference between the two black bars relative to the difference between the two dark-gray bars in . Thus, the decrease in teachers’ ratings of Roma students in classrooms with a high versus low share of Roma students was statistically similar to the decrease in ratings of poor students in classrooms with a high versus low share of poor students.
Column 2 in estimates the indirect compositional effects. In classrooms with a high (rather than low) share of Roma students, teachers rated non-Roma students’ school performance significantly lower ( = −0.51; p > 0.01). Correspondingly, there is a remarkable difference between the two white bars in . The estimated ethnicity-based indirect compositional effect is equivalent to a −0.78 standardized effect, expressing the point estimate in the standard deviation unit—a large effect. By contrast, teachers did not rate non-poor students’ school performance lower in classrooms with a high (rather than low) share of poor students (
= −0.07; p = 0.65). Thus, the difference between the two light-gray bars in is small. The standardized effect is also small-sized: −0.11. The two (Roma and poor) indirect compositional effects differ statistically since
is statistically significant (
= - 0.44; p = 0.05). This indicates that the decrease in teachers’ ratings of non-Roma students in classrooms with a high versus low share of Roma students was larger than the decrease in ratings of non-poor students in classrooms with a high versus low share of poor students.
Sensitivity analyses (in Tables A3 and A4) reveal that both the direct and indirect compositional effects are robust concerning teachers’ real experience with Roma. When the same models are estimated on various subsamples based on the actual size of the Roma minority in the settlement, the estimated coefficients do not change substantially. Differences between the coefficients are never statistically significant and are attributed to the smaller sample size, making the point estimates more imprecise. This indicates that the compositional effects are not influenced by teachers’ actual experiences of Roma people.
As an aside, and not related to the compositional effects, indicates that labeling disadvantaged studentsas Roma or poor did not translate to any difference in teachers’ perceptions, as the coefficients are not statistically significant in either of the two columns of the table.
7. Discussion and conclusion
This study investigated how classroom composition affects teachers’ perceptions of students’ school performance. The classroom’s ethnic and social status composition has the potential to influence teachers’ perceptions, as categorization processes often lead individuals to assume similar attitudes between people who share social connections (Halgin, Borgatti, and Huang Citation2020). The deployed experimental design elucidates how Roma ethnicity and the correlated economic disadvantage drive compositional effects. It was hypothesized that teachers in classrooms with a high share of disadvantaged students (Roma/poor) would perceive students’ school performance as lower than teachers in classrooms with a low share of disadvantaged students.
The results supported the hypothesis concerning Roma students. Teachers rated the school performance of both Roma students (direct compositional effect) and non-Roma students (indirect compositional effect) lower in classrooms with a high share of Roma students than in classrooms with a low share of Roma students. However, no evidence emerged for social-status-based compositional effects. Teachers rated economically disadvantaged, poor, and non-poor students similarly, regardless of whether the classroom had a high or low share of poor students. The comparison between ethnicity (Roma) and social-status (poor) driven compositional effects shows a statistically significant difference in indirect compositional effects, while no difference was found in direct compositional. The significant difference observed between ethnicity-based and social status-based indirect compositional effects suggests that teachers’ perceptions may be particularly driven by the ethnic Roma context rather than by economic disadvantage, often correlated with the Roma context.
Evidence of ethnicity-based indirect compositional effects could have important policy consequences. It could signal the boundaries of desegregation programs and explain why some high-status parents oppose integrated education (Goldring and Hausman Citation1999). For example, if non-Roma students’ performance suffers in a Roma-dominated classroom, parents may be opposed to sending their children to segregated Roma schools. The indirect compositional effects may also lead to discrimination against non-Roma students in situations where teachers assess students’ performance, such as grading, giving school recommendations, or school admissions. Therefore, non-Roma students in these schools might receive lower grades, less advanced school recommendations, and a reduced likelihood of admission to higher-quality schools.
The non-representativeness of the sample used in the analysis may limit the external validity of this research. Although some observed characteristics of teachers have been controlled for, there could be other unobserved teacher-level characteristics influencing teachers’ perceptions that are not accounted for. While teacher-fixed effects could address this issue, they are not available here, as teachers responded to one vignette. A less profound bias might be caused by the non-representative sample at the school level. While the schools in the sample are small village schools with a higher share of Roma students, any biases that the particular school context might introduce to teachers’ perceptions are controlled for by school-fixed effects, allowing for comparisons of teachers from the same school.
Another issue is whether teachers’ perceptions are informed by their experiences or their biases. In this regard, sensitivity analyses indicated robust results concerning teachers’ real experiences with Roma students. The observed direct and indirect compositional effects remained stable, regardless of the teachers’ prior experiences with Roma people. This suggests that prior experience with Roma people has little influence on the observed compositional effectsFootnote13.
In conclusion, the finding of disadvantageous perceptions of non-Roma students in high-Roma-share schools is a remarkable finding that, to the best of my knowledge, has not been established before. Nevertheless, further research should delve deeper into how the composition of classrooms influences teachers’ perceptions of students’ school performance—specifically exploring ethnicity-based indirect compositional effects. The Hungarian context and the focus on Roma holds significant importance for countries with a large Roma minority, such as Bulgaria, Slovakia, Romania (Plainer Citation2021; Rauh Citation2018), and Serbia (Battaglia and Lebedinski Citation2022; Baucal Citation2006). Understanding the dynamics of how classroom composition affects teachers’ perceptions can shed light on the potential impact of ethnicity and social context on educational outcomes (Hermann and Kisfalusi Citation2023), providing valuable insights for educational policies and interventions aimed at promoting equity and inclusivity in schools (Alesina et al. Citation2018).
Supplemental Material
Download MS Word (52.8 KB)Acknowledgements
The research was supported by grants from the Hungarian National Research, Development and Innovation Office (NKFIH), Grant number K-135766; the János Bolyai Research Scholarship of the Hungarian Academy of Sciences (BO/00569/21/9) and the New National Excellence Program of the Ministry for Culture and Innovation from the source of the National Research, Development and Innovation Fund (Grant Number: ÚNKP-23-5-CORVINUS-149).
Disclosure statement
No potential conflict of interest was reported by the author(s).
Notes
1 The Roma’s disadvantaged position, especially within the school system, has been a topic of social research in Hungary and neighboring countries such as Romania (Rauh Citation2018; Plainer Citation2021) and Serbia (Baucal Citation2006; Battaglia and Lebedinski Citation2022) for many decades.
2 The hypothesis positing a positive correlation between classroom composition and teachers’ perceptions of individual students’ school performance differs from the predicted negative correlation posited in Davis’ (Citation1966) frog pond theory or the related big-fish-in-little-pond (BFLP) theory by Marsh (Citation1987). However, the negative correlation pertains to the classroom’s ability composition, whereas the positive correlation assumed in this paper relates to the classroom’s ethnic and social status composition.
3 Seemingly precise perceptions can potentially arise from self-fulfilling prophecies (Rosenthal and Jacobson Citation1968; Friedrich et al. Citation2015) or sustaining expectations (Rubie-Davies, Hattie, and Hamilton Citation2006)—processes that negatively impact students’ performance.
4 The violin plots in show the distribution of Roma students (left panel) and poor students (right panel) based on the categories of poor (left panel) and Roma (right panel). Violin plots integrate two types of information. First, they show symmetric density curves of the distribution of students (y-axis) according to the categories of variables on the x-axis. Second, within the center of each symmetric curve (violin), a box plot provides additional distributional detail about the median (white dots) and interquartile ranges (dark gray columns).
5 Schools with a high share of Roma students are mostly located in small villages—places where principals might not observe significant status differences that would justify classifying some students (relative to others) as poor. This might explain why the median percentage of poor students is ‘only’ 60% in schools where the share of Roma students is above 80%.
6 This is an unsurprising result as teachers received the vignettes randomly.
7 Nevertheless, the models in Table A1 reveal that female teachers rated students’ school performance systematically higher than male teachers did. Teachers’ gender is controlled in the estimations shown later in the results section.
8 The vignettes always used the terms ‘high’ and ‘low’ without connecting them to specific benchmarks.
9 Upon receiving vignette #1, teachers evaluated poor students, before evaluating non-poor students in a classroom with a low share of poor students. With vignette #2, they initially rated Roma students, and then non-Roma students in a classroom with a low share of Roma students. Vignette #3 led them to first assess poor students, and then non-poor students in a classroom with a high share of poor students, while vignette #4 prompted them to first evaluate Roma students, and then non-Roma students in a classroom with a high share of Roma students.
10 There are only sporadic statistically significant mean differences between teachers assigned to vignettes #1 and #4 concerning teachers’ gender (p<0.01) and the share of poor students in the classroom (p = 0.04). Furthermore, teachers assigned to vignettes #2 and #4 differ in their gender (p = 0.02). None of these statistically significant mean differences remain significant after correcting for multiple testing. Since teachers’ gender and school fixed effects appear in all models, even these small differences are controlled for.
11 Note that the same notion was used to describe the disadvantaged and the not-disadvantaged student in the two consecutive questions after each vignette.
12 +
13 Nevertheless, the primary focus of this study was to explore teachers’ perceptions of students (which the study was designed to do) rather than exploring the reasons for these perceptions (which the study was not designed to do).
References
- Alesina, Alberto, Michela Carlana, Eliana La Ferrara, and Paolo Pinotti. 2018. “Revealing Stereotypes: Evidence from Immigrants in Schools.” NBER Working Paper Series Working Pa.
- Alvidrez, Jennifer, and Rhona S. Weinstein. 1999. “Early Teacher Perceptions and Later Student Academic Achievement.” Journal of Educational Psychology 91 (4): 731–746. https://doi.org/10.1037/0022-0663.91.4.731.
- Battaglia, Marianna, and Lara Lebedinski. 2022. “With a Little Help from My Friends: Medium-Term Effects of a Remedial Education Program Targeting Roma Minority.” Economics of Education Review 86: 102196. https://doi.org/10.1016/j.econedurev.2021.102196
- Baucal, Aleksandar. 2006. “Development of Mathematical and Language Literacy among Roma Students.” Psihologija 39 (2): 207–227. https://doi.org/10.2298/PSI0602207B.
- Bernát, Anikó. 2018. “A Magyarországi Romák Társadalmi Integrációja a 2010 Es Években.” In edited by T. Kolosi, and I. G. Tóth, 144–165. Budapest: TÁRKI. TÁRKI.
- Bernát, Anikó, Péter Krekó, Attila Juhász, and Csaba Molnár. 2012. “A Radikalizmus És a Cigányellenesség Gyökerei a Szélsőjobboldal Szimpatizánsai Körében.” In Társadalmi Riport 2012, edited by T. Kolosi, and I. G. Tóth, 355–376. Budapest: TÁRKI Társadalomkutatási Intézet Zrt.
- Bonefeld, Meike, Hannah Kleen, and Sabine Glock. 2022. “The Effect of the Interplay of Gender and Ethnicity on Teachers Judgements: Does the School Subject Matter?” Journal of Experimental Education 90 (4): 818–838. https://doi.org/10.1080/00220973.2021.1878991.
- Buda, Jakab, Renáta Németh, Bori Simonovits, and Gábor Simonovits. 2023. “The Language of Discrimination: Assessing Attention Discrimination by Hungarian Local Governments.” Language Resources and Evaluation 57 (4): 1547–1570.
- Costa, Sara, Sabine Pirchio, and Sabine Glock. 2022. “Teachers’ and Preservice Teachers’ Implicit Attitudes toward Ethnic Minority Students and Implicit Expectations of Their Academic Performance.” International Journal of Intercultural Relations 89 (June): 56–62. https://doi.org/10.1016/j.ijintrel.2022.05.006.
- Davis, James A. 1966. “The Campus as a Frog Pond: An Application of the Theory of Relative Deprivation to Career Decisions of College Men.” American Journal of Sociology 72 (1): 17–31. https://doi.org/10.1086/224257.
- Elwert, Felix, Tamás Keller, and Andreas Kotsadam. 2023. “Rearranging the Desk Chairs: A Large Randomized Field Experiment on the Effects of Close Contact on Interethnic Relations.” American Journal of Sociology 128 (6): 1809–1840. https://doi.org/10.1086/724865.
- Ferguson, Ronald F. 2003. “Teachers’ Perceptions and Expectations and the Black-White Test Score Gap.” Urban Education 38 (4): 460–507. https://doi.org/10.1177/0042085903038004006.
- Fiske, Susan T. 1998. “Stereotyping, Prejudice, and Discrimination.” In The Handbook of Social Psychology, edited by D. T. Gilbert, S. T. Fiske, and G. Lindzey, 357–411. Boston, MA: McGraw-Hill.
- Friedrich, Alena, Barbara Flunger, Benjamin Nagengast, Kathrin Jonkmann, and Ulrich Trautwein. 2015. “Pygmalion Effects in the Classroom: Teacher Expectancy Effects on Students’ Math Achievement.” Contemporary Educational Psychology 41: 1–12. https://doi.org/10.1016/j.cedpsych.2014.10.006.
- Glock, Sabine, Carrie Kovacs, and Ineke Pit-ten Cate. 2019. “Teachers’ Attitudes towards Ethnic Minority Students: Effects of Schools’ Cultural Diversity.” British Journal of Educational Psychology 89 (4): 616–634. https://doi.org/10.1111/bjep.12248.
- Glock, Sabine, and Sabine Krolak-Schwerdt. 2013. “Does Nationality Matter? The Impact of Stereotypical Expectations on Student Teachers’ Judgments.” Social Psychology of Education 16 (1): 111–127. https://doi.org/10.1007/s11218-012-9197-z.
- Goldring, E. B., and C. S. Hausman. 1999. “Reasons for Parental Choice of Urban Schools.” Journal of Education Policy 14 (5): 469–490. https://doi.org/10.1080/026809399286161.
- Guryan, Jonathan, and Kerwin Kofi Charles. 2013. “Taste-Based or Statistical Discrimination: The Economics of Discrimination Returns to Its Roots.” The Economic Journal 123 (572): F417–F432. https://doi.org/10.1111/ecoj.12080.
- Hajdu, Tamás, Gábor Kertesi, and Gábor Kézdi. 2019. “Inter-Ethnic Friendship and Hostility between Roma and Non-Roma Students in Hungary: The Role of Exposure and Academic Achievement.” B.E. Journal of Economic Analysis and Policy 19 (1): 1–17.
- Halgin, Daniel S., Stephen P. Borgatti, and Zhi Huang. 2020. “Prismatic Effects of Negative Ties.” Social Networks 60 (xxxx): 26–33. https://doi.org/10.1016/j.socnet.2019.07.004.
- Hanna, Rema N., and Leigh L. Linden. 2012. “Discrimination in Grading.” American Economic Journal: Economic Policy 4 (4): 146–168. https://doi.org/10.1257/pol.4.4.146.
- Hermann, Zoltán, and Dorottya Kisfalusi. 2023. “School Segregation, Student Achievement, and Educational Attainment in Hungary.” International Journal of Comparative Sociology.
- Hilton, James L., and William von Hippel. 1996. “Stereotypes.” Annual Review of Psychology 47 (1): 237–271. https://doi.org/10.1146/annurev.psych.47.1.237.
- Hinton, Perry. 2017. “Implicit Stereotypes and the Predictive Brain: Cognition and Culture in ‘Biased’ Person Perception.” Palgrave Communications 3 (1): 17086.
- Hoge, Robert D, and Theodore Coladarci. 1989. “Teacher-Based Judgments of Academic Achievement: A Review of Literature.” Review of Educational Research 59 (3): 297. https://doi.org/10.3102/00346543059003297.
- Janky, Béla, Béla Janky, Boglarka Bakó, Péter Szilágyi, and Adrienn Bognár. 2014. “Stigmatising the Poor without Negative Images: Images of Extreme Poverty and the Formation of Welfare Attitudes.” Sociological Research Online 19 (3): 246–255.
- Jussim, Lee, and Kent D. Harber. 2005. “Personality and Social Psychology Review.” Personality and Social Psychology Review 9 (2): 131–155. https://doi.org/10.1207/s15327957pspr0902_3.
- Keller, Tamás. 2020. “Differences in Roma and Non-Roma Students’ Ratings of Their Peers’ Popularity: An Inquiry into the Oppositional Culture in Hungarian Schools with the Use of a Survey Experiment.” Quality & Quantity 54 (4): 1233–1255.
- Kemény, István, and Béla Janky. 2006. “Roma Population of Hungary 1971–2003.” In Roma of Hungar, edited by I. Kemény, 70–225. New York: East European Monographs.
- Kertesi, Gábor, and Gábor Kézdi. 2010. “Iskolázatlan Szülők Gyermekei És Roma Fiatalok a Középiskolában. (Children of Roma and Uneducated Families in the Secondary Schools).” In Társadalmi Riport 2010, edited by T. Kolosi, and I. G. Tóth, 371–407. Budapest: TÁRKI Társadalomkutatási Intézet Zrt.
- Kertesi, Gábor, and Gábor Kézdi. 2011a. “The Roma/Non-Roma Test Score Gap in Hungary.” American Economic Review 101 (3): 519–525. https://doi.org/10.1257/aer.101.3.519.
- Kertesi, Gábor, and Gábor Kézdi. 2011b. “Roma Employment in Hungary after the Post-Communist Transition.” Economics of Transition 19 (3): 563–610. https://doi.org/10.1111/j.1468-0351.2011.00410.x.
- Kertesi, Gábor, and Gábor Kézdi. 2012. “Ethnic Segregation between Hungarian Schools : Long-Run Trends and Geographic Distribution.” Hungarian Statistical Review 90 (16): 18–45.
- Kertesi, Gábor, and Gábor Kézdi. 2016. “On the Test Score Gap between Roma and Non-Roma Students in Hungary and Its Potential Causes.” Economics of Transition 24 (1): 135–162. https://doi.org/10.1111/ecot.12076.
- Macrae, C. Neil, and Galen V. Bodenhausen. 2000. “Social Cognition: Thinking Categorically about Others.” Annual Review of Psychology 51 (1): 93–120.
- Marsh, Herbert W. 1987. “The Big-Fish-Little-Pond Effect on Academic Self-Concept.” Journal of Educational Psychology 79 (3): 280–295. https://doi.org/10.1037/0022-0663.79.3.280.
- McCauley, Clark, Christopher L. Stitt, and Mary Segal. 1980. “Stereotyping: From Prejudice to Prediction.” Psychological Bulletin 87 (1): 195–208. https://doi.org/10.1037/0033-2909.87.1.195.
- McKown, Clark, and Rhona S. Weinstein. 2008. “Teacher Expectations, Classroom Context, and the Achievement Gap.” Journal of School Psychology 46 (3): 235–261. https://doi.org/10.1016/j.jsp.2007.05.001.
- Morauszki, András, and Attila Papp Z. 2015. “Ethnic Revival ? The Methodology of the 2011 Census and the Nationalities of Hungary.” Minority Studies: Demography, Minority Education, Ethnopolitics 18 (October): 141–160.
- Oates, Gary L. St. C. 2003. “Teacher-Student Racial Congruence, Teacher Perceptions, and Test Performance.” Social Science Quarterly 84 (3): 508–525. https://doi.org/10.1111/1540-6237.8403002.
- Pénzes, János, Patrik Tátrai, and István Zoltán Pásztor. 2018. “A Roma Népesség Területi Megoszlásának Változása Magyarországon Az Elmúlt Évtizedekben.” Területi Statisztika 58 (1): 3–26. https://doi.org/10.15196/TS580101.
- Plainer, Zsuzsa. 2021. “Segregated Schools, ‘Slow Minds’ and ‘Must Be Done Jobs’: Experiences About Formal Education and Labour Market in a Roma Community in Romania.” In Social and Economic Vulnerability of Roma People, edited by M. M. Mendes, O. Magano, and S. Toma, 39–52. Cham: Springer International Publishing.
- Rauh, Christopher. 2018. “Decomposing Gaps between Roma and Non-Roma in Romania.” Journal of Demographic Economics 84 (2): 209–229. https://doi.org/10.1017/dem.2017.19.
- Riegle-Crumb, Catherine, and Melissa Humphries. 2012. “Exploring Bias in Math Teachers’ Perceptions of Students’ Ability by Gender and Race/Ethnicity.” Gender & Society 26 (2): 290–322. https://doi.org/10.1177/0891243211434614.
- Rosenthal, Robert, and Lenore Jacobson. 1968. “Pygmalion in the Classroom.” The Urban Review 3 (1): 16–20. https://doi.org/10.1007/BF02322211.
- Rubie-Davies, Christine M. 2010. “Teacher Expectations and Perceptions of Student Attributes: Is There a Relationship?” British Journal of Educational Psychology 80 (1): 121–135. https://doi.org/10.1348/000709909X466334.
- Rubie-Davies, Christine, John Hattie, and Richard Hamilton. 2006. “Expecting the Best for Students: Teacher Expectations and Academic Outcomes.” British Journal of Educational Psychology 76 (3): 429–444. https://doi.org/10.1348/000709905X53589.
- Simonovits, Gábor, Gábor Kézdi, and Péter Kardos. 2018. “Seeing the World Through the Other’s Eye: An Online Intervention Reducing Ethnic Prejudice.” American Political Science Review 112 (1): 186–193. https://doi.org/10.1017/S0003055417000478.
- Sprietsma, Maresa. 2013. “Discrimination in Grading: Experimental Evidence from Primary School Teachers.” Empirical Economics 45 (1): 523–538. https://doi.org/10.1007/s00181-012-0609-x.
- Timmermans, A. C., H. de Boer, H. T. A. Amsing, and M. P. C. van der Werf. 2018. “Track Recommendation Bias: Gender, Migration Background and SES Bias over a 20-Year Period in the Dutch Context.” British Educational Research Journal 44 (5): 847–874. https://doi.org/10.1002/berj.3470.
- Timmermans, Anneke C., Hester de Boer, and Margaretha P. C. van der Werf. 2016. “An Investigation of the Relationship between Teachers’ Expectations and Teachers’ Perceptions of Student Attributes.” Social Psychology of Education 19 (2): 217–240. https://doi.org/10.1007/s11218-015-9326-6.
- Van Ewijk, Reyn. 2011. “Same Work, Lower Grade? Student Ethnicity and Teachers’ Subjective Assessments.” Economics of Education Review 30 (5): 1045–1058.
- Varga, Júlia. 2021. A Közoktatás Indikátorrendszere 2021. editor. J. Varga. Budapest: Közgazdaság- és Regionális Tudományi Kutatóközpont, Közgazdaság-tudományi Intézet.
- Wenz, Sebastian E., and Kerstin Hoenig. 2020. “Ethnic and Social Class Discrimination in Education: Experimental Evidence from Germany.” Research in Social Stratification and Mobility 65 (December 2019): 100461. https://doi.org/10.1016/j.rssm.2019.100461.