
ABSTRACT
The COVID-19 pandemic has seriously affected the world's cultural institutions, as well as driving digitization and a change in the relationships with their audiences. This study explores how the most visited art-museums in Spain have reacted through their social networks to the pandemic. Two key moments, the confinement and a period one-year after the declaration of the health crisis are compared. A mixed method by combining a content analysis of 2392 publications on Twitter and Instagram and two regression models evidence that COVID-19 has been a turning point in the management of museum communication in digital ecosystems. The main findings highlight the importance of active listening and the ability of these channels to create experiences beyond the physical visit. The strategic value of its implementation is underlined. Practical implications are included and it emphasized the role of entertainment and social support of the museums in crisis situations.
1. Introduction
Museums are icons of many cities and a powerful magnet for attracting tourists (Van Riel Citation2021) contributing fundamentally to society (Ayala, Cuenca-Amigo, and Cuenca Citation2020; Jafari, Taheri, and vom Lehn Citation2013) but travel restrictions and a substantial blockage of tourist flow resulting from the pandemic, have paralyzed the entire museum sector (Raimo et al. Citation2021).
The health crisis caused by COVID-19 forced the closure of all non-essential structures and activities, including museums. In this period, museums defined as their main strategy to disseminate culture, knowledge and the entertainment to the lockdown population through online media. This has led to an acceleration of the digitization processes, but, rather than by using spectacular innovative technologies, social media have been used, which are available to almost the entire population (Agostino, Arnaboldi, and Lampis Citation2020; Raimo et al. Citation2021).
Social media (SM), blogs or mobile social media have developed peer-to-peer communication with an increasingly participative, but above all credible audience (de las Heras-Pedrosa et al. Citation2019). It can be argued that SM has brought about a democratization of communication, altering the broader context of public participation by enhancing two-way communication (Arnaboldi and Coget Citation2016; Black Citation2018; de las Heras-Pedrosa, Sánchez-Núñez, and Peláez Citation2020).
Today, no one questions the relevance of Instagram's position as a SM based on photo uploads, whereas Twitter is usually associated with texts. Notable works focused on the topic include Weilenmann, Hillman, and Jungselius (Citation2013) and Budge and Burness (Citation2018), who analyze how Instagram supports the visitor experience in museums. The special interest of Instagram for museum management lies in the power of the images and its ability to transmit and make live experiences through the photosharing that characterizes it (Budge and Burness Citation2018; Mioli Citation2015). However, Amanatidis et al. (Citation2021) and Brown Jarreau, Dahmen, and Jones (Citation2019) show in their work that communication strategies require planning based on the combination of different social media.
This process of two-way communication is having a particular impact on museums. The digital reorganization of museum culture is based on a new relationship between the museum and its public through a more dynamic approach to the encounter between the visitor and the museum's narratives, which can range from the more traditional mediation to co-creation (Amitrano, Gargiulo, and Bifulco Citation2018; Antón, Camarero, and Garrido Citation2018; D’Angelo Citation2020; Taylor and Gibson Citation2017).
Fortunately, at the time of the outbreak of the crisis and the decree of worldwide lockdowns, a broad representation of museums had the technology and audience necessary to expand their virtual presence (American Alliance of Museums Citation2020) under the global #StayatHome premise. The use of SM was widespread and their usefulness in gaining popularity and connecting with audiences was well documented (Fletcher and Lee Citation2012; Simone, Cerquetti, and La Sala Citation2021; Vrana et al. Citation2019). Social bookmarking, podcasting, blogging, photosharing among other options, were a reality that allowed to increase information, motivation and engagement as well as to give dynamism to the exhibitions, workshops and permanent collections (Weilenmann, Hillman, and Jungselius Citation2013; Wong, Lai, and Tao Citation2020). Immediately after the health alert was declared, museums increased the investment of time and resources and multiplied the experimentation and use of virtual tools to maintain their online presence and the corresponding link and position with key audiences (International Council of Museums Citation2020; UNESCO Citation2020).
Educational and entertainment were some of the most popular resources among museums around the world under the hashtag #MuseumUnlocked (International Council of Museums Citation2020). This hashtag alone on Instagram in English generated 2493 posts. Meanwhile, it is also worth noting the trend of recreating images of works of art at home, especially on Instagram. The movement promoted by the Getty Museum in Los Angeles with the hasghtag #GettyMuseumChallenge – generating more than 56.5k posts on Instagram – has been replicated and carried out with various modifications in different art institutions on all continents (American Alliance of Museums Citation2020). This phenomenon has aroused the interest of researchers and professionals, including organizations that bring together museums and other cultural institutions. The research generally agrees that in the face of an adverse scenario such as the pandemic, social media were positioned as the ideal way to remain in contact with the public and create content based on their collections (D’Angelo Citation2020; Ebrahimi, Hajmohammadi, and Khajeheian Citation2020); and, in some way, to stay in the memory in view of the beginning of its new stage after the first battle against COVID-19 (Agostino, Arnaboldi, and Lampis Citation2020; Merrit Citation2020; Rivero et al. Citation2020; Souza and Lee Citation2020). These studies conclude that the digital transition of museums has accelerated as a result of the crisis (Raimo et al. Citation2021). The increase in the volume of content generated daily on the main SM is also very illustrative, for example, the Prado Museum quadrupled its content on Twitter in the first week of the lockdown and other museums began to increase their content on social media, previously less exploited on their official profiles, such as Tiktok (American Alliance of Museums Citation2020). In short, the efforts undertaken were also clearly rewarded in terms of the number of followers and interactions measured in comments, as well as expanding their reach by sharing the contents (#ThisIsTheRealSpain Citation2020).
For all of the above reasons, this paper focuses its attention on Instagram and Twitter as key social media in the digital content management of museums, in times of COVID-19. This scenario raises numerous topics to delve into, so the questions that guide this research are:
RQ1: What content strategy and relationship management with their audiences have museums followed since the declaration of the pandemic by COVID-19?
RQ2. How have museums used social media to disseminate knowledge and culture in times of COVID-19 comparing strategies during the lockdown and just one year after the health crisis?
RQ3. Is there any relationship between follower engagement and museums’ interaction with their followers on the impact of their social media?
2. Methods
This research has employed a mixed-method approach to analyze the digital communication strategy of art museums during the most difficult periods of the COVID-19. From the qualitative approach, a content analysis was applied to all the digital content generated in the social networks (Instagram and Twitter). Regarding the quantitative approach, a multivariate analysis was carried out.
2.1. Data collection
According to the objectives of this research, five relevant art museums were selected. The first two were included in Top 20 museums around the world (AECOM Citation2021) and in all cases the majority of visitors are international ().
Table 1. Museums analysed. Source: Own elaboration based on data (AECOM Citation2021) and (Ministerio de Cultura y Deporte. Gobierno de España Citation2021).
The first period of analysis was carried out by extracting the content generated in the official accounts of the five museums during the first phase of the pandemic, coinciding with the lockdown from 14 March to 21 June 2020. Strict restrictions in response to the health alert forced museums to cease all activity in their facilities and to maintain their presence and relationships with audiences using digital channels. A second period of analysis is included from 8–21 March 2021, coinciding with the one-year anniversary of the declaration of the global pandemic. The double period of analysis allows to give a more holistic view of the evolution and most outstanding practices on Instagram and Twitter by museums. A total of 2392 posts were analyzed (2061 posts/Stage 1 and 331 posts/Stage 2). Stories were not included due to the immediacy and expiration of their permanence in the social media, in addition to the impossibility of extracting them through the content tracking and monitoring tools used.
General statistics on volume of publications and other metrics such as likes or engagement are presented to contextualize the activity of the museums. In any case, the analysis focuses on Instagram and Twitter. On the one hand, Instagram due to its volume of users, the average time of use, as well as the properties and functionalities focused on sharing photo of this social media. On the other hand, Twitter, since it was one of the social media with the longest history of use in all the museums, as well as standing out for the average number of publications (). It should be noted that in the cases the number of followers, daily activity and engagement of both social networks provide a complementary basis for this methodological decision.
Table 2. Main metrics of Museums’ SM.
2.2. Measures and instruments
A mixed method has been chosen, according to Krippendorff (Citation2004) the combination of qualitative and quantitative approach increase the precision of the research and its findings, as well as generating a new knowledge from this holistic and complementary vision that the combination of methods provides. In addition, it allows reflecting the complexity of certain phenomena (Coyle and Williams Citation2000). The use of content analysis is supported by Weber (Citation2011) who asserts that it is a particularly useful technique for evaluating the content of social media and allowing researchers to make inferences based on their information. In addition to analyzing the themes, reactions and feelings to them, statistical analyses are included to increase the explanatory value of the data and information gathered in the fieldwork. As a result, a holistic view of museum dynamization through social media during the health crisis is offered. Specifically focusing on lockdown as a key turning point in the transition from content generation and the ‘imperative’ conversion of museums to virtual ones with a stricter closure of activity accompanied by the obligation to stay at home. The content analysis focuses on Twitter and Instagram, both images (still or video) and the text that accompanies them have been taken into account in the research. Knowing the type of content, the approach and the effect on the reactions and interaction of the public have been some of the central questions. shows the evaluation sheet. The most relevant metrics studied in the field of SM, especially Peters et al. (Citation2013), have been used as the basis for its design.
Table 3. Technical sheet for content analysis.
The first part will answer RQ1. Likewise, this analysis will make it possible to explore whether the priority is to enhance the image of the museum, maintaining the memory of the ‘brand’, strengthening relationships with the public, as well as connecting with potential visitors, etc. The originality of the work and therefore its methodological approach places special emphasis on the reputational aspects and the interaction and management of relationships with the public through the content management strategy in social media and the mediating power of the pandemic.
Additionally, to support the qualitative analysis with the quantitative data, a reliability test of the data has been applied as well as a linear regression of main impact indicators linked on the one hand to the general metrics in the target social networks (followers, number of posts, likes, comments and engagement). On the other hand, for the key variables of the content analysis, in this model the tone of the message and total interactions are included, the latter as a dependent variable. This type of analysis is particularly suitable for explaining the extent to which variables influence each other and how they can be predictive. The first regression (model 1) presents Engagement as the dependent variable and the second regression (model 2), which incorporates variables from content analysis, Total Interactions. Both regression models are preceded by a correlation analysis. It helps to reduce possible biases, noise and the effect of any isolated publication that may distort the overall behavioral pattern of the trend in museum content. The use of this method is a novelty with respect to the research approach in this field and subject matter. The aforementioned analyses have been supported by the FanPage Karma tool and IBM SPSS 27.
Focusing on the series of qualitative variables such as Classification of image, Domain, Style and Emotions, cross tables have been applied, resulting in common patterns among the museums with respect to content strategies in the networks.
Finally, with the support of Kh Coder text mining software, word frequencies, word networks, cocurrence of words and multidimensional scaling of words in the accounts of museums in their digital ecosystem have been calculated for the two periods.
2.3. Validity and reliability
It is relevant to highlight the robustness of a methodological design that includes two time series of the content generated on Instagram both by the official accounts of the museums. The mixed method gives more consistency to the analysis. In addition, analysis tools with their advanced algorithmic analysis functionalities make it possible to better manage and exploit the information resulting from the volume of content (FanPage Karma and Kh Coder). Each post was double coded by two researchers, which reduced bias and possible researcher bias. In case of disagreement in categorization the two remaining researchers participated in the corresponding attribution ensuring the robustness of the method.
3. Results
3.1. Descriptive analysis
and show the ratios and the average number of comments of the 2382 monitored posts disaggregated by period.
Table 4. Main SM metrics during Stage 1- Isolation.
Table 5. Main SM metrics Stage 2.
It is worth noting that on Instagram the reactions (likes, shares) and interactions (comments) and even engagement is higher than on Twitter. There are tweets that are expressly the answer to a question launched by a user tagging them.
A relevant issue is the coincidence of content between the publications made on Twitter and Instagram (). Museums, such as Reina Sofía, have a level of coincidence in content close to 100% while others, such as the Prado or the Museo Nacional de Arte de Cataluña, have a higher level of differentiation but more based on the volume of publications on one network compared to the other, which explains why some of the content only appears on Twitter. In any case, the general trend is a very high coincidence between the editorial line and content posted on both. In most cases, the differences are more the result of adapting the content to the requirements of the SM.
Table 6. Coincidences of content between Instagram and Twitter.
3.2. Multivariant analysis
We intend to study the relationships between the variables obtained from the publications in the two stages considered. The problems of non-normality of some of these variables makes it advisable to use a non-parametric measure of association, such as Spearman rank correlation (Schober, Boer, and Schwarte Citation2018). However, it has been shown that Pearson's correlation can be helpful in unmasking hidden correlations even in the absence of normality (Rovetta Citation2020). Then, we have obtained both Pearson and Spearman coefficients. The correlation analysis applied to the total number of publications in the two periods yields a high set of correlations, especially in Spearman test, but only highlight those correlations that are significant at 1% in both methods, to ensure the robustness of the results. As expected, the relationships are always positive, but we will always refer to the two-tailed p-values, which further guarantees that the results have high significance.
In detail, there is a significant relationship between the following variables:
Likes with Engagement (r = 0.458, τ = 0.515), Interactions (r = 0.438, τ = 0.478), Total interactions (r = 0.966, τ = 0.897), Performance (r = 0531., τ = 0.559) and Follower Evolution (r = 0.610, τ = 0.677)
Engagement with Interactions (r = 0.786, τ = 0.947), Total interactions (r = 0.475, τ = 0.691), Performance (r = 0.857, τ = 0.892), Follower evolution (r = 0.791, τ = 0.631)
Interactions with Total interactions (r = 0.430, τ = 0.614), Performance (r = 0.603, τ = 0.784), Followers’ evolution (r = 0.609, τ = 0.541)
Total Interactions with Performance (r = 0.594, τ = 0.723), Followers’ evolution (r = 0.539, τ = 0.749)
Performance with Follower evolution (r = 0.783, τ = 0.675)
It is worth noting that there are no relationships between the total number of SM and the rest of the variables, which suggests that each SM has its own type of target and that these have a different behavior depending on the SM through which they follow and interact with the museum. Also interesting is the lack of or correlations that are not clear enough to be significant between the volume of followers and engagement, likes, comments and interactions with the Twitter or Instagram account. However, there is a relational effect between the variables (likes, comments, engagement, total interactions, performance) and the evolution of followers over time. Consistent with the above, it is not the volume of publications that has the greatest effect on the main metrics. Based on these results, the reactions seem to be more derived from the type of content than from the volume of followers and posts.
It should be emphasized that the originality of this contribution lies in the regression analyses that help to identify relationships and concepts shared in the digital content strategy of museums. The regression models ( and ) show the relationships of dependence on which each of them is built. Associated with each graph are the results of their application for each stage and globally.
Figure 1. Regression Model-1 based on general metrics of SM.
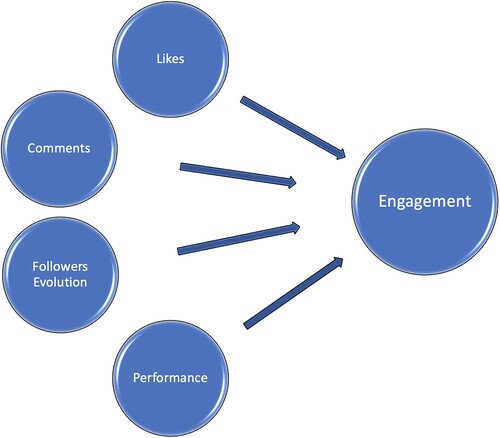
Figure 2. Regression Model-2 based on analysis content for the detailed published content.
The results of the regression Model 1 have been summarized in , model summary, follow the format of Fernández-Hernández, Vacas-Guerrero, and García-Muiña (Citation2021). The model explains 89.7% of the variations in Engagement (R2 = 0.897) and is significant overall (p-value = .000). shows the Perfomance coefficient (β = .030, p-value = .012) has a medium significance. Follower evolution (β = .046, p-value .004) and Coments (β = 1.094E-5, p-value .00) both appear more relevant. On the other hand, the coefficient of Likes is not significant (β = −4.93E-8, p-value = .839). Moreover, it is carried out the rescale the p-value in order to know to what extent the sample contributes to the rejection of the hypothesis. It has been applied Shannon's Information measure () and the contribution is higher in the case of Coments and Performance (Greenland Citation2019; Greenland et al. Citation2016). The p-values correspond to the two-tailed Student's t-test.
Table 7. Endogenous variable: Engagement. OLS.
The sign is positive for all relevant variables, showing that Coments, Perfomance and Followers evolution contribute to Engagement, but not equally. The beta coefficients reveal that Followers evolution is the largest contributor, followed by Coments and Perfomance. The difference between these contributions is relatively small.
The OLS estimation results are only reliable if there is no multicollinearity, heteroscedasticity, autocorrelation or outliers. All of the above, together with the normality of the endogenous variable, makes the residuals behave like a normal distribution. With regards to multicollinearity, no multicollinearity is observed in this regression, all Variation Inflation Factors (VIF) are lower than 4. Levene's test for homogeneity of variances takes the value 2.052, p-value .126, the null hypothesis of homoscedasticity is accepted at any of the usual levels of significance. The value of the Durbin and Watson statistic is 1.834, which suggests that there is no first degree autocorrelation. With respect to outliers, no value greater than 3 appears among the standardized residuals, which together with the fact that the leverage values do not exceed three times their mean, they are not greater than 0.75, seems to indicate that in this regression there is an absence of outliers according to Stevens (Citation2009) rule reported in Field (Citation2013). Finally, the normality was checked by means of the Shapiro–Wilk test, the statistic takes the value .950, with a probability value equal to .249, the hypothesis of normality of the residuals is not rejected.
How much the relevant variables change could be considered if corrections to the level of significance such as Bonferroni's, or Holm's, are applied. To implement Bonferroni, it is sufficient to divide the significance level by the number of predictors in the regression, although this is a conservative test and it is more attractive to apply Holm's method (Aickin and Gensler Citation1996). No agreement exists in the literature on whether or not such corrections should be used in the case of regression (Mundfrom et al. Citation2006). In addition, the effect size may affect the determination of which variables are relevant in a sampling study, but given that for model 1 the sample is small, such an effect is not expected to have an impact on variables as important for Engagement as the Followers Evolution or Comments.
In Model 1 a dummy variable has been included for each of the museums, in order to rule out the possibility that the relationships established between the variables are distorted by the effect of the museum. In Model 1, these dummies are, in general, not relevant.
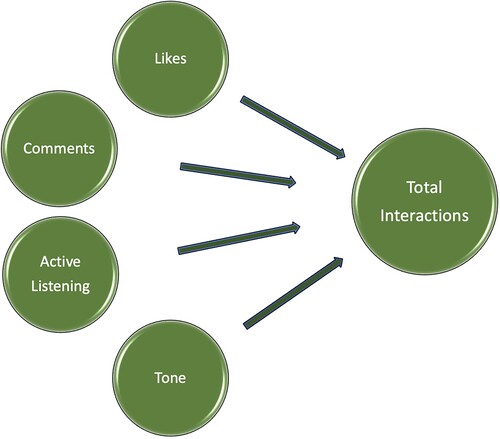
Model 2 is used to analyze which variables affect Total Interactions. As can be seen in , Likes, Tone, Active Listening and Comments are considered.
The results of the regression model have been summarized in . The model explains 91.1% of the variations in Total Interactions (R2 = 0.911) and is significant overall (Fobs 925.426, p-value = .000). The coefficient of Likes (β = 5.73E-5, p-value = .000) and Active listening (β = .442, p-value = .000) have high significance. Tone (β = .011, p-value = .000) and Comments (β = .000, p-value = .437) are not relevant variables. The values of the Shannon Information measure (S) reveal that in the case of Active Listening the rejection of the hypothesis of non-relevance of the variable is very clear (S = 502.719). Moreover, the beta coefficient of this variable is also much higher than that of the others.
Table 8. Endogenous variable: total interactions.
As in Model 1, the previosus hypotheses required in the regression must be tested to establish that the results are reliable. An earlier outlier treatment had to be carried out, since 11 standardized residuals greater than 3 appeared in the file of 745 observations, and it was decided to eliminate them in a first approximation. Once these outliers have been corrected, the Leverage values are maintained at adequate levels (the highest is 0.21). The Durbin and Watson test has a value of 1.672, indicating that there is no first degree autocorrelation. Regarding multicollinearity, high levels are not observed in this regression (VIF < 6), but the presence of some linear relationships between the variables cannot be discarded.
The Levene's test of homogeneity of variances takes the value 8.486, p-value .000. The results of these tests, as well as the graphs indicate that there is a problem of heteroscedasticity. Lastly, although the validity of the Shapiro–Wilk test is doubtful in large samples (Field Citation2013), it is not surprising that the normality hypothesis has been rejected (Shapiro–Wilk statistic .980, p-value .000).
The violation of some of the hypotheses of the general linear regression model has led us to the use of another estimation method to guarantee the validity of the results. ‘The main benefit of the Bootstrap confidence intervals and significance values is that they do not rely on asumptions of normality or homocedasticity’ (Field Citation2013, 352). Bootstrap regression has been used both with all the elements of the population and with the outliers suppressed and the results are very similar. Since has the outliers suppressed, the decision was made not to suppress them in , so that the overall effect can be seen. Whether one or the other approach is applied, the variables ‘Likes’ and ‘Active listening’ are relevant and positively influence the total Interactions, like in the OLS estimation. The results are robust.
Table 9. Endogenous variable: total interactions. Bootstrap.
3.3. Patterns of content strategies in social media
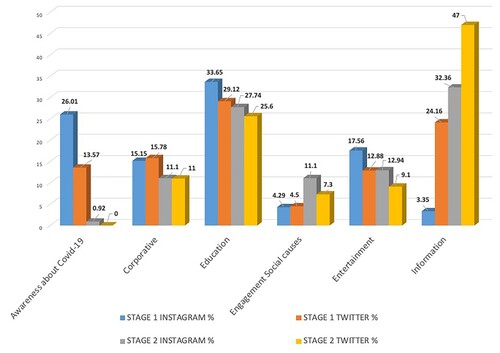
There are no significant differences either during the periods of analysis or with respect to the museums. The majority of the content revolves around the collections, works of art, artists and institutional information of the different museums, followed by information about experiences, own events and art lovers. The effort made by museums to create participatory content stands out, creating unpublished content that arouses the interest of a large part of their target, as in the case of Museo del Prado with a high number of conferences, workshops, etc. focused on works, artists or even techniques, currents or curiosities about the restoration or conservation of works or also connecting with the public by launching challenges such as #GuessTheArtist, share pics of experience in the Museum or reproducing themselves an artwork. The Reina Sofía and the Guggenheim stand out in this line. Additionally, the attempt to empathize with the public through the celebration of international days such as EarthDay, Mothers and Fathers Day or Women Day or the anniversary of the birth of artists are very noteworthy in general. As for the Domain (), a common pattern is evident among the content categories covered by the posts: Information, Education and Entertainment. On the other hand, the difference in the existence of messages focused on awareness about COVID-19, specifically on the lockdown period, stands out. This type of messages is practically non-existent in all the museums studied in March 2021.
Figure 3. Domain dessagregated by Stage and SM.
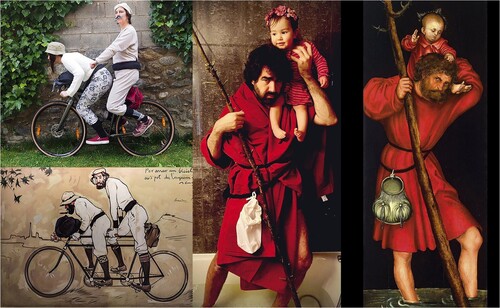
It is worth looking at specific examples of how museums have taken advantage of new digital communication channels to engage future visitors at such a critical time of absolute closure. On the one hand, by offering a ‘digital experience’ incorporating technologies into the museum to continue to keep its artistic exhibition open to the public. On the other hand, at a time of social isolation, the museums analyzed have opened their ‘virtual doors’ by educating and entertaining. Not only with photographs or with a virtual reality of their exhibitions, but also by showing the public more unknown aspects such as the restoration work or games like #ArtAtHomeChallenge that encouraged citizens to send representations of the museum's works on Instagram or Twitter. .
Figure 4. National Art Museum of Catalonia 3 April 2020.
Also, educational games with the hastag #YouKnowWhoIam where a post or Twitter was sent in the morning asking the name of the artwork. Followers’ answers were sought and with it a bidirectional communication. The answer came within hours. An example from National Museum in .
Figure 5. National Museum of Art of Catalonia 8 May 2020.
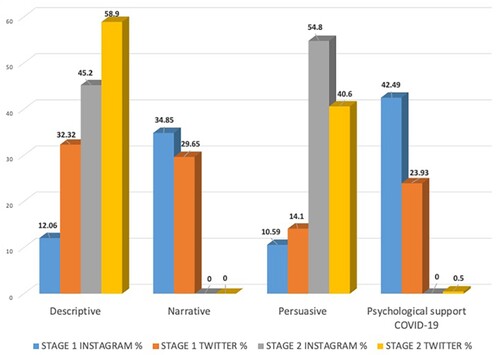
The style of the messages published is different in the two target stages (). While in the first stage there is a greater concentration of descriptive and narrative messages (around 60%) in the second stage, the volume of persuasive and descriptive messages concentrates almost the total amount of published content. In the first stage, the number of publications related to psychological support linked to COVID-19 stand out (42% on Instagram and 24% on Twitter).
Figure 6. Style dessagregated by Stage and SM.
In relation to tone, a common focus is maintained, concentrating a positive and very positive tone. The weight of the neutral tone is also remarkable and makes sense when they are posts describing a work of art, an artist, the celebration of an event in the museum. The representation of negative or very negative tone is nonexistent in both periods. However, there are hardly any differences between social media in each period. An additional issue is the significant relationship between the most positive and positive tone with the highest volume of comments and likes. Followers seem to expect messages with a positive tone according to the type of activity their digital or physical enjoyment is related to: leisure.
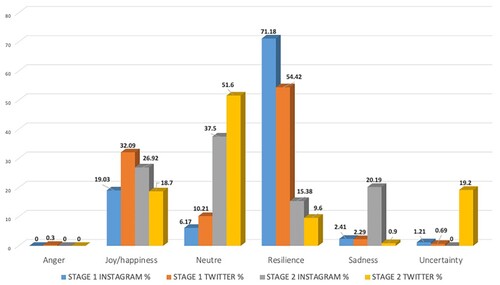
All these parameters are consistent with the timing of the publications and the special circumstances linked to the restrictions associated with each period, but it is interesting to focus on the emotions transmitted by the publications (). During the lockdown, posts categorized as resilient reach 72%, mainly linked to the ideas of ‘everything will be fine’, ‘being at home’ and ‘sticking together’ while in the second period neutral posts or posts promoting joy and happiness are the most numerous (37.5% and 27% respectively). Resilient messages are the least representative (15%) and all are linked to gender equality and feminist movements through exhibitions, women artists … coinciding with Women's Day on March 8.
Figure 7. Emotions dessagregated by Stage and SM.
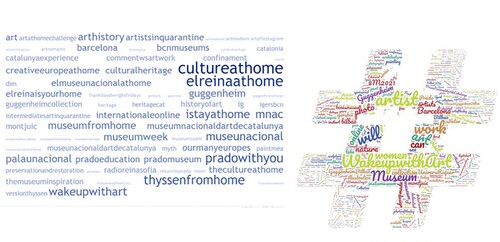
The word frequency tables extracted with Kh Coder software as well as the word clouds () and hashtags clouds () reflect a common pattern in the content of both stages. The words have been categorized as corporative: museum, art, collection, exhibition, artists, painting, artworks as well as those that identify the cultural institution itself with its own name.
Figure 8. WordsClouds Stage 1 and WordsCloud Stage 2.
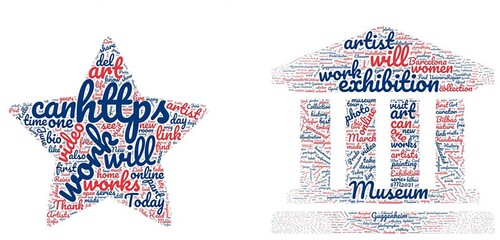
Figure 9. Hashtags WordsClouds Stage 1 and WordsCloud Stage 2.
The declaration of the pandemic meant a radical shift in the digital strategy of SM both because it was an unprecedented moment for the entire population and it was necessary to empathize with the public, as well as the closure of the activity of museums that required the effort to remain in the minds and lives of their targets. Even offering content that would make the collective measure of staying at home more bearable.
In the lockdown phase, resilient words such as ‘we can’, future verbs such as ‘we will return’, ‘we will go out’, ‘we will be’ have a high frequency. It also highlights the use of words that focus attention on the day-to-day such as ‘today’, ‘day’ or words/messages that became the most significant of the pandemic: ‘home’, ‘thank you’, ‘share’ … However, there is no evidence of a relationship between the museums and the words pandemic, COVID-19, disease, … in a direct way. It could only highlight the word ‘quarantine’ for its frequency of occurrence. Museums try through their social media to empathize with the situation of their audiences and show unity to save the situation derived from the pandemic with art as support. Thus, messages during this period such as: ‘I stay at home, stay at home’, ‘togetherwecan’, some of them promoted jointly by cultural institutions around the world as ‘Culture at Home’, ‘ArtistInQuarantine’ or ‘Art from your Windows’.
The TopWords are also the messages that give direct prominence to the museum itself, an example of which are: ‘PradoWithYou’, ‘Guggeheim at home’, ‘The Reina at home’ and in the time series closer to the remission of the restrictions: ‘Prado Come Back’, ‘The Reina Reopening’, etc.
Finally, as a consequence of the special circumstances, words such as inlive, online or https followed by different urls in which content was shared should be highlighted. Compared to stage 2, keywords closely linked to art have a higher frequency of occurrence, even the name of each of the museums has a much more prominent representation by frequency than during the lockdown.
Similarly, there are common patterns in the use of hashtags by museums, both for the activity shared by them and for the key situations or moments that concentrate the interest of their audiences (). Thus, in the isolation phase: #stayathome #IamatHome and derived hashtags that include words linked to the field of museums and art such as #MuseumfromHome or #ArtInQuarantine or the name of the museum are very significant. In contrast, in phase two #WomenInternationalDay or #FathersDay and their derivatives (WomenArtists …) have a strong presence.
Coinciding with stage 1, the names of the museums themselves are prominent hashtags and hashtags related to public participation are trending as well: #picsoftheday, #photooftheday, etc. Again, the presence of words related to the value of the Spain brand or the cities of the museums become prominent hashtags.
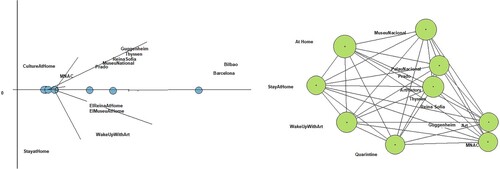
The concurrence analysis and the network co-occurrence network reinforce this joint connection of the museums with the star theme, the pandemic, but mainly associated with the idea of staying at home ().
Figure 10. Concurrence Word and SM Stage 1.
In summary, the analysis content through SM monitoring shows the relationship of variables such as active listening and the tone of messages with the interactions provoked in the public, as well as engagement dependent on the number of comments, interactions and likes and not with the number of publications, yields relevant and practical information for the management of museum activity at the online level. However, the two regression models allow to deepen in which relations are between variables. It should be nuanced that the higher connections with interactions are likes and active listening. Regarding, comments and follower evolution have a high impact on engagement.
4. Discussion
This study shows that the pandemic, beyond the immediate health crisis, has led to a change in many areas. Specifically, with regard to the management of the digital strategy of museums, it highlights a greater exploitation of these channels but, above all, greater creativity in the content published, generating digital experiences that allow these institutions to remain open online, overcoming the tight restrictions to contain the disease. The intensity of use as a consequence of the pandemic has already been highlighted in recent works such as ICOM (Citation2020) or Raimo et al. (Citation2021). These conclusions bear some relation to the work of Agostino et al.(Citation2020) and Amanatidis et al. (Citation2021) for the Italian and Greek case. However, part of the originality of this contribution lies in the analysis with two regression models that lead us to identify relationships and shared concepts in the digital content strategy of museums. The relationship of variables such as likes and active listening with the interactions provoked in the public as well as the engagement depend on comments and follower evolution. Additionally, it allows to answer RQ3. RQ1 is answered by showing that museums have found ways of disseminating their collections, exhibitions … and have also increased the digitalization of the institution. On the other hand, the answer to RQ2, leads us to identify those museums make possible a complete digital experience with educational and entertainment actions beyond the physical visit.
This change marks a before and after that does not end with the opening of museums to the public after the confinement, but continues and remains in force one year after the declaration of the pandemic. The concentration of efforts to maintain relations with the public and create a digital point of contact with them in favor of the knowledge and image of the museum was already mentioned in previous works such as Antón et al.(Citation2018), although not in the context of the pandemic. Regarding works in the same context, the coincidences with those that observe an increase in the use of social media as well as those that highlight the multiplication of formulas or actions to increase the impact of the digital strategy and the special interest in staying at the top of mind, while everything returns to normal (Agostino, Arnaboldi, and Lampis Citation2020; Merrit Citation2020; Rivero et al. Citation2020; Souza and Lee Citation2020) stand out. This work also goes beyond the interest of museums to use SM to extend the experience with the museum after the visit, as highlighted by Ebrahimi, Hajmohammadi, and Khajeheian (Citation2020) or Wong, Lai, and Tao (Citation2020), in this case, the digital experience is itself a direct relationship with the museum that does not require the physical presence of the tourist in an inescapable way. The content analysis also shows how social media are now becoming for museums an environment of co-creation with their audiences, involving them and making them an active part of their activity. This idea has already pointed out by previous works by D’Angelo (Citation2020), Taylor and Gibson (Citation2017). In any case, the main difference lies in the imagination to offer content in the the service of the emotional management of the pandemic through education and entertainment.
5. Conclusions
This study has shown the role of social media as a key instrument for museums. The research points that the presence in the digital ecosystem is not a response to the onset of the health crisis by COVID-19, but the intensification of its use and the content generation strategy, highlighting in general terms, greater creativity in the message and the intention of interaction with the public.
Museums find in SM an efficient way to maintain, despite restrictions and the lockdown, relationships with their public. They then become a channel for reinforcing their image and a formula for keeping themselves open by showing their collections, talking about their artists, generating educational and entertainment activities, etc.
One year after the declaration of the pandemic, the use of social media continued to be maintained, although the orientation of the contents changed, taking away the prominence of COVID-19. However, the reconversion of the digital presence of museums is maintained in both periods. The main difference is that, during the lockdown, the museums made an effort to show themselves close to the society, being a reference as a support to the dramatic situation by launching resilient messages. In the second period, efforts to arouse interest in the physical visit to the museum, exhibitions and collections marked the content strategy.
The research's main contribution is to highlight the capacity of art, through museums, to educate, entertain and fulfill a cultural and social task. COVID-19 is identified as a turning point that has motivated a readaptation, increased creativity and intensity of use of social media. Likewise, it has been found that SM have not only been an information channel but also an instrument for generating digital experiences that do not require a physical visit to the museum, but can also take place without that physical presence and that extends the link with the museum beyond the search for information prior to or immediately after the visit.
Finally, the effort to use social media as a bidirectional channel is clearly shown by the second model in which the importance of active listening with the total interactions, making the publications dynamic and participatory, stand out. Likewise, the engagement can be improved developing a strategy leads to improve the volume of followers over the time and generating content that get likes.
5.1. Limitations and future lines of research
The study is not without limitations, the incorporation of the vision of the followers regarding the digital strategy developed by analyzing the content generated by them could have provided a more complete view of the phenomenon studied. These questions become future lines of research. Likewise, an analysis is proposed on the approach and strategic planning to manage different social networks jointly, but respecting and taking advantage of the particularities of each one in the case of museums.
5.2 Practical implications
No one doubts the relevance of SM for any organization, but in the case of museums this research highlights their ability to become active, participatory and co-creative communication tools. Those responsible for content would take on the constant challenge of creating interesting content, not only informative but also entertaining and educational, as well as the possibility of putting messages at the service of society to generate a climate of trust, resilience and unity in situations of special characteristics, such as a pandemic. The value of active listening and bidirectional interaction with user-generated content is emphasized as a key element of reputation and image.
Authorship
All authors have made substantial contributions to all of the following: the conception and design of the study, acquisition of data and analysis and interpretation of data, revising it critically for important intellectual content and final approval of the version to be submitted.
Disclosure statement
No potential conflict of interest was reported by the author(s).
Additional information
Funding
Notes on contributors
Carlos de las Heras-Pedrosa
Carlos de las Heras-Pedrosa holds a Bachelor's degree in Business and Economics and a PhD degree in Advertising and Public Relations. He is a Professor in the field of Audiovisual Communication and Advertising at the University of Malaga. During eight years he has held the position of Vice-President for Institutional Relations and President's Cabinet at the University of Málaga. His research production revolves around Health Communication and Institutional Communication. He has been a visiting researcher at the University of Miami (USA), the University of Sheffield, the University of Cardiff, the University of Leeds (UK) and the University of Furtwangen (GER). He has also been visiting professor of the Doctoral Program at the Universidad de Guadalajara (México).
Patricia P. Iglesias-Sánchez
Patricia P. Iglesias-Sánchez is a Ph.D in Economics from the University of Malaga, obtaining the Outstanding Doctorate Award from the Economy and Business Faculty. From 2011 to 2016 she reconciled her professional career in a business organization as Manager of Project and fundraising department, with her teaching and research labour. Thanks to that experience she has a wide expertise and knowledge about companies and their management. Additionally, she is an external advisor in several enterprises and she often carries out research projects for companies and public organizations. From June 2016 to the present, she is a full-time Assistant Lecturer at the University of Malaga. Her main lines of research are: social media in tourism, Spin-Offs, Open Innovation, stakeholder involvement in Innovation.
Carmen Jambrino-Maldonado
Carmen Jambrino-Maldonado received the degree in Business and Ph.D. in Marketing field from the University of Malaga, Spain. She is a Professor of Communication Vicedean of Research and has been the managing director of the Doctoral programme “Research and Marketing” and of the research team “Marketing for SMEs” of Malaga University. It receives a grant from the Andalusia Regional Government. Carmen is the coordinator of a postgraduate study. She is Vicedean of Research and International Affairs and teaches Digital Marketing and Communication to undergraduate and postgraduate students. Her research interests is focused on Digital Communication, Open innovation, Strategies of fundraising, Spin-offs and collaborative learning. Furthermore, she exercises her duties as International academic coordinator of Mobility programs.
Pilar López-Delgado
Pilar López-Delgado is Phd in Economics and professor of Econometric, currently she works at the Department of Applied Economics (Statistics), University of Malaga. Pilar does research in Entrepreneurial Economics, Econometrics and Business Economics. Her current research project is “Performance in family firms”. She has published her research in international journals as Review of Managerial Science, Journal of Family Business Strategy or European Journal of Family Business.
Emelina Galarza-Fernández
Emelina Galarza-Fernández is a lecturer in the Faculty of Communication Sciences at the University of Málaga. She has a degree in Law and a PhD in Communication cum laude with international mention. She teaches in the Masters in Gender and Equality at the Pablo Olavide University; the Master Critical Analysis of Gender Inequalities and Comprehensive Intervention in Gender Violence at the University of Jaen and the International Master in Management of Political and Electoral Communication at the Autonomous University of Barcelona. She has carried out national and international research stays. She has published book chapters and articles in national and international scientific journals from the Critical Theory of communication and feminist.
References
- #ThisIsTheRealSpain. 2020. Los Museos Conquintan Las Redes Socialess. https://www.thisistherealspain.com/es/actualidad/los-museos-conquistan-las-redes-sociales.
- AECOM. 2021. Theme Index. https://aecom.com/theme-index/.
- Agostino, Deborah, Michela Arnaboldi, and Antonio Lampis. 2020. “Italian State Museums During the COVID-19 Crisis: From Onsite Closure to Online Openness.” Museum Management and Curatorship 35 (4): 362–372. doi:10.1080/09647775.2020.1790029.
- Aickin, M., and H. Gensler. 1996. “Adjusting for Multiple Testing When Reporting Research Results: The Bonferroni vs Holm Methods.” American Journal of Public Health 86 (5): 726–728. doi:10.2105/AJPH.86.5.726.
- Amanatidis, Dimitrios, Ifigeneia Mylona, Irene Kamenidou, Spyridon Mamalis, and Aikaterini Stavrianea. 2021. “Mining Textual and Imagery Instagram Data During the COVID-19 Pandemic.” Applied Sciences 11 (9), doi:10.3390/app11094281.
- American Alliance of Museums. 2020. Information for the Museum Field on the COVID-19/Coronavirus.” https://www.aam-us.org/2020/03/05/information-for-the-museum-field-on-the-covid-19-coronavirus/.
- Amitrano, Cristina Caterina, Roberta Gargiulo, and Francesco Bifulco. 2018. “Creating Value Through Social Media: Fresh Evidence from Cultural Organizations.” Journal of Creating Value 4 (2): 243–254. doi:10.1177/2394964318805616.
- Antón, Carmen, Carmen Camarero, and María-José Garrido. 2018. “Exploring the Experience Value of Museum Visitors as a Co-Creation Process.” Current Issues in Tourism 21 (12): 1406–1425. doi:10.1080/13683500.2017.1373753.
- Arnaboldi, Michela, and Jean-Francois Coget. 2016. “Social Media and Business: We’ve Been Asking the Wrong Question.” Organizational Dynamics 45 (1): 47–54. doi:10.1016/j.orgdyn.2015.12.006.
- Ayala, Iñigo, Macarena Cuenca-Amigo, and Jaime Cuenca. 2020. “Examining the State of the Art of Audience Development in Museums and Heritage Organisations: A Systematic Literature Review.” Museum Management and Curatorship 35 (3): 306–327. doi:10.1080/09647775.2019.1698312.
- Black, Graham. 2018. “Meeting the Audience Challenge in the “Age of Participation”.” Museum Management and Curatorship 33 (4): 302–319. doi:10.1080/09647775.2018.1469097.
- Brown Jarreau, P., N. S. Dahmen, and E. Jones. 2019. “Instagram and the Science Museum: A Missed Opportunity for Public Engagement.” Journal of Science Communication 18 (2): A06. http://doi.org/10.22323/2.18020206.
- Budge, Kylie, and Alli Burness. 2018. “Museum Objects and Instagram: Agency and Communication in Digital Engagement.” Continuum 32 (2): 137–150. doi:10.1080/10304312.2017.1337079.
- Coyle, Joanne, and Brian Williams. 2000. “An Exploration of the Epistemological Intricacies of Using Qualitative Data to Develop a Quantitative Measure of User Views of Health Care.” Journal of Advanced Nursing 31 (5): 1235–1243. doi:10.1046/j.1365-2648.2000.01381.x.
- D’Angelo, V. 2020. “The Value of Management in the Digitalisation Era: Evidence from an Italian Museum.” International Journal of Digital Culture and Electronic Tourism 3 (1): 94. http://doi.org/10.1504/ijdcet.2020.105904.
- Ebrahimi, Pejman, Ali Hajmohammadi, and Datis Khajeheian. 2020. “Place Branding and Moderating Role of Social Media.” Current Issues in Tourism 23 (14): 1723–1731. doi:10.1080/13683500.2019.1658725.
- Fernández-Hernández, Ruth, Trinidad Vacas-Guerrero, and Fernando E. García-Muiña. 2021. “Online Reputation and User Engagement as Strategic Resources of Museums.” Museum Management and Curatorship 36 (6): 553–568. doi:10.1080/09647775.2020.1803114.
- Field, Andy. 2013. Discovering Statistics Using IBM SPSS Statistics. 4th ed. London: Sage Publications, Inc.
- Fletcher, Adrienne, and Moon J. Lee. 2012. “Current Social Media Uses and Evaluations in American Museums.” Museum Management and Curatorship 27 (5): 505–521. doi:10.1080/09647775.2012.738136.
- Greenland, Sander. 2019. “Valid P-Values Behave Exactly as They Should: Some Misleading Criticisms of P-Values and Their Resolution With S-Values.” The American Statistician 73 (sup1): 106–114. doi:10.1080/00031305.2018.1529625.
- Greenland, Sander, Stephen J. Senn, Kenneth J. Rothman, John B. Carlin, Charles Poole, Steven N. Goodman, and Douglas G. Altman. 2016. “Statistical Tests, P Values, Confidence Intervals, and Power: A Guide to Misinterpretations.” European Journal of Epidemiology 31 (4): 337–350. doi:10.1007/s10654-016-0149-3.
- Heras-Pedrosa, C. de las, C. Jambrino-Maldonado, P. P. Iglesias-Sánchez, and J. Lugo-Ocando. 2019. “Importancia de Las Relaciones Con Los Públicos En La Reputación En Un Destino Turístico Inteligente. Propuesta de Un Modelo Sostenible.” Revista Internacional de Relaciones Públicas 9 (17): 117–138. doi:10.5783/rirp-17-2019-07-117-138.
- Heras-Pedrosa, C. de las, P. Sánchez-Núñez, and J. I. Peláez. 2020. “Sentiment Analysis and Emotion Understanding During the COVID-19 Pandemic in Spain and Its Impact on Digital Ecosystems.” International Journal of Environmental Research and Public Health 17: 5542. http://doi.org/10.3390/ijerph17155542.
- International Council of Museums, (ICOM). 2020. Museums, Museum Professionals and COVID-19. Paris: International Council of Museums. https://icom.museum/wp-content/uploads/2020/05/Report-Museums-and-COVID-19.pdf.
- Jafari, Aliakbar, Babak Taheri, and Dirk vom Lehn. 2013. “Cultural Consumption, Interactive Sociality, and the Museum.” Journal of Marketing Management 29 (15–16): 1729–1752. doi:10.1080/0267257X.2013.811095.
- Krippendorff, Klaus. 2004. Content Analysis: An Introduction to Its Methodology. . 2nd ed. Beverly Hills, CA: Sage Publications, Inc.
- Merrit, E. 2020. Reinventing Museums: Pandemic Disruption as an Opportunity for Change. https://www.aam-us.org/2020/07/07/reinventing-museums-pandemic-disruption-as-an-opportunity-for-change/.
- Ministerio de Cultura y Deporte. Gobierno de España. 2021. Cifras de Visitantes de Los Museos Estatales. https://www.culturaydeporte.gob.es/visitantemuseo/cargarFiltroBusqueda.do?layout=visitantemuseo&cache=init&language=es.
- Mioli, Teresa. 2015. Screens, Not Physical Media, Dominate Culture, Robert Picard Tells ISOJ Audience. https://isoj.org/2959-2/.
- Mundfrom, Daniel J., Jamis J. Perrett, Jay Schaffer, Adam Piccone, and Michelle Roozeboom. 2006. “Bonferroni Adjustments in Tests for Regression Coefficients.” Multiple Linear Regression Viewpoints 32 (1): 1–6.
- Peters, K., Y. Cheng, A. M. Kaplan, B. Ognibeni, and K. Pauwels. 2013. “Social Media Metrics: A Framework and Guidelines for Managing Social Media.” Journal of Interactive Marketing 27: 281–298. doi:10.1016/j.intmar.2013.09.007.
- Raimo, Nicola, Ivano De Turi, Alessandra Ricciardelli, and Filippo Vitolla. 2021. “Digitalization in the Cultural Industry: Evidence from Italian Museums.” International Journal of Entrepreneurial Behavior & Research (Ahead-of-Print). doi:10.1108/IJEBR-01-2021-0082.
- Rivero, Pilar, Iñaki Navarro-Neri, Silvia García-Ceballos, and Borja Aso. 2020. “Spanish Archaeological Museums During COVID-19 (2020): An Edu-Communicative Analysis of Their Activity on Twitter Through the Sustainable Development Goals.” Sustainability 12 (19), doi:10.3390/su12198224.
- Rovetta, Alessandro. 2020. “Raiders of the Lost Correlation: A Guide on Using Pearson and Spearman Coefficients to Detect Hidden Correlations in Medical Sciences.” Cureus 12 (11): e11794. http://doi.org/10.7759/cureus.11794.
- Schober, Patrick, Christa Boer, and Lothar A. Schwarte. 2018. “Correlation Coefficients: Appropriate Use and Interpretation.” Anesthesia & Analgesia 126 (5): 1763–1768. http://doi.org/10.1213/ANE.0000000000002864.
- Simone, Cristina, Mara Cerquetti, and Antonio La Sala. 2021, April 1–20. “Museums in the Infosphere: Reshaping Value Creation.” Museum Management and Curatorship. doi:10.1080/09647775.2021.1914140.
- Souza, J., and Rachel Lee. 2020. How Your Museum Can Use Social Media During COVID-19. https://www.aam-us.org/2020/03/24/how-your-museum-can-use-social-media-during-covid-19/.
- Stevens, James P. 2009. Applied Multivariate Statistics for the Social Sciences. New York, NY: Routledge. doi:10.4324/9780203843130.
- Taylor, Joel, and Laura Kate Gibson. 2017. “Digitisation, Digital Interaction and Social Media: Embedded Barriers to Democratic Heritage.” International Journal of Heritage Studies 23 (5): 408–420. doi:10.1080/13527258.2016.1171245.
- UNESCO. 2020. Museums around the World in the Face of COVID-19. https://unesdoc.unesco.org/ark:/48223/pf0000373530.
- Van Riel, C. B. M. 2021. “Los Museos, Un Factor Clave En El Turismo de Calidad.” In Cities & Museums Forum. Málaga. https://www.diariosur.es/culturas/museos-factor-clave-turismo-calidad-20210622131550-nt.html.
- Vrana, Vasiliki G., Dimitrios A. Kydros, Evangelos C. Kehris, Anastasios-Ioannis T. Theocharidis, and George I. Kavavasilis. 2019. “Top Museums on Instagram: A Network Analysis.” International Journal of Computational Methods in Heritage Science (IJCMHS) 3 (2): 18–42. doi:10.4018/IJCMHS.2019070102.
- Weber, Robert. 2011. Basic Content Analysis. 2nd ed. Thousand Oaks, CA: Sage Publications, Inc. doi:10.4135/9781412983488.
- Weilenmann, Alexandra, Thomas Hillman, and Beata Jungselius. 2013. “Instagram at the Museum: Communicating the Museum Experience Through Social Photo Sharing.” In Proceedings of the SIGCHI Conference on Human Factors in Computing Systems, New York, NY: Association for Computing Machinery, 1843–1852. doi:10.1145/2470654.2466243.
- Wong, Jose Weng Chou, Ivan Ka Wai Lai, and Zhang Tao. 2020. “Sharing Memorable Tourism Experiences on Mobile Social Media and How It Influences Further Travel Decisions.” Current Issues in Tourism 23 (14): 1773–1787. doi:10.1080/13683500.2019.1649372.