
 ?Mathematical formulae have been encoded as MathML and are displayed in this HTML version using MathJax in order to improve their display. Uncheck the box to turn MathJax off. This feature requires Javascript. Click on a formula to zoom.
ABSTRACT
COVID-19 has undeniably affected museums’ online content, yet attempts to identify or understand sector trends have been hampered by a lack of data. This paper uses a representative sample of 315 U.K. museums to create a much-needed benchmark against which museum practitioners can evaluate and contextualise prior studies and their own experiences. Gathering data from museum websites and five social media platforms, this paper is one of the largest studies of its kind in the European museum sector and the first of such scale in the U.K. Beginning with an overview of social media adoption, the paper then investigates museums’ use of YouTube to identify sector trends. Crucially, this paper demonstrates a scalable methodology that enables a broader analysis of European and North American museums using TripAdvisor. This method has applications beyond the heritage sector and is pertinent to the study of any public facing attraction.
Introduction
During the COVID-19 lockdowns in March 2020, a narrative emerged that digital content was able to reach beyond museums’ traditional audiences to engage communities underrepresented in museums on-site visitors (Samaroudi, Echavarria, and Perry Citation2020). In a survey of ten sector experts, Lukas Noehrer et al. (Citation2021) found that digital resources were seen as an opportunity to diversify audiences in the face of the pandemic, a belief which was supported by early surveys measuring digital engagement (Mantell and Turpin Citation2020).Footnote1 Yet the publication of the first large-scale studies has challenged this common account of the early pandemic. The findings of the Centre for Cultural Value’s 18-month-long COVID-19 research project, highlighted that ‘digital distribution is not the great equaliser or diversifier that much of the sector was hoping it was and even claiming it to be’ (Walmsley et al. Citation2022, 68). The profiles of online audiences during the pandemic were discovered to be similar to in-person visitors in 2019, with only 17% of online audiences coming from demographic groups with a low average levels of engagement, compared with 20% of physical visitors (The Audience Agency Citation2021).
The discrepancy between museum practitioners’ accounts of the pandemic and the audience data reaffirms the need for ‘a sound metric to benchmark online visits’ (NEMO Citation2020, 3). Leading sector experts noticed that over the pandemic ‘senior leadership teams became significantly more metric aware’, yet a lack of expertise has hampered digital data collection – an issue that was more acute in smaller organisations without existing digital resources (Noehrer et al. Citation2021, 6; Newman, Beetham, and Church Citation2020; UNESCO Citation2020; Travkina and Sacco Citation2020).
With limited options and already overstretched digital teams, digital surveys have proven a popular and inexpensive way for museums to measure engagement online. However, they have limitations as a method to understand the sector as a whole; privacy and commercial considerations restrict what museums can share, while a self-selection bias in respondents skews our understanding of online audiences (Nuccio and Bertacchini Citation2021; Gran et al. Citation2019; Bethlehem Citation2010). A large-scale quantitative analysis of the sector is desperately needed to provide an overarching view of how COVID-19 has affected the production and reception of online content, creating a benchmark against which museum practitioners can evaluate their own experiences.
Our paper contributes to this ambitious undertaking, focusing on the U.K. museum sector through a representative sample of 315 museums. It explores their online presence across five social media platforms – Facebook, Twitter, Instagram, YouTube, and TikTok – and museum websites, combining this new data with pre-existing efforts to identify trends in online offerings and audience reception. The results of our paper will be divided into two parts: it will begin by exploring the current web presence of museums in the U.K.; and then investigate the impact of COVID-19 through an in-depth analysis of museums’ uploads to YouTube. The perceived popularity of video content in surveys of museum practitioners made YouTube a likely site of change during the pandemic, and will be used as both as an indicator of wider trends and as a demonstration of our methodology (NEMO Citation2020). As arguably the largest study of its kind in the European museum sector and the first to focus on the U.K. institutions, our paper offers three key contributions to the sector:
The creation of a representative dataset recording U.K. museums’ use of social media channels – with a focus on YouTube – that can act as a benchmark for evaluation.
To supplement existing qualitative data gathered during the pandemic with quantitative evidence, identifying sector-wide trends that contextualise the accounts of museum practitioners.
A scalable methodology that can be used to conduct large-scale studies across Europe and North America, and has broader applications in the tourism sector.
Related literature
Social media adoption
Museums use of social media in the last fifteen years – part of a wider adoption of digital technologies dubbed the ‘digital turn’ – has transformed the relationship between the institutions and their audiences. The accessibility and conversational nature of social media became, as Alanna Bayer writes, a ‘potential method for diluting the art institution’s authority, aiding in the incorporation of both large and small voices into artistic conversation’ (Citation2014, 82). Matthew Fisher and Bill Adair noted that this technological development created an opportunity to improve accessibility and social media held ‘enormous potential for museum to effectively realise their objectives online’ (Citation2011, 44). These benefits make social media an attractive prospect for many museums, yet there is remarkably little data on how many actively use social media platforms.
There are multiple barriers that prevent museums from participating online: they need the ability to digitise items in their collections; maintain IT infrastructure such as cameras, computers, and stable internet access; and have skilled staff (François Citation2019, 57). Many museums struggle to meet these criteria, an issue that has been exacerbated by the pandemic (Noehrer et al. Citation2021; UNESCO Citation2020; Murphy Citation2014;). Inhibited by the Europe-wide lockdowns, museums had to halt ongoing digitisation efforts and only those with pre-existing digital resources were able to capitalise on the perceived demand for online content. This has exacerbated digital inequality in the sector, making it more important than ever to understand what types of museums are online – and crucially, what types of museums are not.
Sampling museums’ online output
Discussions of museums’ online offerings usually focus on ‘major institutions’, or the innovative projects of ‘superstar’ museums (Gombault and Allal-Chérif Citation2021; Samaroudi, Echavarria, and Perry Citation2020; Gladysheva, Verboom, and Arora Citation2014). Heralded as sites of innovation, large museums disproportionately shape the perception of online museum experiences in academia both in the U.K. and across Europe (Camarero, Garrido, and José Citation2016; Zafiropoulos, Vrana, and Antoniadis Citation2015). Although small organisations made up 54% of U.K. accredited museums in 2017 and 85% of the estimated number of unaccredited institutions, this majority is largely ignored in discussions of sector trends (Candlin et al. Citation2019, 58).Footnote2
This is primarily due to a lack of data. Giuseppe Vito et al. argued that the ‘main obstacle to pursuing such research is in the data’, and the lack of a benchmark hampered their attempts to analyse the performance of 10 small and medium sized Italian institutions (Citation2017, 1075). This issue became increasingly prominent during the COVID-19 crisis, as researchers had no benchmark from before the pandemic to compare against current online engagement (NEMO Citation2020). In a study of social media use over the early pandemic, Agostino, Arnaboldi, and Lampis (Citation2020, 365) focused on the top 100 most visited Italian museums specifically because they were already being monitored by the Ministry for Cultural Heritage and Tourism. While choosing samples that align with pre-existing datasets enables researchers to contextualise and understand the new data more easily, replicating previous sampling choices perpetuates existing biases. In using a sample that is representative of the wider sector, it is possible to discuss the sector as a whole and to create a benchmark.
Website and social media data
The primary difficulty in creating such a benchmark is automating the data collection process. Across museum websites, it is possible for researchers to extract data using web scraping: firstly, the webpage is fetched and downloaded; and then the information is extracted. The fetching process is usually carried out by web crawlers, autonomous computer programs that systematically search the web and download the desired pages. Once downloaded, these can be searched and the information, included the website’s metadata and the text visible to browser visitors, can be extracted. While this is approach is fast and provides researchers flexibility, it requires site-specific programming and must be updated every time there is a change to the underlying format or layout of the website (Dongo et al. Citation2021; Glez-Peña et al. Citation2014).
Researchers are also limited by the terms of service of websites and must consider the legal ramifications of extracting this information to avoid copyright infringement (Dongo et al. Citation2021; Topaz et al. Citation2019). This is especially pertinent in the wake of the Clearview AI scandal, which saw 20 billion images scraped from public social media profiles to create a facial recognition database (Hart Citation2022; Sobel Citation2020). Large social media platforms expressly forbid unauthorised scraping, even of publicly available data (Twitter Citation2022). Instead, platforms encourage the use of their Application Programming Interfaces (APIs). Researchers can send requests, or queries, to the API, which acts as an interface for the platform’s database.
There are disadvantages to using APIs. There is a limit both the number of queries that can be made in a day, and the types of data available. While researchers are able to request special permissions through academic research applications, ultimately, the data available through these APIs is entirely governed by the corporations that own them (Twitter Developers Citation2022; Facebook Developers Citation2022a; Citation2022c). This results in their utility varying by platform. The Facebook Graph API is the most inaccessible and requires special permissions to access even public page information (Facebook Developers Citation2022b). Daniel Thiele notes that ‘accessing the Facebook API has become more and more difficult for researchers in the past few years’ and criticised the lack of transparency, identifying that ‘the data returned sometimes exhibits gaps or skewness for unclear reasons’ (Thiele Citation2022, 193). For our paper, the difficulty in using Facebook data was such that museums’ page likes and follower counts were verified manually. The reduction in data available since the Cambridge Analytica controversy means that to conduct a larger study including Facebook would require our paper’s methodology to be adapted (Venturini and Rogers Citation2019). Fortunately for the purposes of scaling our study, both the Twitter and Instagram APIs provided useful data that reliably reproduce result that mirrored those of scraping (Dongo et al. Citation2021).
YouTube data
In a recent study of interactive behaviours on Facebook, Gillian Moran et al. discovered that video content was particularly effective at encouraging ‘clicks’, ‘likes’, ‘comments’, and ‘shares’ (Citation2019, 534). Any understanding of engagement with online content is mediated by – and limited to – measures of these interactive behaviours. Combined with the perceived popularity of video content in surveys of museum practitioners and the widespread use of YouTube in the museum sector, the platform was chosen for in-depth study as a likely site of change over the pandemic (NEMO Citation2020).
The functionality of the YouTube Data API allows researchers efficient access to video metrics and made it an attractive choice of platform (Google Developers Citation2022; Malik and Tian Citation2017). While the API limits the number of queries researchers can make per day, it is the most accessible of any major social media site and does not restrict researchers’ ability to generate large data sets through the use of authentication tokens (Henry Citation2021; Chatzopoulou, Sheng, and Faloutsos Citation2010).
Although the capabilities of the YouTube Data API provide ample tools for this research, it has its limitations. Previous studies have been limited to a snapshot of a video’s popularity over a short period of time – at best providing a few months of comprehensive data (Figueiredo, Benevenuto, and Almeida Citation2011; Chatzopoulou, Sheng, and Faloutsos Citation2010; Cha et al. Citation2009). As the API attribute ‘viewcount’ only gives the number of views a video has received at the time the API is accessed, charting the popularity of a video through time requires accessing the API repeatedly over a given period. This makes it impossible to chart a video’s changing popularity in retrospect, as measuring the popularity of a large number of videos – especially without the benefit of hindsight to inform a project’s focus – is costly in both time and API requests, increasing the necessary financial outlay.
The authors accessed the API between 23 and 30 June 2022, taking a snapshot of videos’ popularity two years after the first lockdown measures eased. Yet, while the initial reception of the videos may not be reliably reflected in the ‘viewcount’, it is still a valuable measure. YouTube videos most commonly hit a peak in popularity within days of being uploaded, and over the years there is evidence to suggest that the ‘lifespan’ of YouTube videos is getting shorter (Jiang et al. Citation2014; Pinto, Almeida, and Gonçalves Citation2013). A recent study by Noriaki Kamiyama and Masayuki Muratahas found videos’ daily view count, ‘dramatically decreased over several days just after their upload day and decreased moderately after this initial period’ (Citation2019, 1103). Therefore, even two years after an upload, the number of views is still likely to reflect a video’s initial reception. It should also be noted that the view count can only increase over time, which could lead to an optimistic assessment of the sector. Being aware of these limitations and bias, the number of views remains a valuable metric in the dataset.
Supplementary data
The use of the YouTube Data API in isolation would be of limited use in understanding museums’ video content during the pandemic. Nancy Baym (Citation2013) detailed the shortcomings of decontextualised statistics as a way to understand audiences’ behaviour in a systematic literature review. By only having ‘audience’ data, the group of individuals interacting with a video are misleadingly flattened into a monolithic entity. Our paper hopes to minimise this effect by exploring museums’ actions – for which far more contextualising data is available – alongside the audience reception. Unlike individual audience members, museum data is not anonymised, and it is possible to supplement a museum’s YouTube data with the existing database of the Mapping Museums Project. Compiled over four years between 2016 and 2020, the project collated and validated information on 4,191 museums spanning from 1960 to the present day. The resulting data is open access and is the largest and most comprehensive data set on U.K. museums to date (Ballatore and Candlin Citation2022; Birkbeck Knowledge Lab Citation2021). The research addressed inequalities in data collection and combines and expands on many existing data sets to documented museums’ opening and closing dates, size, subject matter, and location. This contextualising data can be used to identify regional disparities and – combined with policy and economic trends – point at underlying causes of museum closure. In this paper, that same information is added to the social media data, enabling us to explore the digital disparities between regions and types of organisations identified in the earlier UNESCO and NEMO sector surveys (NEMO Citation2020; UNESCO Citation2020).
Museum websites are another valuable source of data, providing links to social media profiles, and helping determine the museums’ relationship to an umbrella or host organisation. Before the discontinuation of alexa.com on 1 May 2022, museum URLs were regularly used to retrieve website’s Alexa traffic ranking. These rankings were an inverse indicator calculated using the number of unique visitors and the total number of pageviews – the lower the Alexa traffic ranking the more the site was frequented (Alexa and Amazon Citation2022). The rankings have been widely used in the previous studies as a measure of websites’ popularity, and their discontinuation poses a problem to researchers (Camarero, Garrido, and José Citation2016; Enhuber Citation2015; Zafiropoulos, Vrana, and Antoniadis Citation2015). In an analysis of a preliminary dataset conducted in anticipation of this paper, we found a statistically significant relationship between museums’ Twitter following and Alexa traffic rankings – indicating that museums which perform well on social media are also likely to have popular websites. Therefore, although Alexa traffic rankings could not be incorporated into this data set, our paper will compensate by exploring the correlations between popularity across multiple social media platforms to achieve a holistic understanding of museums’ online popularity.
Methodology
A stratified random sampling method was used to select a sample from the Arts Council Accredited Museums by dividing them into strata based on the types of museums – either independent, university, local authority,Footnote3 national, National Trust, English Heritage, National Trust for Scotland, or Historic Environment Scotland – and then randomly selecting a number of museums from each group that is proportional to their presence in the population (Arts Council England Citation2021). The 1731 Arts Council accredited museums were sampled using Cochran’s formula corrected for small populations, where n is the sample size, N is the population size, e is the desired level of precision, p is the estimated proportion of the population with the desired attribute (if unknown 0.5 is the maximum), q is (1 – p), and Z is the area under the normal curve with the tails cut based on the desired confidence level (Cochran Citation1977).
(1)
(1)
(2)
(2)
As applied to the English accredited museums, to achieve a 95% confidence level and margin of error of 5% required a sample size of 315.
The distribution of museums’ type in the sample thus reflects those of the accredited U.K. museums and is shown in . However, basing the strata on museum type risks the sample being skewed in other ways, as types of museums are not distributed evenly – National Trust for Scotland and Historic Environment Scotland are only found in Scotland. The largest discrepancy between the population and sample is found in the South East of England which is underrepresented by 4.3% in the sample, however, indicates that when broken down by both type and country, the sample is an accurate to 0.6% in its representation of the U.K. museum sector.
Figure 1. Distribution of types of museums in the sample dataset.
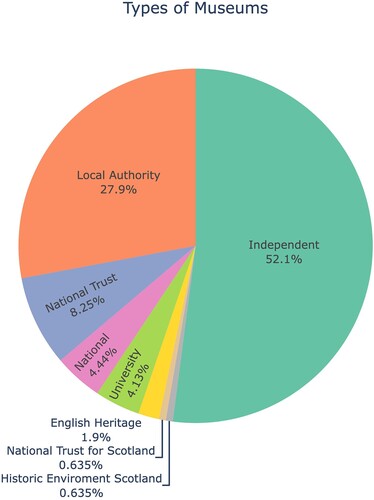
Table 1. Discrepancies in the distribution of ONS regions and countries in the accredited museum dataset and sample dataset.
Creating a representative sample has meant that the null data collected can be used to estimate the percent of U.K. museums that do not have a website or presence on social media. With digital inequality in the sector rising, this is a valuable metric that allows us to identify the types of museums unable, or disinclined, to overcome the obstacles to participation. However, there are limitations to a representative sample. As shown in , the relatively small number of museums in the Channel Islands and Island of Man makes abstractions or comparisons based on that grouping impossible due to the high variability in the data; the results of a single atypical museum would affect our understanding of purportedly sector-wide trends. This effect is also seen when breaking the sample down by size. There was only one ‘huge’ museum, the British Museum, necessitating its removal from some graphs. However, the other size categories each contained a good number of museums: 120 small, 103 medium, and 88 large (see endnote 2).
Once the sample museums were selected, the names were taken from the Arts Council accredited list and used to scrape the URLs from TripAdvisor – a travel comparison and review site. The process was automated through Selenium, a tool to automate web browsers, and the web scraping library Beautiful Soup (Richardson Citation2022; Selenium Developers Citation2022).
The URLs for each of the 315 museums was then checked manually to identify errors. With 4912 U.K. museums listed on TripAdvisor – 721 more than the Mapping Museums Project – the site had a URL listed for almost every museum in the sample. As the world’s largest travel website, its large community of contributors was able to validate the links, producing highly accurate results even when the museum itself had an outdated or confusing web presence. Museum websites are frequently not optimised for search engines and prove difficult to find without a direct link or contextual knowledge. This became evident running the names through third part tools such as Clearbit – which returns the domain with the highest web traffic for a given company name – or Crunchbase (Clearbit Citation2020; Crunchbase Data Citation2022). These tools only returned results for a third of the sample and illustrate the limitations of web scraping with limited human validation.
The museums’ websites were then scraped for links to social media channels, which once again were checked individually. Some form of official website was found for every museum, with 42.5% of museums being hosted by a larger organisation – most frequently by a local authority – while the remaining 57.5% had their own website. Many museums did not provide links to their social media on their website, and a manual check on each social media platform was used to consolidate these results. It is notable that accounts with less than 10 followers were difficult to find even using the search tools of each social media platform.
Using the scraped social media links from the websites, the Twitter and Instagram data were both accessed by generating authentication tokens using the relevant APIs and then using the tweepy and instaloader python libraries respectively to query the data (Roesslein Citation2022; Graf Citation2022). As YouTube will be explored in-depth, in addition to the channel information, data from individual videos, such as the upload date and ‘viewcount’, were also gathered.Footnote4
Once the data was gathered, it was tested for gaussian distribution visually using quantile-quantile plots and checked against the Shapiro–Wilk test (Das and Imon Citation2016). With predominantly non-normal distributions, non-parametric methods were used for hypothesis testing (Parab and Bhalerao Citation2010). Different tests were chosen based on the attributes of the variables and used to identify areas of the data to explore further (Nussbaum Citation2014). Due to both the small sample size, and the desire of our paper is to understand the relationships between variables, outliers have not been excluded from the figures and tables without comment but have been highlighted and explained (Rousseeuw and Hubert Citation2011). Although features of museums’ online popularity – followers, subscribers, number of videos – are all integers, they have been treated as continuous variables and simple linear regression was used to model the relationships between them for some visualisations in an attempt to prioritise clarity and utility to museum practitioners.
Results
A reliance on umbrella organisations
Of the 315 sampled museums, 134 (42.5%) of the museums’ webpages were hosted by a larger umbrella organisation; in 38.8% of cases, this was by a local authority. A third of museums acknowledged the support of a local authority on their website, which exceeds the number of museums identified as ‘local authority’ by the Arts Council; notably a third of those who credited a local authority were classed as independent museums. A similar number of museums were exclusively represented by an umbrella organisation on at least one social media platform, while 12.0% of museums had no social media presence of their own on any of the platforms studied. This figure drops to 10.8% for those that also did not have their own website – a disproportionately high number of which are run by a local authority (50%). Across the U.K. there is a discrepancy between countries, and museums that shared a domain are disproportionately likely to be Scottish, Welsh, or Northern Irish; this difference grows for museums with no web presence of their own ().
Table 2. The reliance on umbrella organisations for domains and social media channels compared by country.
The prevalence of platforms
Facebook proved the most popular platform and 85.7% of museums had their own Facebook page, even in the absence of their own website (). Alternative social media platforms proved surprisingly rare, with only 22 museums (7.0%) appearing to have a presence on TikTok. LinkedIn and Pinterest, were used by less than 2% of museums. These platforms have therefore been excluded from visualisations as subdividing that data by museum size or subject matter would result in high variability.
Table 3. Overview of museums’ use of social media platforms, including comparisons between the use of social media platforms between museums hosted by a larger umbrella organisation and those with their own online presence.
Unsurprisingly, museums that were not hosted by a larger umbrella organisation were more likely to have their own social media channels, although there is difference between platforms; museums are significantly more likely to have a YouTube account if they are not part of a larger organisation. Continuing the trend identified in , there is a higher uptake of social media platforms in England than the rest of the U.K., with the most notable difference found in the use of Twitter ().
Table 4. Museums’ use of social media platforms separated by country.
Attributes of popular museums
The relationship between popularity on different platforms was visualised using simple linear regression, and the best fitting line was calculated using the least squares method (). Popularity across different social media channels is highly correlated, especially on Instagram and Twitter, and the same trends are found across multiple social media platforms. As there is only one ‘huge’ museum, the British Museum, it has been excluded from the visualisations in . With the largest social media following on every platform, it significantly raised the average number of followers on each platform to the extent that it was the only datapoint above the mean, obscuring trends in the data. Three museums for which the size data was unavailable have also been excluded.
Figure 2. Simple linear regression showing the correlation between museums’ popularity across different platforms.
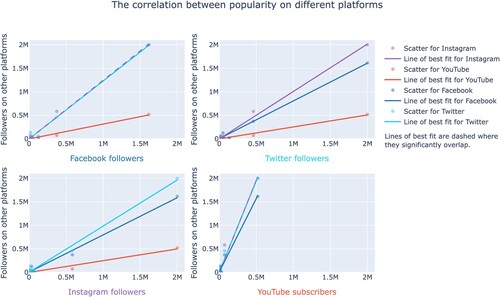
Figure 3. The average social media followings of different museum sizes, separated by social media platform (excluding the single huge museum).
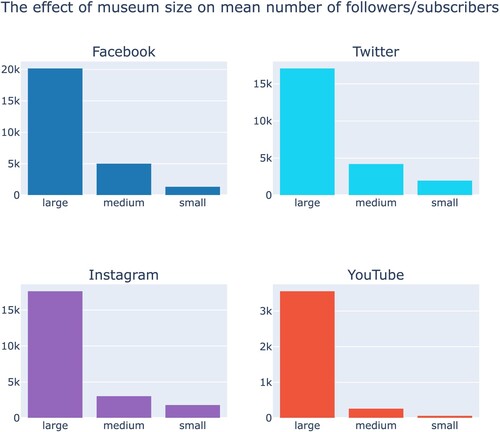
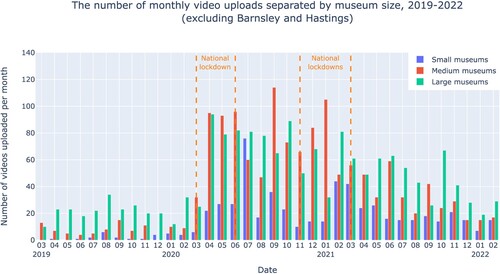
Figure 4. Number of monthly video uploads separated by museum size.
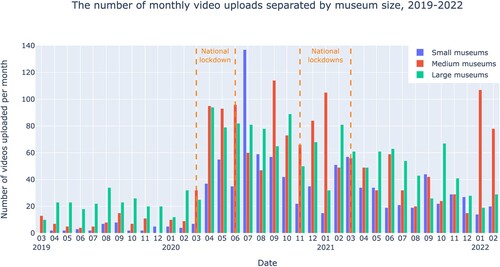
Figure 5. Number of monthly video uploads separated by museum size (excluding Barnsley Museums and Hastings Museum and Art Gallery).
With the exclusion of the British Museum, it becomes clear that across all social media platforms, larger museums tend to have larger followings ().
YouTube
By focusing on a single platform, in this case YouTube, it is possible to investigate these trends in much greater depth. 144 of the 315 museums had dedicated YouTube channels, while a further 90 were represented by the YouTube channel of an umbrella organisation or group. Of the individual museums that use YouTube, the popularity of their channels varied dramatically. While the mean number of subscribers to a museum’s channel is 4,890, the median is a mere 46, a discrepancy that is also evident between the overall channel views (). The vast majority of both channels and videos have a small number of views with a few exceptionally well preforming outliers. This is also true when the number of subscribers is broken down by museum size, and there is a relatively small difference between the worst preforming 50% of each group, and it is predominantly the top preforming quartile of each size category that contributes to the effect in .
Table 5. Distribution of number of channel subscribers and overall channel views for museums’ YouTube channels, alongside the mean and standard deviation.
The relative proportions of the different size groups on YouTube are similar – within 3% – of the overall sample. Like the sample, the small size group includes marginally more museums than the larger sizes. It is therefore notable that , which explores the total number of uploads per size group, indicates a significant increase in the number of videos uploaded by medium-sized museums in March, and they appear to have been the most responsive to the closure of museum sites in mid-March of 2020 (Adams Citation2022). Large museums also substantially increased their uploads in April, and both groups maintained this increased output over the first lockdown period. However, the output of small museums is unclear from this figure due to the limitations of the small sample size. A close examination of individual channel uploads revealed that the July peak for small museums is largely accounted for by Barnsley Museums. The spike in uploads coincides with them publishing a collection of writing tips which consisted of multiple short videos a day. With their contribution removed () it is clear small museums’ uploads rose, but to a lesser extent than larger organisations, despite the fact that small museums were the most prevalent group in the sample. Similarly, the uptick in medium sized museum in uploads in 2022 evident in was caused by the Hastings Museum and Art Gallery posting 153 short videos over a three-month period and was also excluded in .
Audience reception
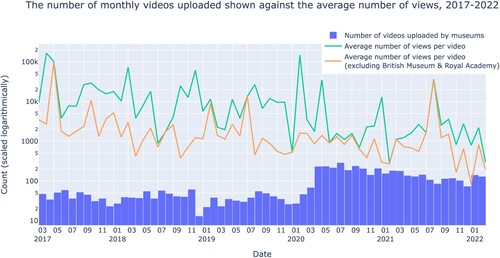
further explores the increase in uploads in 2020 by comparing the number of uploads with the average number of views in a given month. A peak in the number of views in February 2020 again highlights the limitations of both the sample and the metric, as this outlier is the result of one video uploaded by the Royal Academy of Arts that received 6.6 million views. There is a smaller second spike in May that is due to a video published by the British Museum that had 7.3 million views, but its impact is partially offset by the increase in uploads. Due to the lack of data on when these videos reached their peak popularity, it is likely although not conclusive, that their success was partially bolstered by the introduction of the lockdowns. Once those two channels were removed, it becomes clear that the remaining museums only saw a small increase in views during the early pandemic.
Figure 6. The number of monthly uploads across all museum channels shown against the average number of views for those videos.
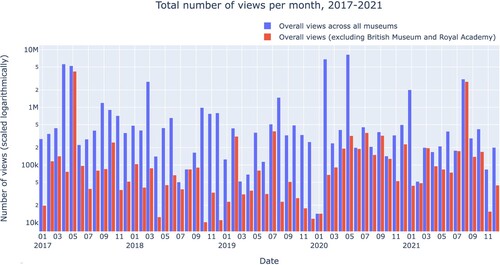
As the number of uploads had risen, it might be assumed that the increased quantity of video content had caused the average number of views per video to drop, while the total number of views had risen. shows that the views did in fact rise for museums over this period, yet considered in the wider context of the last five years (), it becomes evident that this growth within the bounds of usual fluctuations and is not necessarily caused by the pandemic. Notably, the rise in views during the pandemic is a return to levels seen in 2017 and was preceded by a significant drop in the number of views between 2018 and 2020.
Figure 7. The number of views each month across all museum channels over the past 2 years.
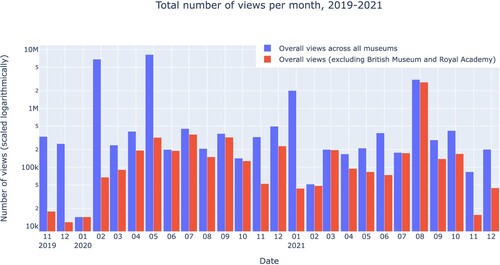
Figure 8. The number of views each month across all museum channels over the past 5 years.
Museum output
In this broader context, the more remarkable aspect of the pandemic is not the audience reception, but museums’ responses. Looking at the number of uploads over a decade (), it is evident that the lockdown had an enormous impact on how museums use YouTube. In addition to changes in the how often museums were uploading videos, the type of content produced also shifted over the course of the pandemic. highlights that the proportion of ‘People & blogs’ content uploaded between March 2020 to March 2021 increased significantly in comparison to the previous year.
Figure 9. The number of monthly video uploads across all museum channels over the past 10 years.
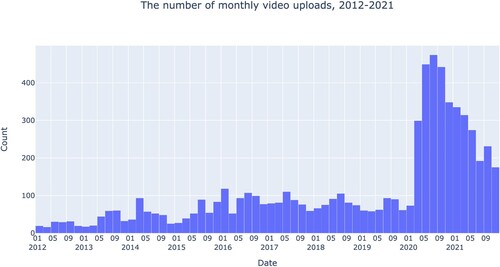
Table 6. The proportion of different category of uploaded videos compared between 2019, 2020, and 2021 (year beginning 01/03).
‘Education’ videos were the most frequently uploaded over the three-year period, and also received the highest average number of views (). Although the average number of views each ‘Education’ video received in 2020 shows a drop from the previous year, the overperforming video by the Royal Academy of Arts was in the same category, raising the mean for 2019. This single video also affected the yearly average, while the impact of similar outliers in 2020 were mitigated by the large number of videos uploaded. An inspection of the ‘Education’ uploads by month, and the fact that the category outperforms the overall average in 2020, both suggest that the decrease in average views was due to the outliers rather than indicative of a drop in popularity. ‘Education’ is also the most common category in the top fifty preforming videos of 2020 ().
Figure 10. The content categories of the top 50 preforming videos of between March 2020 and March 2021.
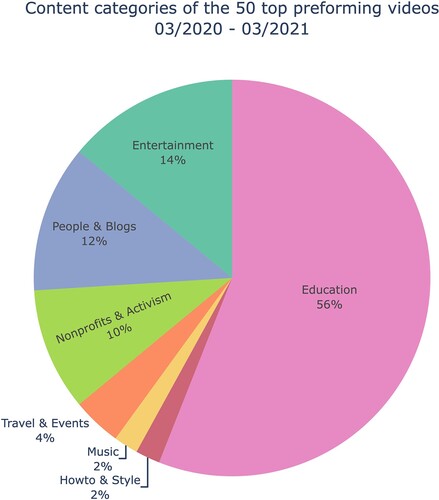
Table 7. Mean number of views per video separated by video category compared between 2019, 2020, and 2021 (year beginning 01/03).
The same figures show that between 2019 and 2021, ‘Entertainment’ had the second highest number of average views per video and the highest over the past year. Unlike ‘Education’, does not correspond with the number of ‘Entertainment’ videos museums have uploaded; from 2019 to 2022 it was only the 5th, 6th, and 4th most uploaded video category respectively. It is also notable that while more ‘People & blogs’ videos were produced over the pandemic, they did not perform particularly well. Investigating the statistic further found that 92.8% of those videos were uploaded by medium and small museums, making it difficult to identify why they performed poorly: it may be due to the small audience of the size of the channels uploading them; the inability to gather and respond to channel statistics; or a lack of resources to produce other types of content in lockdown conditions.
Discussion
The dominant narrative over the course of the pandemic was that uploading virtual tours and online exhibitions to a platform such as YouTube offers several advantages to small museums: they offer hosting infrastructure for free; are relatively easy to use; and give museums access to large ‘built-in’ audiences (UNESCO Citation2020). Yet, our research has highlighted that it is large museums that predominantly benefit from using social media platforms. While the same museums tend to have large followings across multiple platforms, it is unclear if this is because popularity on one platform makes it easier to establish a larger following on another, or if it is merely that the same museums have the resources, expertise, and content to reach a wider audience.
The resources available to larger museums were perhaps most evident in their response to site closures compared to small museums. A UNESCO report found that at the start of the pandemic ‘a large number of institutions have also put digital productions, applications and games from previous exhibitions back online to give them a new lease on life’(Citation2020, 15–16). The use of previously digitised resources enabled museums with existing digital assets and infrastructure to adapt quickly, exacerbating the already prevalent digital inequality (François Citation2019). Although most museums were able to increase the number of videos uploaded by May 2020, this did not correlate with a rise in the number of views for the majority of museums. This supports the initial findings of a NEMO survey published during the first months of the pandemic suggested that ‘4 out of 5’ museums had increased their digital services, but only ‘2 out of 5’ had seen an increase in online visits (Citation2020, 2–3). The same NEMO survey also highlights the prevalence of educational content, with museums reporting that ‘both educational and collections related materials, including video and film content, were most popular with online audiences’ (NEMO Citation2020, 3).
Considering the cultural context, it is possible that some museums prioritised the services they were providing to their existing visitors over the need to expand their audience. This may explain why ‘Education’ was the most frequently uploaded category, but ‘Entertainment’ – which had a high average number of views – was less frequent. With many museums facing permanent closure and seeking financial aid, the ‘essential part’ museums play in communities and their ability to provide cultural services online became a matter of urgency (International Council of Museums (ICOM) Citation2020; Samaroudi, Echavarria, and Perry Citation2020). The conditions of the pandemic, combined with the rise in prominence of the Black Lives Matter movement and the discussions surrounding the toppling of the Edward Colston statue in June 2020, saw many museums actively engaged with their local communities (Frost Citation2021; Siddique and Skopeliti Citation2020).
The reasoning behind what museums have uploaded would be an interesting avenue of further research, and our paper’s data orientated approach would benefit from follow up interviews with museum practitioners who could contextualise the dataset. It would also be valuable to situate the responses of U.K. museums within the wider museum sector. While we have focused on creating a human-validated comprehensive dataset, using our method, it would be possible to scrape the 48,479 European museums or 24,906 North American museums listed on TripAdvisor without encountering any data limits or fees. As TripAdvisor is predominantly an English-language platform, it is unsurprisingly that the review coverage in Europe and North America is more comprehensive. Studies investigating other continents would benefit from additional data to validate their findings: the site only has 5,668 museums listed in South America; 2,520 in Australia; 1,657 in Africa; and the entirety of Asia has a total of 20,112 listings.
On any continent, the contextual data would be inconsistent between countries, however, such a large dataset would be invaluable in understanding trends in social media content. International data would also clearly show the effect of COVID-19, as lockdown restrictions were enforced at different times in each country.
Conclusion
With a representative sample of 315 museums, our paper is the largest and most comprehensive exploration of U.K. museums’ online presence. It has found a significant digital disparity amongst museums, supporting the findings of NEMO and UNESCO surveys conducted during the pandemic (NEMO Citation2020; UNESCO Citation2020). It further builds on this research, using a representative sample to address the disproportionate focus on larger museums (Camarero, Garrido, and José Citation2016). As such, it has emphasised the extent and likely predictors of this inequality; one in ten U.K. museums have no independent online presence, with neither a dedicated website nor social media account on any platform. Local authorities facilitate online participation for many museums with the lowest levels of digital participation – a disproportionate number of which are Scottish, Welsh, and Northern Irish.
Popularity across social media platforms is highly correlated, and a larger museum size correlates with a larger following on every platform. This trend was investigated in greater depth on YouTube, which found that for the majority of museums, uploading videos had failed to expand their audience reach. With half of the sampled channels having less than 46 subscribers, our paper has made clear that a ‘built-in’ audience does not guarantee a large one. Most significantly, our research indicates that – contrary to museum practitioners’ accounts and prior expectations – the outbreak of COVID-19 did not result in an increase in views for the vast majority of museum YouTube channels. This discrepancy highlights the value of quantitative benchmarks and suggests that a sector-wide retrospective analysis of the other platforms will be crucial in understanding the impact of the pandemic on museums and their audiences. In its investigation of museums’ YouTube content, our paper has identified a number of trends:
The pandemic and consequent lockdowns resulted in a large increase in the number of videos uploaded to YouTube.
Large- and medium-sized museums were able to response faster to the perceived demand for content, uploading more videos in a shorter time frame than small museums.
The content uploaded the YouTube changed over the course of the pandemic, with museums producing more ‘People & blogs’ video content – although this category did not perform well.
Only the two largest museums in the sample saw an increase in the number of views during the first lockdown. For other museums, their increased uploads to YouTube did not result in an increase in the number of views their channels received.
Museum channels saw a drop in the number of views between 2018 and 2020 but rose to 2017 levels again in 2021.
This dataset has corroborated much of the survey and interview data gathered over the course of the pandemic and has provided quantitative evidence of trends already identified by museum practitioners. Yet, it is in the discrepancies between museums’ perception of audience demand and the data that provides the most interesting avenues for further research.
Geolocation
United Kingdom (U.K.).
Acknowledgements
The authors would like to thank the reviewers for contributing their time and effort to improving this paper.
Data availability statement
The data that support the findings of this study are openly available in Zenodo at http://doi.org/10.5281/zenodo.7786326.
Disclosure statement
No potential conflict of interest was reported by the author(s).
Correction Statement
This article has been republished with minor changes. These changes do not impact the academic content of the article.
Additional information
Funding
Notes on contributors
Ellen Charlesworth
Ellen Charlesworth is an AHRC funded PhD candidate at the School of Modern Languages and Cultures at Durham University. Having studied Art History at the Courtauld Institute of Art and then Data Science at Birkbeck, she gained experience designing and evaluating online exhibitions working with the Birkbeck Knowledge Lab, Museum of the Home, and the Venerable English College. Her current research explores how cultural engagement can be measured online and examines museums' websites and social media use. This work has been presented at international conferences and received coverage in the Austrian national newspaper Der Standard.
Andrew M. Beresford
Andrew Beresford (BA, MA, PhD London) has served as Associate Director of Durham University's Institute of Medieval and Early Modern Studies (IMEMS) and as Associate Director of the Centre for Visual Arts and Cultures (CVAC). He is also a member of the Institute for Medical Humanities and the Zurbarán Centre. Within County Durham, his interest in Spanish art has led to a series of collaborations with The Bowes Museum and The Auckland Project, notably in the context of the Impact Case Study Spanish Art in County Durham, which explores ways in which Spanish art can be made more accessible to viewing publics. Further afield, he is a member of the Association of Hispanists of Great Britain and Ireland, the Sociedad de Estudios Medievales y Renacentistas, the Medieval Hispanic Research Seminar, the North American Catalan Society, the Ibero-Medieval Association of North America, and ARTES, the Iberian and Latin American Visual Culture Group.
Claire Warwick
Claire Warwick is a Professor of Digital Humanities in the Department of English at Durham University, where she was Pro-Vice-Chancellor: Research from 2014-2019. She is also the co-Director of the Durham Institute for Data Science (IDAS). Her research is concerned with the use of digital resources in the humanities and cultural heritage; in digital reading; how physical and digital information spaces are used; and on the history of cyberspace. She was the founding Director of the UCL Centre for Digital Humanities and Head of UCL Department of Information Studies. Her PhD, from Cambridge, was in English Literature and she began her career in digital humanities with a postdoctoral position at Oxford University's Humanities Computing Unit, followed by a lectureship at Sheffield University iSchool.
Leonardo Impett
Dr Leonardo Impett is a University Assistant Professor in Digital Humanities and convenor of the MPhil in Digital Humanities. He was previously Assistant Professor of Computer Science at Durham University. Leonardo has a background in information engineering and machine learning, having worked or studied at the Cambridge Machine Learning Lab, the Cambridge Computer Lab's Rainbow Group, and Microsoft Research Cairo. His PhD, with Sabine Süsstrunk and Franco Moretti at EPFL, was on the use of computer vision for the 'distant reading' of the history of art. In 2018 Leonardo was a DH fellow at Villa I Tatti – the Harvard University Center for Italian Renaissance Studies, from 2018-2020 he was Scientific Assistant, then Scientist, at the Bibliotheca Hertziana - Max Planck Institute for Art History in Rome. Alongside his research in digital art history, he frequently works with machine learning in arts and culture, including for the Liverpool Biennial, the Royal Opera House, and the Whitney Museum of American Art.
Notes
1 The data describing high levels of online participation of audiences from Black, Asian and Mixed ethnic backgrounds was gathered in October and November of 2020, and likely reflects an increase in online engagement following the murder of George Floyd and the ongoing work of the Black Lives Matter movement (Mantell and Turpin Citation2020, 24; BBC Citation2020).
2 Fiona Candlin et al. (Citation2019, 57) classified museums into four categories based on the annual number of visits: ‘small (0–10,000 visits); medium (10,001–50,000 visits); large (50,001 to one million visits); and huge (over one million visits)’.
3 In the U.K., local authorities – most commonly local councils – are responsible for delivering a range of services including social care, housing, and waste collection in a specific region. They predominantly receive funding through council tax, business rates, and government grants (Local Government Association Citation2022).
4 Authentication tokens were not needed for the YouTube Data API, and the API was queried with get requests.
References
- Adams, Geraldine Kendall. 2022. “Museums and Galleries Close as Coronavirus Emergency Intensifies.” Museums Association. March 17. https://www.museumsassociation.org/museums-journal/news/2020/03/17032020-museum-closures-coronavirus-covid-19/.
- Agostino, Deborah, Michela Arnaboldi, and Antonio Lampis. 2020. “Italian State Museums During the COVID-19 Crisis: From Onsite Closure to Online Openness.” Museum Management and Curatorship 35 (4): 362–372. doi:10.1080/09647775.2020.1790029.
- Alexa and Amazon. 2022. “Retiring Alexa.Com on May 1, 2022.” Alexa Support. https://support.alexa.com/hc/en-us/articles/4410503838999-We-will-be-retiring-Alexa-com-on-May-1-2022.
- Arts Council England. 2021. “List of Accredited Museums in the UK, Channel Islands, and Isle of Man.” December 21. https://www.artscouncil.org.uk/document/list-accredited-museums-uk-channel-islands-and-isle-man.
- Ballatore, Andrea, and Fiona Candlin. 2022. “A Geography of UK Museums.” Transactions of the Institute of British Geographers, November, tran.12578. doi:10.1111/tran.12578.
- Bayer, Alanna. 2014. Evangelizing the “Gallery of the Future”: A Critical Analysis of the Google Art Project Narrative and Its Political, Cultural and Technological Stakes. London, ON: The University of Western Ontario. 2239. Electronic Thesis and Dissertation Repository. https://ir.lib.uwo.ca/etd/2239.
- Baym, Nancy K. 2013. “Data Not Seen: The Uses and Shortcomings of Social Media Metrics.” First Monday 18 (10). doi:10.5210/fm.v18i10.4873.
- Bethlehem, Jelke. 2010. “Selection Bias in Web Surveys.” International Statistical Review 78 (2): 161–188. doi:10.1111/j.1751-5823.2010.00112.x.
- Birkbeck Knowledge Lab. 2021. “About the Project: Mapping Museums.” September 2021. https://museweb.dcs.bbk.ac.uk/about.
- British Broadcasting Corporation (BBC). 2020. “George Floyd Death: Thousands Join London Protest.” BBC News, June 3, sec. UK. https://www.bbc.com/news/uk-52907101.
- Camarero, Carmen, María José Garrido, and Rebeca San José. 2016. “Efficiency of Web Communication Strategies: The Case of Art Museums.” International Journal of Arts Management 18 (2): 42–62. https://www.jstor.org/stable/44989650
- Candlin, Fiona, Jamie Larkin, Andrea Ballatore, and Alexandra Poulovassilis. 2019. “The Missing Museums: Accreditation, Surveys, and an Alternative Account of the UK Museum Sector.” Cultural Trends 29 (1): 50–67. doi:10.1080/09548963.2019.1690392.
- Cha, Meeyoung, Haewoon Kwak, Pablo Rodriguez, Ahn Yong-Yeol, and Sue Moon. 2009. “Analyzing the Video Popularity Characteristics of Large-Scale User Generated Content Systems.” IEEE/ACM Transactions on Networking 17 (5): 1357–1370. doi:10.1109/TNET.2008.2011358.
- Chatzopoulou, Gloria, Cheng Sheng, and Michalis Faloutsos. 2010. “A First Step Towards Understanding Popularity in YouTube.” In 2010 INFOCOM IEEE Conference on Computer Communications Workshops, 1–6. San Diego, CA, USA: IEEE. doi:10.1109/INFCOMW.2010.5466701.
- Clearbit. 2020. “API Documentation for Developers.” API Reference. March 2020. https://dashboard.clearbit.com/docs.
- Cochran, William G. 1977. “The Estimation of Sample Size.” In In Sampling Techniques, 3rd ed. 72–90. Probability and Mathematical Statistics, New York, NY, USA: John Willey.
- Crunchbase Data. 2022. “API Documentation.” Access Crunchbase Data. March 2022. https://data.crunchbase.com/docs/using-the-api.
- Das, Keya, and Rahmatullah Imon. 2016. “A Brief Review of Tests for Normality.” American Journal of Theoretical and Applied Statistics 5 (1): 5. doi:10.11648/j.ajtas.20160501.12.
- Dongo, Irvin, Yudith Cadinale, Ana Aguilera, Fabiola Martínez, Yuni Quintero, and Sergio Barrios. 2021. “Web Scraping Versus Twitter API: A Comparison for a Credibility Analysis.” In Proceedings of the 22nd International Conference on Information Integration and Web-Based Applications & Services, 263–73. IiWAS ‘20. New York, NY, USA: Association for Computing Machinery. doi:10.1145/3428757.3429104.
- Enhuber, Marisa. 2015. “Art, Space and Technology: How the Digitisation and Digitalisation of Art Space Affect the Consumption of Art—a Critical Approach.” Digital Creativity 26 (2): 121–137. doi:10.1080/14626268.2015.1035448.
- Facebook Developers. 2022a. “Facebook Graph API.” March 2022. https://developers.facebook.com/docs/graph-api/.
- Facebook Developers. 2022b. “Facebook Graph API: Permissions Reference.” Facebook for Developers. March 2022. https://developers.facebook.com/docs/permissions/reference/.
- Facebook Developers. 2022c. “Instagram Graph API.” March 2022. https://developers.facebook.com/docs/instagram-api/.
- Figueiredo, Flavio, Fabrício Benevenuto, and Jussara M. Almeida. 2011. “The Tube Over Time: Characterizing Popularity Growth of Youtube Videos.” In Proceedings of the 4th ACM International Conference on Web Search and Data Mining - WSDM ‘11, 745–54. Hong Kong, People’s Republic of China: Association for Computing Machinery. doi:10.1145/1935826.1935925.
- Fisher, Matthew, and Bill Adair. 2011. “Online Dialogue and Cultural Practice: A Conversation.” In In Letting Go?: Sharing Historical Authority in a User-Generated World, edited by Bill Adair, Laura Koloski, and Benjamin Filene, 44–55. Walnut Creek, CA: Left Coast Press.
- François, Mairesse. 2019. “Report on the Implementation of the UNESCO 2015 Recommendation on Museums & Collections: Recommendation Concerning the Protection and Promotion of Museums and Collections, Their Diversity and Their Role in Society.” Programme and Meeting Document CLT-2019/RP/1 Rev. Paris, FR: UNESCO Digital Library. https://unesdoc.unesco.org/ark:/48223/pf0000371549.locale = en.
- Frost, Stuart. 2021. “Pandemic, Protests and Building Back: 20 Months at the British Museum.” Museum International 73 (3–4): 70–83. doi:10.1080/13500775.2021.2016277.
- Gladysheva, Daria, Jessica Verboom, and Payal Arora. 2014. “The Art Tube: Strategies, Perceptions and Outcomes of Museums’ Online Video Portals.” Digital Culture and Education 6 (4): 393–408. hdl.handle.net/1765/77416.
- Glez-Peña, Daniel, Anália Lourenço, Hugo López-Fernández, Miguel Reboiro-Jato, and Florentino Fdez-Riverola. 2014. “Web Scraping Technologies in an API World.” Briefings in Bioinformatics 15 (5): 788–797. doi:10.1093/bib/bbt026.
- Gombault, Anne, and Oihab Allal-Chérif. 2021. “The Expansion of Virtual Spaces of Superstar and Star Museums During the COVID-19 Lockdown.” In The Metamorphosis of Cultural and Creative Organizations, 1st ed., edited by Federica De Molli and Marilena Vecco, 192–207. London: Routledge.
- Google Developers. 2022. “API Documentation: YouTube Data API.” January 25. https://developers.google.com/youtube/v3/docs.
- Graf, Alexander. 2022. “Instaloader Documentation.” March 2022. https://instaloader.github.io/.
- Gran, Anne-Britt, Nina Lager Vestberg, Peter Booth, and Anne Ogundipe. 2019. “A Digital Museum’s Contribution to Diversity – a User Study.” Museum Management and Curatorship 34 (1): 58–78. doi:10.1080/09647775.2018.1497528.
- Hart, Robert. 2022. “Clearview AI Fined $9.4 Million In U.K. For Illegal Facial Recognition Database.” Forbes, May 23, sec. Business. https://www.forbes.com/sites/roberthart/2022/05/23/clearview-ai-fined-94-million-in-uk-for-illegal-facial-recognition-database/.
- Henry, Didier. 2021. “TwiScraper: A Collaborative Project to Enhance Twitter Data Collection.” In Proceedings of the 14th ACM International Conference on Web Search and Data Mining, 886–89. New York, NY, USA: Association for Computing Machinery. doi:10.1145/3437963.3441716.
- International Council of Museums (ICOM). 2020. “Statement on the Necessity for Relief Funds for Museums during the COVID-19 Crisis.” International Council of Museums. April 2. https://icom.museum/en/news/statement-on-the-necessity-for-relief-funds-for-museums-during-the-covid-19-crisis/.
- Jiang, Lu, Yajie Miao, Yi Yang, Zhenzhong Lan, and Alexander G. Hauptmann. 2014. “Viral Video Style: A Closer Look at Viral Videos on YouTube.” In Proceedings of International Conference on Multimedia Retrieval, 193–200. ICMR ‘14. New York, NY, USA: Association for Computing Machinery. doi:10.1145/2578726.2578754.
- Kamiyama, Noriaki, and Masayuki Murata. 2019. “Reproducing Popularity Distribution of YouTube Videos.” IEEE Transactions on Network and Service Management 16 (3): 1100–1112. doi:10.1109/TNSM.2019.2914222.
- Local Government Association. 2022. “What Is Local Government?” August 9. https://www.local.gov.uk/about/what-local-government.
- Malik, Haroon, and Zifeng Tian. 2017. “A Framework for Collecting YouTube Meta-Data.” Procedia Computer Science, The 8th International Conference on Emerging Ubiquitous Systems and Pervasive Networks (EUSPN 2017) / The 7th International Conference on Current and Future Trends of Information and Communication Technologies in Healthcare (ICTH-2017) / Affiliated Workshops, 113 (January): 194–201. doi:10.1016/j.procs.2017.08.347.
- Mantell, Oliver, and Richard Turpin. 2020. Summary Report’. COVID-19 Cultural Participation Monitor. London: The Audience Agency. https://www.theaudienceagency.org/asset/2434.
- Moran, Gillian, Laurent Muzellec, and Devon Johnson. 2019. “Message Content Features and Social Media Engagement: Evidence from the Media Industry.” Journal of Product & Brand Management 29 (5): 533–545. doi:10.1108/JPBM-09-2018-2014.
- Murphy, Oonagh. 2014. “Increasing the Digital Literacy of Museum Professionals: Digital Innovation and the Museum Sector in Northern Ireland.” Doctoral, University of Ulster. https://ethos.bl.uk/OrderDetails.do?uin = uk.bl.ethos.629645.
- NEMO (Network of European Museum Organisations). 2020. “Survey on the Impact of the COVID-19 Situation on Museums in Europe: Final Report.” https://www.ne-mo.org/fileadmin/Dateien/public/NEMO_documents/NEMO_COVID19_Report_12.05.2020.pdf.
- Newman, Tabetha, Helen Beetham, and Stuart Church. 2020. DASH Survey Results 2020: Describing the Digital Attitudes, Skills and Organisational Support of People Working Across the UK Heritage Sector’. Digital Attitudes and Skills in Heritage. London: Timmus Research, The National Lottery Heritage Fund. https://www.heritagefund.org.uk/sites/default/files/media/attachments/DASH%20report%20draft%20v13.1.5.pdf.
- Noehrer, Lukas, Abigail Gilmore, Caroline Jay, and Yo Yehudi. 2021. “The Impact of COVID-19 on Digital Data Practices in Museums and Art Galleries in the UK and the US.” Humanities and Social Sciences Communications 8 (1): 236. doi:10.1057/s41599-021-00921-8.
- Nuccio, Massimiliano, and Enrico Bertacchini. 2021. “Data-Driven Arts and Cultural Organizations: Opportunity or Chimera?” European Planning Studies, 1–18. doi:10.1080/09654313.2021.1916443.
- Nussbaum, E. Michael. 2014. Categorical and Nonparametric Data Analysis: Choosing the Best Statistical Technique. New York, NY: Routledge. doi:10.4324/9780203122860.
- Parab, Shraddha, and Supriya Bhalerao. 2010. “Choosing Statistical Tests.” International Journal of Ayurveda Research 1 (3): 187. doi:10.4103/0974-7788.72494.
- Pinto, Henrique, Jussara M. Almeida, and Marcos A. Gonçalves. 2013. “Using Early View Patterns to Predict the Popularity of Youtube Videos.” In Proceedings of the 6th ACM International Conference on Web Search and Data Mining, 365–74. WSDM ‘13. New York, NY, USA: Association for Computing Machinery. doi:10.1145/2433396.2433443.
- Richardson, Leonard. 2022. “Documentation v4.11.0.” Beautiful Soup. March 2022. https://www.crummy.com/software/BeautifulSoup/bs4/doc/.
- Roesslein, Joshua. 2022. “Tweepy Documentation.” March 2022. https://docs.tweepy.org/en/stable/.
- Rousseeuw, Peter J., and Mia Hubert. 2011. “Robust Statistics for Outlier Detection.” WIRES Data Mining and Knowledge Discovery 1 (1): 73–79. doi:10.1002/widm.2.
- Samaroudi, Myrsini, Karina Rodriguez Echavarria, and Lara Perry. 2020. “Heritage in Lockdown: Digital Provision of Memory Institutions in the UK and US of America During the COVID-19 Pandemic.” Museum Management and Curatorship 35 (4): 337–361. doi:10.1080/09647775.2020.1810483.
- Selenium Developers. 2022. “Documentation.” Selenium, WebDriver. March 2022. https://www.selenium.dev/documentation/.
- Siddique, Haroon, and Clea Skopeliti. 2020. “BLM Protesters Topple Statue of Bristol Slave Trader Edward Colston.” The Guardian, June 7, sec. UK news. https://www.theguardian.com/uk-news/2020/jun/07/blm-protesters-topple-statue-of-bristol-slave-trader-edward-colston.
- Sobel, Benjamin L. W. 2020. “A New Common Law of Web Scraping.” Lewis & Clark Law Review 25 (1): 147. doi:10.2139/ssrn.3581844.
- The Audience Agency. 2021. “Digital Audience Survey: Findings.” The Audience Agency. June 2021. https://www.theaudienceagency.org/evidence/digital-audience-survey-findings.
- Thiele, Daniel. 2022. “Pandemic Populism? How Covid-19 Triggered Populist Facebook User Comments in Germany and Austria.” Politics and Governance 10 (1): 185–196. doi:10.17645/pag.v10i1.4712
- Topaz, Chad M., Bernhard Klingenberg, Daniel Turek, Brianna Heggeseth, Pamela E. Harris, Julie C. Blackwood, C. Ondine Chavoya, Steven Nelson, and Kevin M. Murphy. 2019. “‘Diversity of Artists in Major U.S. Museums’. Edited by Christopher M. Danforth.” PLOS ONE 14 (3): e0212852. doi:10.1371/journal.pone.0212852.
- Travkina, Ekaterina, and Pierluigi Sacco. 2020. Culture Shock: COVID-19 and the Cultural and Creative Sectors’. Tackling Coronavirus (COVID-19). London: Organisation for Economic Co-operation and Development (OECD). https://apo.org.au/node/308392.
- Twitter. 2022. “Twitter Terms of Service.” June 10. https://twitter.com/content/twitter-com/legal/en/tos.
- Twitter Developers. 2022. “API Documentation: Twitter.” March 2022. https://developer.twitter.com/en/docs/twitter-api.
- UNESCO (United Nations Educational, Scientific and Cultural Organization). 2020. Museums Around the World in the Face of COVID-19’. 0000373530. Paris, FR: UNESCO Digital Library. https://unesdoc.unesco.org/ark:/48223/pf0000373530.
- Venturini, Tommaso, and Richard Rogers. 2019. ““API-Based Research” or How Can Digital Sociology and Journalism Studies Learn from the Facebook and Cambridge Analytica Data Breach.” Digital Journalism 7 (4): 532–540. doi:10.1080/21670811.2019.1591927.
- Vito, Giuseppe, Alessandra Sorrentini, Davide Di Palma, Vincenzo Raiola, and Maria Tabouras. 2017. “New Frontiers of Online Communication of Small and Medium Museums in Campania Region, Italy.” American Journal of Industrial and Business Management 07 (09): 1058–1078. doi:10.4236/ajibm.2017.79075.
- Walmsley, Ben, Abigail Gilmore, Dave O’Brien, and Anne Torreggiani. 2022. “Impacts of Covid-19 on the UK Cultural Sector and Where We Go from Here.” Culture in Crisis. The Centre for Cultural Value. https://www.culturehive.co.uk/CVIresources/culture-in-crisis-impacts-of-covid-19/.
- Zafiropoulos, Kostas, Vasiliki Vrana, and Konstantinos Antoniadis. 2015, December. “Use of Twitter and Facebook by Top European Museums.” doi:10.5281/ZENODO.376326.