
 ?Mathematical formulae have been encoded as MathML and are displayed in this HTML version using MathJax in order to improve their display. Uncheck the box to turn MathJax off. This feature requires Javascript. Click on a formula to zoom.
Abstract
A causal association was found between higher levels of corruption and lower levels of satisfaction with local and national governments. However, interaction term analysis provides suggestive evidence that: first, as public service satisfaction increases, the effects of corruption change from negative values to positive values for both local and national governments; second, as political situations improve, the negative effects of corruption diminish for both local and national governments; and, third, as the economic situation improves, the negative effects of corruption diminish for local, but not for national governments.
Citizens’ evaluation of their government’s performance is associated with the degree of legitimacy and support that they extend to it (Lipset Citation1959; Weatherford Citation1992; Przeworski et al. Citation1993; Camacho Citation2014; Stockemer & Sundström Citation2013). Citizens tend to support their government if they view its performance as satisfactory. Conversely, they are likely to withdraw their support if they view the government’s performance as unsatisfactory. Thus, satisfaction with government performance has crucial implications with respect to peoples’ beliefs about the legitimacy of the state, its ruling politicians and political parties, as well as with respect to their faith in democracy as a system of governance (Weitz-Shapiro Citation2008; Harmel & Yeh Citation2011; Corral & Orcés Citation2013).
In turn, one of the most important factors affecting satisfaction with government performance is corruption. In well-established democracies, corruption is linked to a reduction in government support (Bailey & Paras Citation2006; Wagner et al. Citation2009). Importantly, perceptions regarding the honesty and fairness of government are found to be more important than other aspects of government performance such as efficiency and effectiveness (Putnam Citation1993; Pharr et al. Citation2000). Anderson and Tverdova found that corruption is one of the most important aspects of government performance used by people ‘to judge political institutions’ (Anderson & Tverdova Citation2003, p. 104). According to Holmes (Citation2006), incidents of corruption have led to the collapse of governments in a number of established democracies.
However, no consensus has been reached regarding the effects of corruption in post-communist and developing countries. An important strand of the literature emphasises the negative effects of corruption by supporting the so-called ‘sands the wheels’ hypothesis. According to this idea, corruption undermines trust in institutions and increases tolerance of offering and accepting bribes in public institutions (Habibov et al. Citation2017). It has been both empirically and theoretically proven that corruption has an immensely negative effect on development around the world (Chitakunye et al. Citation2015). Several authors assert that corruption tends to discourage investment and economic growth, aggravate the problems of informal economic activities, create obstacles to economic and political reform, exacerbate the inequality between the rich and the poor, significantly reduce satisfaction with public services and, in the long run, cause considerable degradation of living standards (Justesen & Bjørnskov Citation2014; Habibov Citation2016; Habibov & Cheung Citation2016). In addition, corruption results in negative citizen perceptions of public service performance, thus reducing their overall level of trust in the government (Park & Blenkinsopp Citation2011). In post-communist countries, corruption is also linked to lower levels of support for the current regime (Grosjean Citation2011). Furthermore, lower levels of citizen satisfaction with the government undermine civil society, which tends to be fragile in post-communist countries, and increase the likelihood of engagement in informal economic activities (Wallace & Latcheva Citation2006; Zakaria Citation2013).
Following the ‘sands the wheels’ hypothesis, corruption should also have a negative effect on government satisfaction. Indeed, this has been reported by several studies that have focused directly on the link between corruption and government satisfaction. Thus, in South Korea, perceived corruption has led to the erosion of satisfaction with the government (Park & Blenkinsopp Citation2011). Studies of Latin American countries have reported similar findings (Hiskey & Seligson Citation2003; Weitz-Shapiro Citation2008). In China, corruption has been reported to have a strong negative effect on satisfaction with local governments, although the central government was found to be shielded from blame (Harmel & Yeh Citation2011).
Another important strand of the literature stresses the positive effects of corruption. According to this ‘grease the wheels’ hypothesis, corruption should be tolerated inasmuch as it provides an effective way of mitigating the distortions produced by ineffective bureaucratic procedures (Habibov et al. Citation2017). This hypothesis can be traced to the works of Leff (Citation1964) and Huntington (Citation1968), who advanced two arguments explaining the positive effects of corruption. First, corruption is a way of avoiding bureaucratic obstacles, especially in countries with burdensome and often changing regulations. Second, bribes provide an important incentive to bureaucrats to work, particularly in countries where public service is not well developed (Aidt Citation2003; Green Citation2011). Such competition may allow for a more efficient distribution of scarce resources.
The positive effects of corruption in terms of increased efficiency were markedly noticeable under the command-style economic system in communist countries (Holmes Citation2000). Management-level corruption increased the efficiency of central planning by mitigating its rigidness (Nye Citation1967). Additionally, well-developed forms of corruption were used successfully to alleviate shortages of goods caused by the inefficient distribution of goods and distorted prices (Levy Citation2007). High levels of corruption have led to demands for economic and political reforms in post-communist countries (Grosjean Citation2011).
Along the same lines, recent studies report that even if the effects of corruption are negative, the magnitude of the negative effect is lower in nations, such as in post-communist countries, where government institutions are weak (Anderson & Tverdova Citation2003; Méon & Weill Citation2010). Furthermore, the effects of corruption are less damaging if citizens are satisfied with the services they receive (Lavallée et al. Citation2008). Following the ‘grease the wheels’ hypothesis, it is not surprising that citizens in developing and post-communist countries support highly corrupt governments if they perceive that the services they receive are effective, or if they believe that the political and economic situation is improving (Manzetti & Wilson Citation2006; Weitz-Shapiro Citation2008; Winters & Weitz-Shapiro Citation2013).
Yet another perspective, articulated as the ‘culture of corruption’ hypothesis, suggests that corruption is heavily influenced by cultural norms (Miller et al. Citation2001; Fisman & Miguel Citation2007; Lee & Guven Citation2013). As such, a ‘culture of corruption’ can lead to the situation where corruption may be viewed as the norm rather than as a crime and, consequently, is widely accepted and tolerated (Smith Citation2008; Turex Citation2011). In post-communist countries, the levels of corruption inherited from the communist era increased during transition and came to be associated with insufficient remuneration for the government sector, ever-changing and burdensome regulations, and blurred lines between the private and public realms (Skaaning Citation2009; Libman & Obydenkova Citation2013). Because post-communist countries have high levels of petty corruption, such as having to pay or give gifts to workers in the public health and education sectors, such corruption is typically not viewed negatively and is generally accepted. Post-communist countries generally have higher levels of corruption in comparison with other countries with similar income levels (Suhrcke Citation2000; Bowser Citation2001). Since the ‘culture of corruption’ is seen as routine and even essential, it may not significantly affect the level of citizen satisfaction with the government.
Thus, in general, a variety of studies has focused directly on the link between corruption and government satisfaction in developing and post-communist countries. Some of these studies have yielded contradictory results, reporting that corruption has either a positive or negative effect on government satisfaction, while other studies report no effect at all. Furthermore, the majority of these studies used single-stage regression methods with cross-sectional data. Such an approach cannot identify whether corruption affects government satisfaction or vice versa, or whether a third unobservable variable causes simultaneous changes in government satisfaction and corruption. Also, most of these studies examined the effects of corruption on only one level of government (such as local), while the effects of corruption on national governments have not been thoroughly investigated.
This article intends to contribute to the literature in the following ways. First, we attempt to transcend the limitations of previous studies by using instrumental variable (IV) regression to address reverse causality and unobserved variable problems to highlight the causal association between corruption and satisfaction with government. We also include interaction terms in the estimated IV models to test directly how the marginal effects of corruption on satisfaction with government vary according to the extent of satisfaction with services, the economy and politics, as well as support for democracy. Second, we distinguish between the effects of corruption on satisfaction with government at both the local and national levels. To the best of our knowledge, this is one of the first studies to analyse the effects of corruption on government satisfaction using a wide and varied sample of 29 post-communist countries in Eastern Europe and the former Soviet Union.
By focusing our analysis on both corruption and satisfaction with the government, our article contributes to the newly emerging literature on the link between corruption and satisfaction with government (Manzetti & Wilson Citation2006; Weitz-Shapiro Citation2008; Park & Blenkinsopp Citation2011; Winters & Weitz-Shapiro Citation2013). In broader terms, it also contributes to the literature on popular preferences and satisfaction with government policies (Alesina & Fuchs-Schüendeln Citation2007; Dimitrova-Grajzl et al. Citation2012; Habibov Citation2015), as well as the determinants of public support for economic and political reform (Fidrmuc Citation2000; Kim & Pirttilä Citation2006; Grosjean Citation2011; Rovelli & Zaiceva Citation2013).
Method
Study sample
The data sets we used are from the second round of the Life in Transition Survey (LITS) conducted in 2010 by the European Bank for Reconstruction and Development (Steves Citation2011). Our study covers 29 post-communist countries: Albania, Armenia, Azerbaijan, Belarus, Bosnia & Hercegovina, Bulgaria, Croatia, the Czech Republic, Estonia, Georgia, Hungary, Kazakhstan, Kosovo, Kyrgyzstan, Latvia, Lithuania, Macedonia, Moldova, Mongolia, Montenegro, Poland, Romania, Russia, Serbia, Slovakia, Slovenia, Tajikistan, Ukraine and Uzbekistan. The LITS employs a two-stage clustered stratified design to select households for interview. In each country, the list of primary sample units (PSU) created by the respective national governments was employed to stratify each country according to its regions. Through the application of the probability proportion to size rule, approximately between 50 and 75 PSUs were chosen from the list for each country, depending on the size and population density of the country. Next, the random walk technique was used to chose approximately 20 households for interview in each PSU. One respondent from each household was then randomly selected to complete the survey. Approximately 1,000 respondents per country were interviewed by specially trained interviewers.
Outcome variables and predictor
Our focus was to test our hypotheses about the relationship between government satisfaction and corruption at both the local and national levels. Hence, there were two outcome variables: satisfaction with the local government; and satisfaction with the national government. The LITS measures the rating of government satisfaction according to a five-point ordinal scale where 1 is ‘very bad’ and 5 is ‘very good’.
Our predictor variable was corruption. Corruption was measured according to the answers provided by LITS respondents as to whether they had made an unofficial payment or gift (other than any legitimate fees that may have been applicable) while using public services in the last 12 months. Public services include traffic police, civil courts, the issue of official documents (such as passports and property deeds), public primary and secondary education, public vocational education, public healthcare, the provision of unemployment and other social security benefits. Summing up positive answers for each of eight services, we computed the composite index of corruption. The value of this index varied from 0 to 8, with higher values indicating higher degrees of corruption (Cornbach’s α = 0.85). The summary information of outcome, predictor and covariates can be found in .
TABLE 1 Descriptive Statistics
Explanation and operationalisation of covariates influencing satisfaction with the government
One of the most important factors influencing satisfaction with the government is the satisfaction people have with the public services they received (Lavallée et al. Citation2008). To control for the potential effects of satisfaction with public services, we use an additive index that includes seven questions about the respondent’s satisfaction with the quality and efficiency of public services as outlined above. By adding up the responses ‘satisfied’ and ‘very satisfied’, we estimated a continuous variable, ‘public service satisfaction’, which varied from 0 to 8, where higher values indicated a higher degree of public service satisfaction.
We also controlled for socio-economic status, namely, the educational attainments of the respondent and the wealth status of the household. On the one hand, individuals with higher socio-economic status in terms of education and wealth may express higher levels of government satisfaction. At the same time, higher socio-economic status can be a proxy for higher expectations regarding government performance (Lewis & Pattinasarany Citation2009). Consequently, higher status leads to higher expectations. If, however, the expectations of individuals with a higher socio-economic status exceed actual government performance, then higher economic status will become associated with a lower level of government satisfaction.
In addition, we controlled for socio-demographic characteristics, namely, age and gender. The definitions and statistics of these covariates are described in together with the outcome and predictor variables. Finally, to control for unobservable characteristics on the country and PSU levels, we included a set of country and PSU dummies for all the estimated models.
Analytical strategy
As noted in the introductory section, we used IV regression to address reverse causality and omit variable problems. The estimation of IV regression requires an instrument that is correlated with the predictor, corruption. At the same time, such an instrument should not affect the outcome variable, government satisfaction, other than through the predictor. Usefully for our study, the LITS asked individuals if they had paid bribes (our predictor variable) and then asked those who answered positively to clarify the reasons for doing so by choosing one of four options provided: (a) the respondent paid a bribe that was directly solicited by a public official; (b) the respondent was not directly asked to pay, but knew that an informal payment in this situation was expected; (c) the respondent was not directly asked to pay, but wanted to express gratitude; or (d) the respondent offered to pay to get things done.
We chose to use ‘solicited bribe’ as an instrument. This instrument was defined as a binary variable that equalled 1 if the respondent had paid a bribe because he or she had been directly solicited by a public official, and equalled 0 if the respondent initiated the bribe, or had not paid a bribe at all. We selected this instrument specifically because it was unlikely to have an effect on the outcome variables other than through the predictor. This may be illustrated by a situation in which the public official solicits a bribe rather than the respondent making an initial offer. It is unlikely that the official would be aware of the respondent’s individual level of satisfaction with local and national governments (Clausen et al. Citation2011). Furthermore, it is improbable that the official would choose to either solicit or not solicit a bribe based on the respondent’s level of satisfaction with respect to local and national governments. Thus, it is unlikely that the instrument had a direct effect on the outcome variables. Finally, if a public official requested a bribe but the respondent chose not to pay it, then no incidence of corruption would have occurred. In such a case, the possible reduction of trust caused by the bribe that had been solicited (but not paid) is directly controlled by the predictor (corruption = 0), and then transmitted to the outcome via the predictor. Hence, even in this case also, it is unlikely that the instrument had a direct effect on the outcome variable (Habibov & Cheung Citation2016).
Inasmuch as the LITS inquired about corruption in eight types of public services, we summed up the above-described binomial variable ‘solicited bribe’ in an additive index that encompassed all services evaluated by the LITS. The value of the index may vary from 0 (if no bribe had been solicited by public officials) to 8 (if bribes had been solicited in all services). Following this, we correlated this index with the outcome variable, satisfaction with local and national governments. The correlation was negligible, namely, −0.01 for local and 0.00 for national governments, suggesting that the instrument was not directly associated with outcome (Mukaka Citation2012).
In addition, we looked at the situation in which a respondent with a lower level of government satisfaction and, as such, lower expectations of public services, may have been more likely to interpret an uncertain interaction with a public official as a demand for a bribe. However, given such a scenario, the ultimate decision to accept or reject the offered but not actually requested bribe lay with the public official rather than the respondent. To test whether a respondent with a lower level of satisfaction was more likely to interpret an ambiguous interaction with a public official as a request for a bribe, we correlated satisfaction with local and national governments with being asked to pay a bribe. The correlation was low: −0.03 for local and 0.01 for national governments.
Finally, we considered an alternative situation in which a respondent with a low level of satisfaction with the government may choose not to interact with public institutions at all. As a result, such an individual is less likely to be asked to pay any bribes. In reality, however, avoiding contact with public institutions such as law enforcement, traffic police, courts and government offices issuing land and property titles may disadvantage the respondent more than if the respondent had interacted with the institutions and paid the requested bribes. Indeed, the correlation between the frequency of use of public services and satisfaction with local and national governments was negligible, namely, 0.00 for local and 0.02 for national governments.
Thus, the instrument passed the empirical tests required for IV models (Wooldridge Citation2010). The first-stage F statistic is considerably higher than the rule of thumb value of 10, while the minimum eigenvalue statistic is higher than Stock and Yogo’s critical values, suggesting that our instrument is not weak (Stock et al. Citation2002; Stock & Yogo Citation2005). At the same time, significant results of the Durbin–Wu–Hausman tests of endogeneity indicate that IV results should be preferred over single-stage OLS.
Statistical analysis
Since our outcome variables are in the form of an ordinal scale, we estimated the classic IV regression model (Wooldridge Citation2010). Given that we have two outcome variables, satisfaction with the local and the national government, we estimated two IV regression models. All estimations include country and community dummies to control for country and community level fixed effects. The baseline IV regression model can be described as:(1)
(1)
(2)
(2) where the instrument is the index of ‘solicited bribe’ over eight public services.
To study the complementary effects between corruption and public service satisfaction, improvement in economic situation, improvement in the political situation and support for democracy, we included the interaction terms (corruption × public service satisfaction, corruption × economic situation improved, corruption × political situation improved and corruption × support for democracy) into the IV regression model one by one by treating the interaction term as a potential endogenous variable. Following the example of Murnane and Willett, the baseline IV regression model should be rewritten as (Murnane & Willett Citation2010, pp. 247–49):(3)
(3)
(4)
(4)
(5)
(5) where the first instrument (instrument1,i) is the index of ‘solicited bribe’ and the second instrument is the interaction term between the first instrument and the term (namely, public service satisfaction, economic situation improved, political situation improved or support for democracy) interacting with the predictor in the main stage. Since we treat the interaction term as a potential endogenous predictor variable, it must also satisfy the usual assumptions of the IV regression model.
Findings
The results of the baseline IV regression model
The results of the main stage of IV regressions are reported in models 1–2 of . Corruption has a negative and statistically significant effect on satisfaction with both local governments (β = −0.18; p-value = 0.000) and national governments (β = −0.11; p-value = 0.000). In terms of covariates, the direction and significance of the regression coefficients in the IV regression models for satisfaction with local and national governments are similar. Thus, increased satisfaction with public services has a positive effect on satisfaction with local and national governments. An improved economic situation and support for democracy also have a similar positive influence on satisfaction with both levels of government. In contrast, an improved political situation has less of an effect on satisfaction with local governments than it does on satisfaction with national governments. Older individuals and females expressed more satisfaction with both levels of government, although the effects of age and gender are rather low. The effects of university education and household wealth are not significant.
TABLE 2 Results of Baseline Models
The results of OLS regression models
We also estimated OLS models with the same set of variables as the IV regression model. The results of OLS estimations are reported in models 3–4 and can serve as a benchmark. Again, corruption leads to a lower level of satisfaction with local governments (β = −0.01; p-value = 0.000) and national governments (β = −0.07; p-value = 0.000). As observed, IV regression models suggest a higher magnitude with respect to the corruption effect than do OLS models. Thus, IV regression shows that the effect of corruption with respect to satisfaction with the national government is approximately 1.6 times larger than OLS suggests the effect would be. Regarding satisfaction with the local government, the difference between the suggested effect of corruption between IV regression and OLS is even larger, at about 1.8 times. These findings highlight a higher endogeneity bias in the estimations of satisfaction with local governments than with national ones.
Interestingly, corruption has a stronger negative effect with regard to local governments than national ones, regardless of the model used for estimation. Hence, IV suggests that the negative effect of corruption on local governments is 55% larger than the effect on national governments. Similarly, OLS suggests that the negative effect of corruption on local governments is 40% larger than the effect on national governments.
The results of IV with interaction terms
The results of the main stage of IV regression estimations with interaction terms are reported in models 5–12 of . The results in include the full baseline specifications from , although only the main variables of interest are reported to conserve space.Footnote1
TABLE 3 Results of with Interaction Term Models
Corruption has a negative effect on satisfaction with government at the local and national levels in all models. Similar to the baseline models, corruption has a stronger negative effect on local governments than on national governments, regardless of the model estimated. Indeed, the negative effects of corruption on satisfaction with local governments vary between model 8 (β = −0.16; p-value = 0.000) and model 5 (β = −0.21; p-value = 0.000). In comparison, the negative effects of corruption on satisfaction with national governments are relatively lower in model 12 (β = −0.10; p-value = 0.000) and model 9 (β = −0.14; p-value = 0.000).
The interaction terms ‘corruption × public service satisfaction’ also have a positive effect both on local governments (β = 0.05; p-value = 0.000) and national governments (β = 0.03; p-value ≤ 0.05), as do the interaction terms ‘corruption × political situation improved’ for local governments (β = 0.07; p-value ≤ 0.05) and national governments (β = 0.05; p-value ≤ 0.01). In contrast, the interaction terms ‘corruption × economic situation improved’ are significant only in estimations for local governments (β = 0.06; p-value ≤ 0.01), while ‘corruption × support for democracy’ is not significant in any of the estimations.
To assist us further in interpreting the results, a detailed visual illustration of the effect of the interaction terms is provided in and (Brambor et al. Citation2006).
FIGURE 1. Marginal Effect of Interaction Term Corruption × Public Service Satisfaction
Notes: Local gov―Local government; 95% Upper C.I.―95% upper confidence intervals; 95% Lower C.I.―95% lower confidence intervals; Marginal effect of corruption is based on model 5 for local governments and model 9 for national governments in .
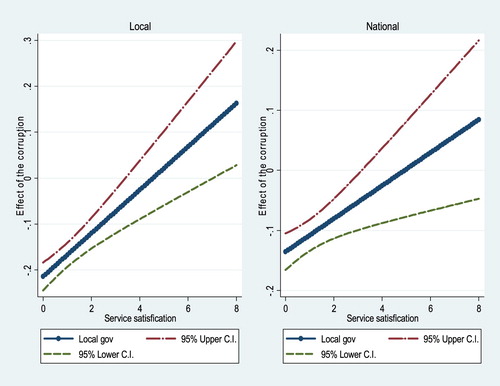
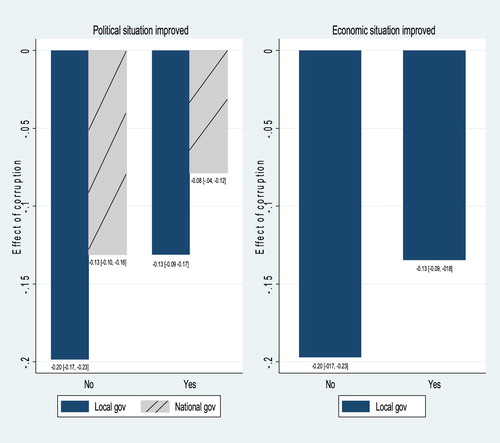
FIGURE 2. Marginal Effect of Corruption × Political Situation Improved and Corruption × Economic Situation Improved
Notes: Local gov―Local government; National gov―National government; 95% Upper C.I.―95% upper confidence intervals; 95% Lower C.I.―95% lower confidence intervals; Political situation improved is based on model 7 for local governments and model 11 for national governments in ; Economic situation improved is based on model 6 for national governments in .
illustrates the marginal effect of the interaction term ‘corruption index × public service satisfaction’. As public service satisfaction increases, the effect of corruption changes from negative values to positive values for both local and national governments. The first diagram illustrates that the effect of corruption on satisfaction with local governments went from approximately −0.21 to approximately 0.16 as public service satisfaction increased. The second diagram shows that the effect of corruption on satisfaction with national governments went from approximately −0.14 to approximately 0.08 as public service satisfaction increased.
The first diagram in illustrates the effect of the ‘corruption index × political situation improved’ interaction term. With respect to local governments, the effect of corruption is −0.13 for respondents who believe that the political situation has improved, whereas the effect of corruption is −0.20 for respondents who disagree. With regard to national governments, the effect of corruption is −0.08 for respondents who believe that the political situation has improved, where the effect of corruption is −0.13 for respondents who disagree.
The second diagram in depicts the effect of the interaction terms ‘corruption index × economic situation improved’ for local governments. The effect of the corruption is −0.13 for respondents who believe that the economic situation has improved, whereas the effect of corruption is −0.20 for respondents who disagree.
Conclusion
The empirical evidence in this study provides a rather complex picture. On the one hand, we found a significant and negative effect of corruption on satisfaction with government, regardless of the statistical specifications used. As far as estimations of the instrumental variables can address reverse causality and omitted variable problems, our findings suggest that the direction of the effect goes from corruption to government satisfaction. In general, we also reject the ‘culture of corruption’ hypothesis by showing that corruption has a significant effect on satisfaction with the government in all estimations. Although corruption is widespread in post-communist countries, it is not viewed by citizens as a ‘rule of engagement’ or an everyday occurrence.
On the other hand, further analysis with respect to the interaction terms provides suggestive evidence for the ‘grease the wheels’ hypothesis inasmuch as the negative effects of corruption are reduced in an environment characterised by perceptions of improvement in the political and economic situation, as well as in satisfaction with public services. The partial validation of the ‘grease the wheels’ hypothesis suggests that many citizens in post-communist countries are ready to tolerate corruption, which they regard as a lesser evil, providing that the economic and political situation, as well as public services, are seen to be improving. The opposite is also true. The negative effects of corruption become more damaging if citizens feel that there are no positive changes in the political and economic situation, and satisfaction with public services is low.
Finally, we also found that the negative effects of corruption are higher with respect to local rather than national governments. The explanation could be twofold (Harmel & Yeh Citation2011). On the one hand, many public services—for instance, healthcare and education—are managed by local governments. Consequently, corruption in those services is blamed on local governments. On the other hand, it could be the case that many citizens in post-communist countries believe in the good intentions of their national governments—intentions that are distorted and ruined by corrupt practices at the local level.
Additional information
Notes on contributors
Nazim Habibov
NAZIM HABIBOV, Associate Professor, School of Social Work, University of Windsor, 167 Ferry Street, Windsor, Ontario N9A0C5, Canada.
Lida Fan
LIDA FAN, Associate Professor, School of Social Work, Lakehead University, 955 Oliver Road, Thunderbay, Ontario P7B 5E1, Canada. Email: [email protected]
Alena Auchynnikava
ALENA AUCHYNNIKAVA, School of Social Work, University of Windsor, 167 Ferry Street, Windsor, Ontario N9A 0C5, Canada. Email: [email protected]
Notes
1 The complete results are available from the authors upon request.
References
- Aidt, T. (2003) ‘Economic Analysis of Corruption: A Survey’, The Economic Journal, 113, 491. doi: 10.1046/j.0013-0133.2003.00171.x
- Alesina, A. & Fuchs-Schündeln, N. (2007) ‘Good-Bye Lenin (or Not?): The Effect of Communism on People’s Preferences’, American Economic Review, 97, 4. doi: 10.1257/aer.97.4.1507
- Anderson, C. & Tverdova, Y. (2003) ‘Corruption, Political Allegiances, and Attitudes toward Government in Contemporary Democracies’, American Journal of Political Science, 47, 1. doi: 10.1111/1540-5907.00007
- Bailey, J. & Paras, P. (2006) ‘Perceptions and Attitudes about Corruption and Democracy in Mexico’, Mexican Studies/Estudios Mexicanos, 22, 1. doi: 10.1525/msem.2006.22.1.57
- Bowser, D. (ed.) (2001) ‘Corruption, Trust, and the Danger to Democratisation in the Former Soviet Union’, in Lovell, D. (ed.) In the Transition: Essays on post-Communism (Aldershot, Ashgate).
- Brambor, T., Clark, W. & Golder, M. (2006) ‘Understanding Interaction Models: Improving Empirical Analyses’, Political Analysis, 14. doi: 10.1093/pan/mpi014
- Camacho, L. (2014) Understanding Regime Support in New and Old Democracies, Discussion paper (Bonn, German Development Institute).
- Chitakunye, P., Ojochenemi, D., Derera, E. & Tarkhar, A. (2015) ‘Transnational Analysis of the Impact of Corruption on Development in Africa: A Review of Literature’, Journal of Social Science, 42, 1.
- Clausen, B., Kraay, A. & Nyiri, Z. (2011) ‘Corruption and Confidence in Public Institutions: Evidence from a Global Survey’, The World Bank Economic Review, 25, 2. doi: 10.1093/wber/lhr018
- Corral, M. & Orcés, D. (2013) Economic Development, Corruption and Satisfaction with Democracy across the Americas: A Comparative Multilevel Analysis, Working Paper (Salamanca, Instituto de Iberoamérica Universidad de Salamanca, Universidad de Salamanca).
- Dimitrova-Grajzl, V., Grajzl, P. & Guse, A. (2012) ‘Trust, Perceptions of Corruption, and Demand for Regulation: Evidence from Post-socialist Countries’, The Journal of Socio-Economics, 41, 3. doi: 10.1016/j.socec.2012.01.005
- Fidrmuc, J. (2000) ‘Political Support for Reforms: Economics of Voting in Transition Countries’, European Economic Review, 44, 8. doi: 10.1016/S0014-2921(99)00006-9
- Fisman, R. & Miguel, E. (2007) ‘Corruption, Norms, and Legal Enforcement: Evidence from Diplomatic Parking Tickets’, Journal of Political Economy, 115, 6. doi: 10.1086/527495
- Green, A. (2011) ‘Institutions Matter, but in Surprising Ways: New Evidence on Institutions in Africa’, Kyklos, 64, 1. doi: 10.1111/j.1467-6435.2010.00496.x
- Grosjean, P. (2011) ‘The Institutional Legacy of the Ottoman Empire: Islamic Rule and Financial Development in South Eastern Europe’, Journal of Comparative Economics, 39, 1. doi: 10.1016/j.jce.2010.05.003
- Habibov, N. (2015) ‘Individual and Country-level Institutional Trust and Public Attitude to Welfare Expenditures in 24 post-Communist Countries’, Journal of Sociology & Social Welfare, 41, 4.
- Habibov, N. (2016) ‘Effect of Corruption on Healthcare Satisfaction in post-Soviet Nations: A Cross-country Instrumental Variable Analysis of Twelve Countries’, Social Science & Medicine, 152. doi: 10.1016/j.socscimed.2016.01.044
- Habibov, N. & Cheung, A. (2016) ‘The Impact of Unofficial Out-of-Pocket Payments on Satisfaction with Education in Post-Soviet Countries’, International Journal of Educational Development, 49. doi: 10.1016/j.ijedudev.2016.02.002
- Habibov, N., Afandi, E. & Cheung, A. (2017) ‘Sand or Grease? Corruption–Institutional Trust Nexus in post-Soviet Countries’, Journal of Eurasian Studies, 8. doi: 10.1016/j.euras.2017.05.001
- Harmel, R. & Yeh, Y. (2011) ‘Corruption and Government Satisfaction in Authoritarian Regimes: The Case of China’, in Annual Meeting of the American Political Science Association, Seattle, 1–4 September.
- Hiskey, J. & Seligson, M. (2003) ‘Pitfalls of Power to the People: Decentralization, Local Government Performance, and System Support in Bolivia’, Studies in Comparative International Development, 37, 4. doi: 10.1007/BF02686272
- Holmes, L. (ed.) (2000) ‘Funktionen und Dysfunktionen der Korruption und ihrer Bekämpfung in Mittel- und Osteuropa’, in Zentrum für Europa- und Nordamerika- Studien (ed.) Politische Korruption (Opladen, Leske+Budrich).
- Holmes, L. (2006) Rotten States? Corruption, Post-communism, and Neoliberalism (Durham, NC, Duke University Press Books).
- Huntington, S. P. (1968) Political Order in Changing Societies (New Haven, CT, Yale University Press).
- Justesen, M. & Bjørnskov, C. (2014) ‘Exploiting the Poor: Bureaucratic Corruption and Poverty in Africa’, World Development, 58. doi: 10.1016/j.worlddev.2014.01.002
- Kim, B. & Pirttilä, J. (2006) ‘Political Constraints and Economic Reform: Empirical Evidence from the Post-Communist Transition in the 1990s’, Journal of Comparative Economics, 34, 3. doi: 10.1016/j.jce.2006.05.001
- Lavallée, E., Razafindrakoto, M. & Roubaud, F. (2008) Corruption and Trust in Political Institutions in sub-Saharan Africa, Working Paper 18 (Paris, Afrobarometer).
- Lee, W. & Guven, C. (2013) ‘Engaging in Corruption: The Influence of Cultural Values and Contagion Effects at the Microlevel’, Journal of Economic Psychology, 39. doi: 10.1016/j.joep.2013.09.006
- Leff, N. (1964) ‘Economic Development through Bureaucratic Corruption’, American Behavioral Scientist, 8, 3. doi: 10.1177/000276426400800303
- Levy, D. (2007) ‘Price Adjustment under the Table: Evidence on Efficiency-enhancing Corruption’, European Journal of Political Economy, 23, 2. doi: 10.1016/j.ejpoleco.2007.01.001
- Lewis, B. & Pattinasarany, D. (2009) ‘Determining Citizen Satisfaction with Local Public Education in Indonesia: The Significance of Actual Service Quality and Governance Conditions’, Growth and Change, 40, 1. doi: 10.1111/j.1468-2257.2008.00462.x
- Libman, A. & Obydenkova, A. (2013) ‘Communism or Communists? Soviet Legacies and Corruption in Transition Economies’, Economics Letters, 119, 1. doi: 10.1016/j.econlet.2013.02.003
- Lipset, S. (1959) ‘Some Social Requisites of Democracy: Economic Development and Political Legitimacy’, American Political Science Review, 53, 1. doi: 10.2307/1951731
- Manzetti, L. & Wilson, C. (2006) ‘Corruption, Economic Satisfaction, and Confidence in Government: Evidence from Argentina’, The Latin Americanist, 49, 2. doi: 10.1111/j.1557-203X.2006.tb00078.x
- Méon, P. & Weill, L. (2010) ‘Is Corruption an Efficient Grease?’, World Development, 38, 3. doi: 10.1016/j.worlddev.2009.06.004
- Miller, W. L., Grodeland, A. & Koshechkina, T. (2001) A Culture of Corruption?: Coping with Government in post-Communist Europe (Budapest, Central European University Press).
- Morgan, S. & Winship, C. (2014) Counterfactuals and Causal Inference: Methods and Principles for Social Research (Cambridge, Cambridge University Press).
- Mukaka, M. (2012) ‘A Guide to Appropriate Use of Correlation Coefficient in Medical Research’, Malawi Medical Journal, 24, 3.
- Murnane, R. & Willett, J. (2010) Methods Matter: Improving Causal Inference in Educational and Social Science Research (Oxford, Oxford University Press).
- Nye, J. (1967) ‘Corruption and Political Development: A Cost–Benefit Analysis’, American Political Science Review, 61, 2. doi: 10.2307/1953254
- Park, H. & Blenkinsopp, J. (2011) ‘The Roles of Transparency and Trust in the Relationship between Corruption and Citizen Satisfaction’, International Review of Administrative Sciences, 77, 2. doi: 10.1177/0020852311399230
- Pharr, S., Putnam, R. & Dalton, R. (2000) ‘A Quarter-century of Declining Confidence’, Journal of Democracy, 11, 2. doi: 10.1353/jod.2000.0043
- Przeworski, A., Limongi, F. & Giner, S. (1993) ‘Political Regimes and Economic Growth’, The Journal of Economic Perspectives, 7, 11.
- Putnam, R. (1993) Making Democracy Work (Princeton, NJ, Princeton University Press).
- Rovelli, R. & Zaiceva, A. (2013) ‘Did Support for Economic and Political Reforms Increase during the Post-Communist Transition, and If So, Why?’, Economics of Transition, 21, 2. doi: 10.1111/ecot.12009
- Skaaning, S. (2009) ‘Corruption in the Post-Communist Countries: A Study of its Particularity and Diversity’, in Jaskulowski, T., Backes, U. & Polese, A. (eds) Totalitarismus und Transformation: Defzite der Demokratiekonsolidierung in Mittel- und Osteuropa (Göttingen, Vandenhoeck & Ruprecht).
- Smith, D. (2008) A Culture of Corruption: Everyday Deception and Popular Discontent in Nigeria (Princeton, NJ, Princeton University Press).
- Steves, F. (2011) Life in Transition: After the Crisis (London, European Bank for Reconstruction and Development and World Bank).
- Stock, J. H. & Yogo, M. (2005) ‘Testing for Weak Instruments in Linear IV Regression’, in Andrews, D. W. K. & Stock, J. H. (eds) Identification and Inference for Econometric Models: Essays in Honor of Thomas Rothenberg (New York, NY, Cambridge University Press).
- Stock, J. H., Wright, J. H. & Yogo, M. (2002) ‘A Survey of Weak Instruments and Weak Identification in Generalized Method of Moments’, Journal of Business and Economic Statistics, 20.
- Stockemer, D. & Sundström, A. (2013) ‘“Corruption and Citizens” Satisfaction with Democracy in Europe: What is the Empirical Linkage?’, Zeitschrift für Vergleichende Politikwissenschaft, 7, Supplement 1.
- Suhrcke, M. (2000) ‘The Quality and Size of Government in Transition Economies―Are They Still Different?’, in Weltwirtschaftliches Archiv, unpublished manuscript, Hamburg Institute of International Economics, August, mimeo.
- Turex, R. (2011) ‘Corruption, Attitudes, and Education: Survey Evidence from Nepal’, World Development, 39, 7.
- Wagner, A., Schneider, F. & Halla, M. (2009) ‘The Quality of Institutions and Satisfaction with Democracy in Western Europe―A Panel Analysis’, European Journal of Political Economy, 25, 1. doi: 10.1016/j.ejpoleco.2008.08.001
- Wallace, C. & Latcheva, R. (2006) ‘Economic Transformation Outside the Law: Corruption, Trust in Public Institutions and the Informal Economy in Transition Countries of Central and Eastern Europe’, Europe-Asia Studies, 58, 1. doi: 10.1080/09668130500401707
- Weatherford, M. S. (1992) ‘Measuring Political Legitimacy’, American Political Science Review, 86, 1. doi: 10.2307/1964021
- Weitz-Shapiro, R. (2008) ‘The Local Connection: Local Government Performance and Satisfaction with Democracy in Argentina’, Comparative Political Studies, 41, 3. doi: 10.1177/0010414006297174
- Winters, M. & Weitz-Shapiro, R. (2013) ‘Lacking Information or Condoning Corruption: When will Voters Support Corrupt Politicians?’, Journal of Comparative Politics, 45, 4.
- Wooldridge, J. (2010) Econometric Analysis of Cross-section and Panel Data (Cambridge, MA, MIT Press).
- Zakaria, P. (2013) ‘Is Corruption an Enemy of Civil Society? The Case of Central and Eastern Europe’, International Political Science Review, 34, 4. doi: 10.1177/0192512112466880