
Abstract
Length-of-stay (LOS) is a key parameter in destination management that determines the number of guest nights relative to arrival numbers, with concomitant repercussions for revenue generation and other performance indicators. This article investigates the development of LOS for 32 destinations in developed and emerging economies as well as Small Islands and Developing States (SIDS). The analysis is based on UNWTO data for 478.5 million international tourist arrivals, or about 40% of the global total in 2015, for the years 1995–2015. Results show considerable differences in LOS between destinations, with a global trend of falling LOS, by 14.8% over the study period. However, in individual destination countries, LOS was found to be increasing. Analyses of LOS trends reveal that these can neither be explained by distance–decay relationships nor business to leisure arrival ratios. Results are discussed with regard for destination management and revenue optimisation, transport infrastructure needs, as well as sector greenhouse gas emissions.
1. Introduction
Length-of-stay (LOS) is a key parameter in the measurement of international tourism, determining the total number of guest nights spent by a given number of visitors in a destination. LOS affects spending, service offers, as well as the character and availability of activities (e.g. Baum & Lundtorp, Citation2001; Oklevik, Gössling, Steen-Jacobsen, Hall, & Grøtte, Citation2018; Thrane and Farstad, Citation2012) and also influences patterns of infrastructure and resource use. Where LOS is short, transport infrastructure requirements grow in comparison to accommodation infrastructure, as greater tourist volumes require additional airport capacity or other transport infrastructure. Tourism transport demand is consequently linked to various sustainability performance indicators, such as land requirements, energy use, or emissions of greenhouse gases (Gössling & Peeters, Citation2015).
Shorter LOS and more restricted time budgets may also lead to a focus on “must see” attractions, and the concentration of tourist flows in time and space (García-Palomares, Gutiérrez, & Mínguez, Citation2015; Ram & Hall, Citation2018). In comparison, tourists staying longer may visit a greater number of potentially smaller businesses in more peripheral locations. They are also likely to develop more complex destination images (Fakeye & Crompton, Citation1991). LOS has consequently a wide range of implications for destination management, and is linked to social and environmental issues that have gained importance with growing concerns over economic inequality, overtourism, climate change, and ambitions for tourism to contribute to the Sustainable Development Goals (UN Citation2015).
There is evidence that LOS is changing in many destinations (Alegre & Pou, Citation2006; Barros & Machado, Citation2010; Martínez-Garcia & Raya, Citation2008), but existing studies have focused on individual countries or regions. This research analyses a global sample of destinations over a 20-year period. It discusses how LOS has changed since 1995 in developed and emerging destinations, as well as Small Islands and Developing States (SIDS), and evaluates relationships influencing LOS. It also raises the question as to whether it is still meaningful for destinations to seek to increase LOS. Should such efforts be considered inopportune at a time when radical innovations, such as global booking platforms, contribute to a decline in LOS (Oklevik et al., Citation2018)?
2. Background
Length of stay has attracted the attention of tourism scholars since the early development of mass tourism, mostly because it was soon understood that LOS influences total expenditure (Lucas, Citation1963; Wurst, Citation1955). Archer and Shea (Citation1975:10) postulated:
“From the point of view of the recipient region, the primary aim of tourism is to generate a high level of regional household income. One method of achieving this objective is to persuade tourists to spend longer periods of time in the area”.
Over the past 30 years, studies have underlined the importance of LOS for revenue generation, as well as the significance of maintaining or increasing LOS. Expenditure is widely considered an important destination management parameter, as a reflection of a tourism system’s potential to generate jobs and income (Archer & Shea, Citation1975). There is general agreement that a longer LOS positively influences overall expenditure (Alegre, Mateo, & Pou, Citation2011; Alegre & Pou, Citation2006; Downward & Lumsdon, Citation2000; Laesser & Crouch, Citation2006; Machado, Citation2010; Peypoch, Randriamboarison, Rasoamananjara, & Solonandrasana, Citation2012; Wang, Rompf, Severt, & Peerapatdit, Citation2006), though higher daily expenditures have also been found to coincide with shorter stays (Alegre et al., Citation2011; Alegre & Pou, Citation2006; Thrane & Farstad, Citation2011, Citation2012).
As a result, a great deal of research has focused on the understanding of LOS determinants. Studies have highlighted interrelated socio-demographic, economic, political, seasonal-environmental, and institutional aspects. This has included variables such as cost (Silberman, Citation1985; Thrane, Citation2016), income (e.g. Peypoch et al., Citation2012; Walsh & Davitt, Citation1983), gender (e.g. Fleischer & Pizam, Citation2002), age (e.g. Alén, Nicolau, Losada, & Domínguez, Citation2014; Barros, Butler & Correia, Citation2010), education (e.g. Martínez-Garcia & Raya, Citation2008), travel party size (Thrane & Farstad, Citation2011), nationality (e.g. Gokovali, Bahar & Kozak, Citation2007; Machado, Citation2010), flexibility of transportation (e.g. Menezes, Moniz, & Vieira, Citation2008), transport speed (Sun & Lin, Citation2018), transport cost (Thrane, Citation2016), booking time (Thrane, Citation2012), package versus self-organized travel (e.g. Thrane & Farstad, Citation2012), seasonality (e.g. Uysal, Fesenmaier & O’Leary, 1994), destination type, such as city versus coast (e.g. Ferrer-Rosell, Martínez-Garcia, & Coenders, Citation2014), accommodation form (Barros, Butler, & Correia, 2010; Tussyadiah & Pesonen, Citation2016), or available vacation days (Gössling et al., Citation2016).
From the viewpoint of individual businesses, any change in length of stay affects service provisions. For instance, for hotels and other accommodation, more frequent, shorter stays incur a greater labour requirement for cleaning rooms, and increased administrative and operational costs (Martínez-Garcia & Raya, Citation2008). Shorter stays also affect destination image, marketing, evaluations and ratings (Fakeye & Crompton, Citation1991; Martínez-Garcia & Raya, Citation2008). Where tourists have more limited time to explore a locality, they are likely to stay centrally and to focus on visitation of the major attractions (García-Palomares et al., Citation2015). This makes it more difficult to distribute tourism’s benefits to a greater number of stakeholders, specifically in more peripheral regions. Yet, shorter stays may imply benefits for destinations where tolls or departure taxes have to be paid (Alegre & Pou, Citation2006), or where they are associated with higher per-day spending (Thrane & Farstad, Citation2012).
Several authors have suggested that length of stay is declining (Alegre & Pou, Citation2006; Eurostat, Citation2014; Ferrer-Rosell et al., Citation2014; Fleischer, Peleg, & Rivlin, Citation2011; Gokovali et al., Citation2007; Salmasi, Celidoni, & Procidano, Citation2012). For example, Alegre and Pou (Citation2006) found that between 1989 and 2003, average LOS in the Balearic Islands fell by three days, from 13.1 to 9.9 days, or 2% per year. Falling LOS has been linked to various destination challenges, such as visitor flow intensities and the concentration of visitors in time and space, or growing transport demand and its space requirements, and linkages with greenhouse gas emissions. As Turkle (Citation2015) affirms, notions of visiting “the right places” has gained importance in the age of social media and is, in tourism, afforded by global platforms and their highlighting of specific sites as specifically attractive, ‘must see’ destinations (e.g. TripAdvisor). Frequent travel to specific destinations has also been linked to social media platforms that visualize places visited and highlight the importance of travel for social status generation, such as Facebook (Gössling & Stavrinidi, Citation2016). Platforms such as AirBnB or HomeExchange have simultaneously lowered the cost of accommodation (Guttentag, Citation2015).
As various authors have highlighted, LOS is dependent on real or perceived cost, and opportunities to stay at a lower price, as offered by platforms such as AirBnB, may have positively influenced length of stay. This effect was for instance found by Martínez-Garcia (2008) and Nicolau and Más (Citation2009) for non-hotel accommodation. Tussyadiah and Pesonen (Citation2016) found that AirBnB offers led to an increase in travel frequency as well as length of stay, though on the basis of Likert-scale stated preferences. In contrast to these studies, a survey among international tourists in South-West Norway (n = 5300) found that AirBnB guests stayed for significantly shorter periods than the average visitor (Oklevik et al., Citation2018). Another potential factor influencing LOS are changes in tourist time budgets and the emergence of new constraints in the capacity to take extended periods of leave from employment (Hall, Citation2005). Important here is the growth in ‘flexible’, part-time and contract labour to which the holiday benefits available to full time employees do not apply (Axelsson, Malmberg, & Zhang, Citation2017; Koeber, Citation2017; Sweet & Meiksins, Citation2016). “Workcations”, i.e. situations in which family or friends visit increasingly flexible workers in the global economy may also contribute to changes in LOS. More generally, the establishment of new air routes in combination with the development of low cost travel (Dobruszkes, Citation2013; Dobruszkes, Givoni, & Vowles, Citation2017); currency exchange rate changes (Santana-Gallego, Ledesma-Rodríguez, & Pérez-Rodríguez, Citation2010; Webber, Citation2001); or risk and security perceptions (Deng & Ritchie, Citation2018; Sönmez, Citation1998) may all affect LOS. Overall, it remains unclear which factors may influence LOS on a global scale, but as the discussion highlights, a number of employment, social and economic trends may be relevant.
With regard to transportation, growing arrival numbers increase pressure on infrastructure, as airports, road or railway systems in most countries face capacity limits (IEA, Citation2013). Many destinations already face limitations of their transport systems, and in particular the expansion of airports is often difficult and linked to growing emissions of greenhouse gases (Hayden, Citation2014). Where fossil fuel-based transport systems grow, meeting climate change mitigation commitments, as negotiated in the Paris Agreement, will become impossible (Scott, Hall, & Gössling, Citation2016): In the current situation, the tourism system is already faced with a challenge to significantly reduce its greenhouse gas emissions; further growth will make decarbonisation in line with international policy agreements more difficult or even unlikely (ETC Citation2018). Against this background, both destination marketing to reduce average transport distances (Gössling, Scott, & Hall, Citation2015) as well as increasing LOS may become important strategies for destinations to maintain revenue levels while simultaneously making progress on international climate change policy obligations.
3. Methodology
For information regarding LOS, UNWTO’s Yearbooks of Tourism Statistics were acquired, covering the years 1995–2015 (UNWTO Citation2011, Citation2017). Countries initially chosen for analysis included the world’s 15 largest tourism economies, the 15 most important emerging tourism economies, as well as a sample of 15 tourism-dependent SIDS. These latter countries were chosen by the authors in an expert-based approach that considered geographical distribution and the relevance of tourism for national economies. For destinations selected in these three categories, data availability in the UNWTO Compendium of Tourism Statistics (UNWTO 2011, 2017) was confirmed in terms of complete or almost complete (individual years missing) datasets. LOS is measured on the basis of “the number of nights spent by non-resident tourists in accommodation establishments” (UNWTO 2017: xiv). For example, in this approach, one international tourist spending five nights in a country will account for five overnight stays (or person/guest nights).
UNWTO datasets proved to be incomplete with regard to a large number of the destinations originally chosen for analysis, including United States, China, Russia, Mexico, Malaysia, Thailand, Brazil, India, Japan, Indonesia, Iran, Tunisia, Kenya, South Africa, Madagascar, Fiji, Dominican Republic, Haiti, Samoa/Tonga, Maldives, Barbados, Mauritius, Trinidad & Tobago, St. Lucia, and Cape Verde. These countries consequently had to be replaced with secondary destinations, with a starting point in data availability. This again represented an expert-based approach to the choice of destinations. The final list of 32 countries for which data is available is presented in , including nations as well as overseas territories (e.g. Martinique). Of the destinations studied, 12 are mature tourism economies, 8 emerging tourism economies, and 12 SIDS. Together, they received 478.5 million international tourists or approximately 40% of the 1,186 million international arrivals worldwide in 2015 (UNWTO, 2017).
Table 1. Destinations and trends in LOS.
National data was also used to test distance-decay relationships. This included data obtained from Statistics Austria (Citation2017) as well as State of Hawaii (Citation2018), both for 2015. These destinations were chosen for reasons of data availability. Average length of stay for individual markets was calculated on the basis of overnights in relation to arrivals. Distance to the destination for each market was calculated based on the great circle distance between the capitals of the respective countries and Vienna (Austria) and Honolulu (Hawaii), as the most important international airports. Distances were calculated using the online tool Great Circle Mapper (www.greatcirclemapper.com). This will underestimate true flight distances because of no-flight zones, rerouting, and non-direct landings/departures. However, these affect all flights and are considered to have an overall small impact on distance-decay calculations. With regard to business to leisure traveller ratios, UNWTO data does sometimes distinguish leisure/holiday and business purposes, but only in relation to overall arrival numbers. There is consequently no specific data for such ratios for individual nationalities, though a number of destinations can be compared on this basis.
As a general limitation, UNWTO data needs to be treated with caution, as questions regarding data reliability remain. This has been realized decades ago, when considerable efforts were made to identify consistent and sound methodologies on LOS calculation (Silberman, Citation1985; Walsh & Davitt, Citation1983). Methodological challenges continue to persist (Thrane, Citation2012, Citation2016). While UNWTO data should be consistent regarding its approach to data collection and overall comparability, it will often only represent estimates. Data focuses on tourist arrivals, i.e. visitors staying for at least one night in the destination; i.e., day visitors are not considered in the analysis.
4. Results
The comparison of the 32 countries reveals considerable differences in LOS, and differential trends in the development of LOS over the past two decades (1995–2015). For example, at the lower end of the spectrum of destinations, LOS is 1.6 nights in Norway or the US Virgin Islands, 1.9 nights in Bulgaria, and 2.1 nights in the Czech Republic and Bosnia and Herzegovina (all data for 2015). In comparison, destinations with high LOS include the Seychelles (9.9 nights), Argentina (11.3 nights), French Polynesia (13.2 nights), and Martinique (14.2 nights). While a higher LOS may have been expected in these destinations, it is less clear why Norway or the US Virgin Islands report much lower LOS. In both cases, a high share of business travellers may be an explication, significantly reducing average length of stay. Potentially, these countries may also function as hubs, registering travellers moving on to other destinations. Bulgaria, Czech Republic and Bosnia and Herzegovina may also be characterized by a share of visitors passing through, or, given their more central locations, visiting for shorter weekend breaks.
Considerable differences also exist between more comparable destinations. For example, LOS was 7.9 nights in the UK, and 2.3 nights in Germany in 2015, both mature destinations in Europe. Again, Germany’s location, bordering Denmark, Netherlands, Belgium, Luxembourg, France, Switzerland, Austria, Czech Republic, as well as Poland, may be an explanation for shorter visits from neighboring countries. In the UK, data for average LOS may hide considerable differences. For example, London as a global city and financial centre may attract business travellers from all over the world, often for shorter stays. In comparison, the country has in the past been attractive for international students and guest workers, who may stay over significantly longer periods of time.
In comparing two tropical islands, LOS was found to be 6.7 nights in the Bahamas, and 14.2 nights in Martinique in 2015. A possible explanation is that the Bahamas attract many shorter stays from the US, also as a result of relatively shorter travel distances involved, while Martinique has a high share of arrivals from France, also in connection with family ties. While differences in LOS between destinations are significant, it is not always clear which parameters determine LOS. There is evidence, however, that root causes for shorter or longer LOS may be systemic; i.e., closeness to markets, or leisure to business ratios. The basis on which average LOS of destinations is determined may thus be different from the individual determinants that are often the focus in the literature, such as age, income, or gender.
More generally, data shows a considerable decline in LOS for most destinations over the past 20 years (). The weighted average LOS for the entire sample was 5.4 nights in 1995, falling to 4.6 nights in 2015. The decline by 0.8 nights corresponds to a 14.8% reduction in LOS over the study period. Again, there are considerable differences between destinations. LOS in the UK, for example, has fallen by 2.2 nights (21.8%) since 1995. Norway saw the largest percentage decline in LOS, by 36%. Most mature tourism economies have seen their LOS fall significantly, with France, Portugal, Netherlands, Austria and Greece all witnessing a reduction in LOS, by at least 16.7% (Netherlands), and up to 27.5% (Austria). However, not all mature destinations experienced a downward trend. Canada saw LOS increase by 2.8 nights, or 51.9%, and Spain by 0.9 days or 30%. Even Bulgaria, Argentina, and the Bahamas were able to positively develop LOS, by 15.3% (Argentina) to 18.8% (Bulgaria).
Overall, data shows that out of the twelve largest tourism economies studied, nine show a decline in LOS, and three an increase; of the eight emerging tourism economies, five show a decline in LOS, two an increase, and one no change. Of the 12 SIDS economies, seven show a decline in LOS, four an increase, and one no change. In absolute terms, however, all destinations have seen massive growth in international arrivals. For example, arrivals in Turkey grew 4.5-fold, and almost 6-fold in Iceland (). Growth was also considerable in Eastern European countries, as would be expected after the end of the Yugoslav Wars. Perhaps most notable is that in Canada, total arrival numbers only increased by 6.1%, while the country also increased its LOS more than any other. Only two countries, Bermuda and the Bahamas, saw a decline in overall tourist arrivals, by 43.2% and 7.1%, respectively.
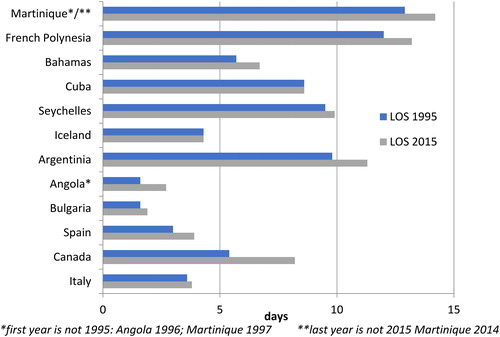
illustrates relative (percentage decline) and absolute (LOS) differences in destinations with declining LOS. shows similar differences for destinations with an increase in LOS (). The figures reveal that destinations with high LOS can experience considerable reductions in the number of guest nights spent (e.g. Malta, Jamaica, Anguilla, UK), but the opposite effect exists as well: Both Martinique and French Polynesia managed to increase already very high LOS values.
Figure 1. Destinations with decreasing length of stay.
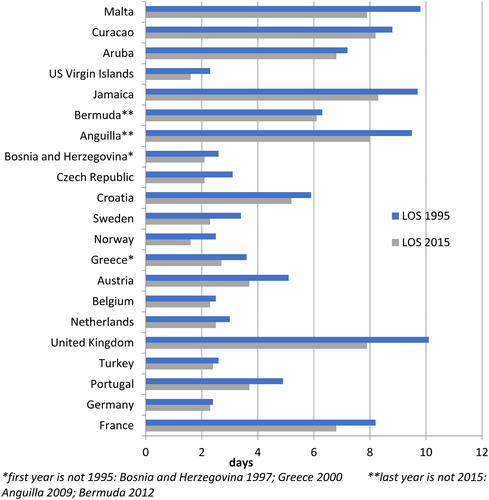
Figure 2. Destinations with increasing length of stay.
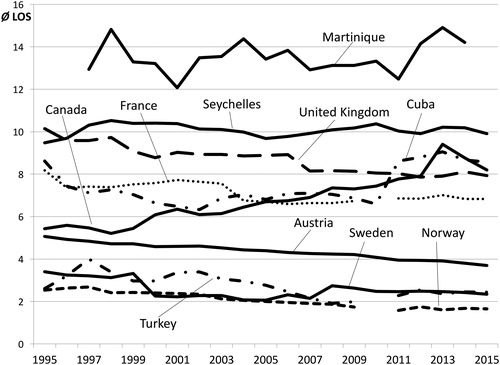
shows, for a selection of countries, that growth/decline trends in LOS can follow very different patterns. They are sometimes almost linear, as in the case of Austria, which has seen as constant, year-on-year decline in LOS (R2 = 0.98). In other destinations, such as France, significant year-on-year losses (0.9 days between 2003 and 2004), have been moderated by small gains in recent years. Yet other countries such as Sweden have seen a recovery after a considerable LOS reduction in the early 2000s. Cuba saw a massive increase in LOS in 2011, possibly as a result of changes in US foreign policy and consequent changes in their market with increased VFR arrivals. Germany’s LOS stayed constant at 2.3 nights over two decades. In other countries, LOS oscillation is considerable: Martinique, for example, reported LOS between 12.1 and 14.9, with considerable year-on-year volatility. Explanations will vary, and often be unrelated to destination management, as exemplified by the significant impacts major hurricanes can have on tourism in Caribbean Islands.
Figure 3. Development of LOS in various destinations.
The macro-scale trends require a closer examination at the underlying factors that may explain differences in LOS. As highlighted earlier, various aspects may influence LOS, such as transport cost (Thrane, Citation2016). Transport cost is closely linked to market proximity. For instance, Iceland, Norway and Sweden may be considered peripheral destinations in Europe, while France, Germany or Austria can be described as centrally located destinations. Depending on market structure, the relative effort required to reach a destination—measured in either time or cost—will vary. This is reflected in the average distances travelled to reach a destination. For instance, an international tourist flying to Malaysia travelled on average 1,765 km, compared to an average of 8,712 km in the case of New Zealand (data for 2010; Gössling, Scott, & Hall, Citation2015). As energy requirements increase with transport distance, a longer average distance to a destination is expected to coincide with a longer LOS. This is not necessarily true, however, as the analysis of Austria reveals.
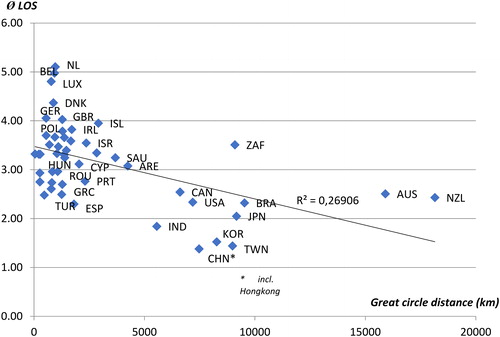
shows LOS in relation to travel distance for Austrian markets. The regression shows a weak relationship between LOS and travel distance. This is contrary to expectations, as average LOS is shorter in the case of the more distant markets, including Australia and New Zealand; Asian countries including Taiwan, China, Japan, South Korea, Canada, and USA, as well as emerging economy markets including South Africa, India, and Brazil. As arrivals from these countries are unlikely to return after a few days, data suggests that where travel distances exceed thresholds—here 5,000 km—there will be a tendency for travellers to visit multiple countries, with a concomitant decline in average LOS. This suggests that a central location can be a barrier for destinations to expand LOS.
Figure 4. Length of stay, international tourist arrivals in Austria (2015). Source: Statistics Austria Citation2017.
Consequently, countries with a peripheral location would be expected to reveal more classical distance decay relationships, i.e. length of stay should increase with distance in peripheral destinations, as the visitation of multiple destinations is more unlikely. This hypothesis can be tested for peripheral islands, such as the Seychelles or Mauritius. For these islands, no data existed, however, and as an alternative, Hawaii was chosen. Hawaii is a State within the USA, and hence not a destination country, yet the islands provide detailed visitor statistics for a peripheral destination (). The islands’ major markets, excluding domestic visitors from the USA, include Japan, Canada, Australia, South Korea, China, New Zealand, Taiwan, UK, and Germany. These accounted for 2.49 million arrivals in 2015, or 18.7 million visitor days. The distance decay regression by market shows a weak correlation of R2 = 0.24. Evidence for distance–decay to influence LOS is thus limited, even for peripheral destinations.
Table 2. International tourist arrivals, length of stay (days) and distance travelled (Hawaii 2015).
Yet another explanation for LOS could be sought in business to leisure traveller ratios, as business travellers can be expected to stay for significantly shorter periods. Available data reveals great differences in this regard, with for instance Cuba reporting a business to leisure arrival ratio of 1:184 and Mauritius 1:24. Yet, Cuba has an average LOS of 8.6 nights, while in Mauritius, this is 10.5 nights (in 2015). Vice versa, the Seychelles reported a business to leisure arrival ratio of 1:20, with a LOS of 9.9, while the Bahamas reported a ratio of 1:11, and a shorter LOS of 6.7 (in 2015). Statistical testing for seven comparable islands, Seychelles, Bahamas, Aruba, Curacao, Martinique, French Polynesia, and Mauritius, with business to leisure arrival ratios between 7.1 and 24.0, shows a weak correlation with LOS (R2 = 0.0839). Hence, business to leisure traveller ratios do not necessarily influence LOS.
5. Discussion
5.1. LOS and guest night implications
A consensus appears to have existed over decades that it is desirable for destinations to increase LOS (e.g. Gössling et al., Citation2016; Silberman, Citation1985; Walsh & Davitt, Citation1983). The analysis for almost 478.5 million international arrivals representing more than 2.2 billion guest nights (in 2015) suggests that LOS is declining globally. This global pattern is not necessarily relevant for individual destinations: while a majority of destinations have seen a declining LOS, there exist mature, emerging and SIDS destinations that have seen increasing LOS: Canada, Spain, Bulgaria, Argentina, Bahamas, French Polynesia, and Martinique have all witnessed considerable growth in LOS over the two decades evaluated, by up to 52% (Canada). In Canada, developments are a likely result of a decline in short trips from the USA, as border crossing began to be more challenging post 9–11 (i.e., need to have a passport, longer inspection lines).
In contrast, destinations such as the US Virgin Islands, Malta, Jamaica, France, Czech Republic, Portugal, UK, or Austria face difficulties arising out of significantly falling LOS. Though absolute arrivals continue to increase in these destinations, compensating for guest night losses, falling LOS represents a double challenge with regard to maintaining destination-based expenditure as well as meeting climate change pledges of national governments and the tourism sector. As an example, LOS in Austria fell from 5.1 nights in 1995 to 3.7 nights in 2015. To generate 100 million guest nights, it consequently took 19.6 million international arrivals in 1995 and 27.0 million in 2015, with concomitant infrastructure expansion needs, for instance in terms of airport capacity. Even though tourists staying for shorter periods have been shown to spend more per day, the challenge in maintaining revenue levels is evident. Furthermore, as each additional tourist contributes to growing emissions, meeting Paris Agreement obligations becomes increasingly difficult (Scott et al., Citation2016). Destinations with oscillating arrival numbers are faced with similar difficulties. For instance, Turkey’s LOS of 4.0 in 1997 plummeted to 1.9 a decade later (in 2008). To maintain the number of guest nights, the country consequently had to attract more than twice as many arrivals, with associated pressure and investment requirements on transportation systems.
Another way of looking at LOS in the context of emission growth is to compare destination-specific LOS. For example, at 1.6 nights, Norway has to attract almost 9 visitors to generate the same number of guest nights as Martinique (14.2 nights). Italy, with a LOS of 3.8 nights, requires more than twice as many visitors as Canada at 8.2 nights, while Greece, at 2.7 nights, will have to attract almost three times as many visitors as Malta with a LOS of 7.9. These findings have considerable implications for transport infrastructure capacity requirements, as well as the overall emission intensity of tourism systems. They also imply that LOS should be considered a key performance indicator for greenhouse gas emission management, alongside the average distance flown by each international visitor, as outlined in Gössling et al. (Citation2015). It has also previously been suggested that using the total number of guest nights (LOS × visitor arrivals) in relation to the permanent population provides a much more accurate assessment of the relative tourism use of resources and infrastructure than simple numbers of visitor arrivals (Hall, Citation2010).
5.2. LOS interrelationships, data availability, and destination management
The analysis of positive or negative LOS developments is hampered by data availability. Findings suggest, however, that two key parameters, distance-decay, as well as business to leisure arrival ratios, do not influence LOS significantly as hypothesized. Walsh and Davitt (Citation1983) as well as Silberman (Citation1985) suggested that distance travelled positively influences LOS, a relationship more recently confirmed by Nicolau and Más (Citation2009) and Yang, Wong, and Zhang (Citation2011). However, this analysis shows that while the cost of a holiday is likely to affect trip length, this does not necessarily translate into an increasing LOS for individual destinations. Contrary to expectations, there is evidence that destinations located in proximity to others may even suffer from distance-decay effects, as longer trips heighten the interest to visit multiple destinations (Lue, Crompton, & Fesenmaier, Citation1993). This situation may be different in peripheral destinations without close “competitors”, though as the example of Hawaii illustrates, even in these locations the relationship between distance and LOS may be weak. Various explanations seem possible. As average distances travelled to destinations have increased, also involving a higher share of air travel, multiple destination visits may have become more of a norm (Gössling et al., Citation2016). However, the overall understanding of this phenomenon also requires a far better understanding of tourists’ overall time budget and constraints, including statutory holiday taking and the effects of changed employment practices. Shifts in LOS are likely to continue to evolve as travel patterns of the Millennial generation become a greater driver of tourism patterns (Garikapati et al., Citation2016).
A similar situation was found regarding business to leisure ratios, where it was expected that a higher share of business travellers would reduce LOS, as a result of shorter stays. This hypothesis was tested for a sample of seven islands, but no strong relationship was found. Results consequently suggest that distance to markets or business to leisure traveller ratios have more limited importance for LOS development. Further explanations thus have to be found. As an example, more recent changes in LOS may be explained with structural changes in destinations, such as the availability of cheaper accommodation and associated changes in visitor types. For example, a study of leisure travellers in Western Norway indicates that AirBnB leisure tourists stay significantly shorter (8.6 nights) than the average traveller (11.0 nights) (Oklevik et al., Citation2018). Where the share of AirBnB accommodation grows in comparison to other accommodation, it may consequently be expected that LOS declines. This effect may be visible in some countries. For instance, in Spain, where AirBnB has established a significant share of accommodation (Guiterrez et al., 2017), LOS has declined since 2013, even though overall LOS for the period 1995–2015 developed positively.
Results have a wide range of implications for destination managers. Even though further insights regarding the underlying reasons for shorter or longer LOS averages, as well as their positive/negative development is warranted, there is much scope for destinations to proactively develop LOS. As Alegre and Pou (Citation2006: 1353) postulated:
Given the trend towards shorter stays, tourist destinations are faced with various possibilities. They can try to maintain their income levels, attracting greater numbers of tourists, or they can accept the reduction in income and maintain the same number of visitors. […] A third alternative is to design tourism policies aimed at promoting a longer length of stay. This could be achieved through commercial price policies or marketing campaigns aimed at attracting tourist segments whose longer length of stay guarantees higher earnings.
Various recent studies have revealed potential to positively influence LOS, for instance by increasing market shares of nationalities with a potential to stay longer ( Gössling et al., Citation2016), or by offering opportunities to participate in activities to visitor groups that have signalled interest to stay longer (Oklevik et al., Citation2018). Where LOS can be increased, possibly in connection with a reduction in the average distance travelled by visitors, this may imply a reduction in operational cost for businesses, as well as, for destinations, an opening to meeting the objectives of the Paris Agreement by reducing greenhouse gas contributions. Countries with high growth rates may also consider the introduction of departure taxes to make tourists stay longer and to generate direct revenue. Such taxes could be LOS-based, with longer-staying guests paying reduced fees.
6. Conclusions
This paper analysed trends in LOS development for a sample of 32 countries and jurisdictions accounting for almost half a billion international tourist arrivals in 2015. While data-sets provided by UNWTO (2011, 2017) are often incomplete, some important insights emerge. First of all, data supports that LOS is declining globally, by almost 15% over a 20-year period. However, not all destinations have experienced a decline in LOS. Data does not provide an indication as to why LOS may have increased in these countries. It seems likely, however, that new market segments, social media and global platforms for travel advice, home sharing, or accommodation reservation have initiated processes that support frequent travel and shorter stays have an influence, along with the cost of travel (IATA, Citation2018), as well as the rapid expansion of low cost carriers in some markets (Gross & Lück, Citation2016). Data also revealed considerable differences in average LOS between countries, which can neither be explained by distance-decay relationships, peripheral versus central location, or business to leisure tourist arrival ratios.
Destinations should be interested in increasing LOS for interrelated reasons of transport infrastructure capacity needs, service management costs, and the distribution of visitor flows. At an average LOS of 1.6 nights, Norway needs almost nine times the transport capacity of Martinique, at 14.2 nights, to generate the same number of guest nights. This research consequently highlights that LOS should be considered a key performance indicator for destination management, along with the average distance travelled to reach the destination. Both of these indicators were found to have significant relevance for a destination’s greenhouse gas emissions, and hence its ability to meet country or sectoral decarbonisation targets. Currently, there is limited evidence of destinations engaging in concerted efforts to increase LOS; arrivals growth instead continues to be the main focus. It may be argued that this model of growth has incurred various problems, such as airports and other traffic infrastructure repeatedly facing capacity limits, with attendance adverse impacts on travel experience. It is time to re-think models of destination growth and sustainability, and future research should more systematically identify parameters determining LOS, as well as linkages to climate change, capacity demand and revenue, with a view to destination optimization rather than maximization.
Notes on contributors
Stefan Gössling is a professor at the Department of Service Management, Lund University, and the School of Business and Economics, Linnaeus University, Sweden. He is also the research co-ordinator at the Western Norway Research Institute’s Research Centre for Sustainable Tourism.
Daniel Scott is a professor and University Research Chair in Global Change and Tourism at the University of Waterloo in Canada. He has worked on the human dimensions of climate change for over 15 years and been a contributing author and expert reviewer for the United Nations Intergovernmental Panel on Climate Change Third, Fourth and Fifth Assessment Reports.
C. Michael Hall is a professor at University of Canterbury, New Zealand; visiting professor, Linnaeus University, Kalmar, Sweden; and docent, University of Oulu, Finland. His research interests include tourism, regional development, environmental change, food, sustainability and World Heritage.
Acknowledgement
Leandra Jänicke’s help with data collection and analysis is gratefully acknowledged.
Disclosure statement
No potential conflict of interest was reported by the authors.
References
- Alegre, J., Mateo, S., & Pou, L. (2011). A latent class approach to tourists’ length of stay. Tourism Management, 32(3), 555–563. doi: 10.1016/j.tourman.2010.05.003
- Alegre, J., & Pou, L. (2006). The length of stay in the demand for tourism. Tourism Management, 27(6), 1343–1355. doi: 10.1016/j.tourman.2005.06.012
- Alén, E., Nicolau, J. L., Losada, N., & Domínguez, T. (2014). Determinant factors of senior tourists’ length of stay. Annals of Tourism Research, 49, 19–32.
- Archer, B. H., & Shea, S. (1975). Length of stay problems in tourist research. Journal of Travel Research, 13(3), 8–10.
- Axelsson, L., Malmberg, B., & Zhang, Q. (2017). On waiting, work-time and imagined futures: Theorising temporal precariousness among Chinese chefs in Sweden’s restaurant industry. Geoforum, 78, 169–178.
- Barros, C. P., & Machado, L. P. (2010). The length of stay in tourism. Annals of Tourism Research, 37(3), 692–706. doi: 10.1016/j.annals.2009.12.005
- Barros, C. P., Butler, R., & Correia, A. (2010). Determinants of the length of stay in Latin American tourism destinations. Tourism Analysis, 31(1), 13–340.
- Baum, T., & Lundtorp, S. (2001). Seasonality in tourism. Amsterdam: Pergamon.
- Deng, R., & Ritchie, B. W. (2018). International university students’ travel risk perceptions: an exploratory study. Current Issues in Tourism, 21(4), 455–476.
- Dobruszkes, F. (2013). The geography of European low-cost airline networks: a contemporary analysis. Journal of Transport Geography, 28, 75–88.
- Dobruszkes, F., Givoni, M., & Vowles, T. (2017). Hello major airports, goodbye regional airports? Recent changes in European and US low-cost airline airport choice. Journal of Air Transport Management, 59, 50–62.
- Downward, P., & Lumsdon, L. (2000). The demand for day-visits: An analysis of visitor spending. Tourism Economics, 6(3), 251–262.
- European Travel Commission (ETC). (2018). Tourism and climate change mitigation. Embracing the Paris Agreement – pathways to decarbonisation. Brussels: European Travel Commission.
- Eurostat (2014). Trends in number of trips, nights spent and average duration of trips made by EU-28 residents, 2005–2014. http://ec.europa.eu/eurostat/statistics-explained/index.php/File:Trends_in_number_of_trips,_nights_spent_and_average_duration_of_trips_made_by_EU-28(%C2%B9)_residents,_2005-2014.png
- Fakeye, P. C., & Crompton, J. L. (1991). Image differences between prospective, first-time, and repeat visitors to the Lower Rio Grande Valley. Journal of Travel Research, 30(2), 10–16.
- Ferrer-Rosell, B., Martínez-Garcia, E., & Coenders, G. (2014). Package and no-frills air carriers as moderators of length of stay. Tourism Management, 42, 114–122. doi: 10.1016/j.tourman.2013.11.002
- Fleischer, A., & Pizam, A. (2002). Tourism constraints among Israeli seniors. Annals of Tourism Research, 29(1), 106–123.
- Fleischer, A., Peleg, G., & Rivlin, J. (2011). The impact of changes in household vacation expenditures on the travel and hospitality industries. Tourism Management, 32(4), 815–821.
- García-Palomares, J. C., Gutiérrez, J., & Mínguez, C. (2015). Identification of tourist hot spots based on social networks: A comparative analysis of European metropolises using photo-sharing services and GIS. Applied Geography, 63, 408–417.
- Garikapati, V. M., Pendyala, R. M., Morris, E. A., Mokhtarian, P. L., & McDonald, N. (2016). Activity patterns, time use, and travel of millennials: a generation in transition? Transport Reviews, 36(5), 558–584.
- Gokovali, U., Bahar, O., & Kozak, M. (2007). Determinants of length of stay: A practical use of survival analysis. Tourism Economics, 14, 205–222. doi: 10.1016/j.tourman.2006.05.004
- Gössling, S., & Peeters, P. (2015). Assessing tourism’s global environmental impact 1900-2050. Journal of Sustainable Tourism, 23(5), 639–659. doi: 10.1080/09669582.2015.1008500
- Gössling, S., & Stavrinidi, I. (2016). Social networking, mobilities, and the rise of liquid identities. Mobilities. Mobilities, 11(5), 723–743.
- Gössling, S., Ring, A., Dwyer, L., Andersson, A.-C., & Hall, C. M. (2016). Optimizing or maximizing growth? A challenge for sustainable tourism. Journal of Sustainable Tourism, 24(4), 527–548.
- Gössling, S., Scott, D., & Hall, C. M. (2015). Inter-market variability in CO2 emission-intensities in tourism: Implications for destination marketing and carbon management. Tourism Management, 46, 203–212.
- Gross, S., & Lück, M. (2016). (Eds). The low cost carrier worldwide. London: Routledge.
- Guttentag, D. (2015). Airbnb: disruptive innovation and the rise of an informal tourism accommodation sector. Current Issues in Tourism, 18(12), 1192–1217.
- Hall, C. M. (2005). Tourism: Rethinking the social science of mobility. Harlow: Pearson.
- Hall, C. M. (2010). An island biogeographical approach to island tourism and biodiversity: An exploratory study of the Caribbean and Pacific Islands. Asia Pacific Journal of Tourism Research, 15(3), 383–399.
- Hayden, A. (2014). Stopping Heathrow Airport expansion (for now): Lessons from a victory for the politics of sufficiency. Journal of Environmental Policy & Planning, 16(4), 539–558.
- IATA. (2018). Annual Review 2018. Available: http://www.iata.org/publications/pages/annual-review.aspx Accessed 2 July 2018.
- IEA. (2013). Global land transport infrastructure requirements. Available: https://www.iea.org/publications/freepublications/publication/TransportInfrastructureInsights_FINAL_WEB.pdf Accessed 3 January 2018.
- Koeber, C. (2017). The social reorganization of time: The “great speedup” and the transformation of time and work discipline. Humanity & Society, 41(2), 143–157.
- Laesser, C., & Crouch, G. I. (2006). Segmenting markets by travel expenditure patterns: the case of international visitors to Australia. Journal of Travel Research, 44(4), 397–406.
- Lucas, R. C. (1963). Bias in estimating recreationists' length of stay from sample interviews. Journal of Forestry, 61(12), 912–914.
- Lue, C. C., Crompton, J. L., & Fesenmaier, D. R. (1993). Conceptualization of multi-destination pleasure trips. Annals of Tourism Research, 20(2), 289–301.
- Machado, L. P. (2010). Does destination image influence the length of stay in a tourism destination? Tourism Economics, 16(2), 443–456.
- Martínez-Garcia, E., & Raya, J. (2008). Length of stay for low-cost tourism. Tourism Management, 29(6), 1064–1075.
- Menezes, A. G., Moniz, A., & Vieira, J. C. (2008). The determinants of length of stay of tourists in the Azores. Tourism Economics, 14(1), 205–222.
- Nicolau, J. L., & Más, F. J. (2009). Simultaneous analysis of whether and how long to go on holidays. The Service Industries Journal, 29(8), 1077–1092.
- Oklevik, O., Gössling, S., Steen-Jacobsen, J. K., Hall, C. M., & Grøtte, I. P. (2018). Optimizing Norwegian tourism with a focus on activities. Journal of Sustainable Tourism, doi: 10.1080/09669582.2018.1533020.
- Peypoch, N., Randriamboarison, B., Rasoamananjara, F., & Solonandrasana, B. (2012). The length of stay of tourists in Madagascar. Tourism Management, 33(5), 1230–1235. doi: 10.1016/j.tourman.2011.11.003
- Ram, Y., & Hall, C. M. (2018). Walkable places for visitors: Assessing and designing for walkability. In C. M. Hall, Y. Ram, & N. Shoval (Eds.), The Routledge International Handbook of Walking Studies (pp. 311–329), Abingdon: Routledge.
- Salmasi, L., Celidoni, M., & Procidano, I. (2012). Length of stay: Price and income semi-elasticities at different destinations in Italy. International Journal of Tourism Research, 14(6), 515–530. doi: 10.1002/jtr.1867
- Santana-Gallego, M., Ledesma-Rodríguez, F. J., & Pérez-Rodríguez, J. V. (2010). Exchange rate regimes and tourism. Tourism Economics, 16(1), 25–43.
- Scott, D., Hall, C. M., & Gössling, S. (2016). A report on the Paris Climate Change Agreement and its implications for tourism: why we will always have Paris. Journal of Sustainable Tourism, 24(7), 933–948. http://dx.doi.org/10.1080/09669582.2016.1187623
- Silberman, J. (1985). A demand function for length of stay: The evidence for Virginia Beach. Journal of Travel Research, 23(4), 16–23.
- Sönmez, S. F. (1998). Tourism, terrorism, and political instability. Annals of Tourism Research, 25(2), 416–456.
- State of Hawaii (2018). Visitor Statistics 2015. Retrieved from http://dbedt.hawaii.gov/visitor/visitor-research/.
- Statistics Austria (2017). Tourism. Retrieved from https://www.statistik.at/web_en/statistics/Economy/tourism/index.html.
- Steen-Jacobsen, J. K., Gössling, S., Dybedal, P., & Skogheim, T. S. (2018). Exploring length of stay: International tourism in south-western Norway. Journal of Hospitality and Tourism Management, 35, 29–35. http://doi.org/10.1016/j.jhtm.2018.02.00310.1016/j.jhtm.2018.02.003
- Sun, Y. Y., & Lin, Z. W. (2018). Move fast, travel slow: the influence of high-speed rail on tourism in Taiwan. Journal of Sustainable Tourism, 26(3), 433–450.
- Sweet, S., & Meiksins, P. (2016). Changing contours of work: Jobs and opportunities in the new economy (3rd ed.). Thousand Oaks CA: Sage.
- Thrane, C. (2012). Analyzing tourists' length of stay at destinations with survival models: A constructive critique based on a case study. Tourism Management, 33(1), 126–132. doi: 10.1016/j.tourman.2011.02.01
- Thrane, C. (2012). Analyzing tourists’ length of stay at destinations with survival models: A constructive critique based on a case study. Tourism Management, 33(1), 126–132.
- Thrane, C. (2016). Students' summer tourism: Determinants of length of stay (LOS). Tourism Management, 54, 178–184.
- Thrane, C., & Farstad, E. (2011). Domestic tourism expenditures: The non-linear effects of length of stay and travel party size. Tourism Management, 32(1), 46–52. doi: 10.1016/j.tourman.2009.11.002
- Thrane, C., & Farstad, E. (2012). Nationality as a segmentation criterion in tourism research: the case of international tourists’ expenditures while on trips in Norway. Tourism Economics, 18(1), 203–217.
- Thrane, C., & Farstad, E. (2012). Tourists’ length of stay: The case of international summer visitors to Norway. Tourism Economics, 18(5), 1069–1082. doi: 10.5367/te.2012.0158
- Turkle, S. (2015). Reclaiming conversation. New York: Basic Books.
- Tussyadiah, I. P., & Pesonen, J. (2016). Impacts of peer-to-peer accommodation use on travel patterns. Journal of Travel Research, 55(8), 1022–1040.
- United Nations. (2015). Sustainable development goals: Seventeen goals to transform our world. Retrieved from http://www.un.org/sustainabledevelopment/sustainable-development-goals/.
- UNWTO (United Nations World Tourism Organisation. (2017). Yearbook of Tourism Statistics. Madrid: UNWTO.
- UNWTO (United Nations World Tourism Organisation. (2011). Yearbook of Tourism Statistics. Madrid: UNWTO.
- Uysal, M., Fesenmaier, D. R., & O'Leary, J. T. (1994). Geographic and seasonal variation in the concentration of travel in the United States. Journal of Travel Research, 32(3), 61–64.
- Walsh, R. G., & Davitt, G. J. (1983). A demand function for length of stay on ski trips to Aspen. Journal of Travel Research, 21(4), 23–29.
- Wang, Y., Rompf, P., Severt, D., & Peerapatdit, N. (2006). Examining and identifying the determinants of travel expenditure patterns. International Journal of Tourism Research, 8(5), 333–347.
- Webber, A. G. (2001). Exchange rate volatility and cointegration in tourism demand. Journal of Travel Research, 39(4), 398–405.
- Wurst, C. (1955). The length-of-stay problem in tourist studies. Journal of Marketing, 19(4), 357–359.
- Yang, Y., Wong, K. K. F., & Zhang, J. (2011). Determinants of length of stay for domestic tourists: Case study of Yixing. Asia Pacific Journal of Tourism Research, 16 (6), 619–633.