
Abstract
Many global tourist destinations have experienced growth in arrivals. This has triggered various conflicts in destinations and sparked debates as to how to deal with what is increasingly referred to as ‘overtourism’. Most Destination Marketing Organisations (DMOs) pursue strategies to stimulate arrivals even further. Pro-growth discourses are reinforced by lead bodies such as the World Tourism Organisation (UNWTO). However, maximisation strategies based on higher numbers of tourists increasingly cause conflicts with local residents, whereas simultaneously undermining climate change mitigation pledges as negotiated in the Paris Agreement. New approaches to destination management based on optimisation are therefore warranted. Drawing on a survey of international tourists (n = 5,249) in south-western Norway, this article discusses whether ‘activities’, i.e. the development of local, small-scale and ideally more sustainable experiences, can contribute to economic growth without necessarily increasing numbers of arrivals. Results confirm that destinations should seek to better understand their markets, including length of stay, spending, and/or activity intention, to identify profitable markets. Ultimately, such knowledge may help addressing overtourism conflicts while building tourism systems that are more economically, socially, and environmentally resilient.
Introduction
Since the beginning of mass tourism in the 1960s, most destinations in the world have sought to increase numbers of tourist arrivals (Hall, Citation2008). Even where early ‘caps’ set out to place limits on inbound tourist numbers, as in the Seychelles, Bhutan, or Grand Cayman, these have subsequently been lifted (Gössling et al., Citation2002; Johnson, Citation2002; Nyaupane & Timothy, Citation2010). However, in recent years, continued rapid growth in tourist arrivals in popular destinations, and associated problems of crowding, localised inflation and/or pressure on residential housing, have created substantial public debates regarding the desirability of a tourism system based on a growth model. Crowding, or ‘overtourism’ (UNWTO, Citation2017), as a result of a disproportionally large influx of tourists has become an issue for residents as well as tourists in destinations as diverse as New York City, Amsterdam, Reykavik, the Isle of Skye, Koh Phi Phi, Thailand, and Palawan, Philippines. In comparing population to overnight visitors per year to highlight crowding pressure (1: 360 in Venice; 1: 33 in Dubrovnik; 1: 8 in Paris), the World Economic Forum (Citation2017) suggests that destinations will increasingly turn to caps, citing Santorini (Greece) and Cinque Terre (Italy) as examples. In response to crowding problems, the UNWTO called for destinations to better manage tourism, though without questioning the underlying assumption of a continuation in growth strategy. The World Travel Market ‘Minister’s Summit’, co-organised by UNWTO in London in November 2017, reflects this perspective: ‘Overtourism: growth is not the enemy, it is how we manage it’ (UNWTO, Citation2017).
Recent increases in tourism in some destinations has often been fuelled by a combination of heightened accessibility involving low cost carriers and declining airfares (e.g. Lawton, Citation2017), the global relevance of social media and evaluation platforms in streamlining opinion and influencing demand, also as a result of mobile travel applications offering cheap and convenient services to enhance destination experiences, such as language translation, city guides, and maps; as well as new and inexpensive accommodation offers through AirBnB and other online platforms (Guttentag, Citation2015). All of these developments have resulted in profound changes in visitor composition, length-of-stay, place-of-stay, tourist expectations, and resident perceptions, especially where AirBnB has caused severe disruptions in residential housing supply (Gutiérrez, García-Palomares, Romanillos, & Salas-Olmedo, Citation2017). These processes have also resulted in more critical perspectives on the desirability and quality of growth by some destination stakeholders, including businesses and residents, as well as tourists. In the current climate, and with widespread media-reporting on ‘overtourism’, overcrowding, and anti-tourist sentiment (e.g. Independent, Citation2017; Skift, Citation2017; Telegraph, Citation2018), destination marketing organisations, particularly in Europe have begun to openly and critically discuss the desirability of continued growth-focused perspectives for tourism. These critical perspectives are also prevalent in Norway, where they have emerged on social media, national media, and in multiple stakeholder debates, such as those surrounding the evaluation of UNESCO World Heritage Sites, to which ‘Fjord Norway’ belongs (Hawkins et al., Citation2009).
Given global growth in tourist arrivals and notions of tourism systems reaching their limits, an emerging question emerges whether mature or rapidly growing destinations should continue to pursue volume growth strategies (Gössling, Ring, Dwyer, Andersson, & Hall, Citation2016; Hall, Citation2009)? Alternative options may include caps or limits, de-marketing, and/or the application of air passenger duties and departure taxes to increase revenue and limit arrivals growth (Hall, Citation2014), i.e. initiatives that have so far been mostly applied in the context of single, highly frequented sites (such as Machu Picchu, Peru), not entire destinations. Neuts and Nijkamp (Citation2012, p. 2149) concluded that ‘prevention of tourist visitation during periods of high use by season spreading of tourist flows might prove a workable solution in order to decrease crowding pressure’. This, however, may acquiesce to perceptions that the economic potential of a tourism system is not fully realised, resulting in resistance from stakeholders seeking to profit from continued arrival growth. An alternative is to optimise tourism systems, i.e. to increase the value obtained from maintaining or even decreasing visitor numbers (Dwyer, Pham, Forsyth, & Spurr, Citation2014; Gössling et al., Citation2016). This article discusses optimisation on the basis of a survey of international tourists in south-western Norway, with a focus on price perceptions, length of stay (LOS), and interest in activities. Results are put in the context of calls for further growth, as issued by UNWTO, and with regard to their wider destination management implications.
Crowding and ‘overtourism’
Growth in tourist arrivals is a key objective of destination marketing organisations, to maximise tourism’s contribution to GDP and employment (Dwyer, Forsyth, & Dwyer, Citation2010). Even though economic contributions are related to various aspects of the tourism production system, such as transportation, accommodation, attractions, or activities, the general view is that growth in numbers of arrivals is the pathway to economic benefit. For example, Hall (Citation2008) concluded that the most common approach to destination development is ‘boosterism’, and there is a widespread understanding that tourism development is embedded in wider neoliberal discourses of growth (see also Dwyer et al., Citation2007; 2012; Hall, Citation2014). This perspective is fostered by supranational organisations such as UN World Tourism Organisation (UNWTO), World Economic Forum (WEF), or World Travel and Tourism Council (WTTC), which advocate volume growth, framing successful tourism development against indicators of arrival numbers, employment, revenue, or market shares (Blanke & Chiesa, 2013; UNWTO, Citation2014) as opposed to more humanistic indicators of performance, such as quality of life (e.g. Ridderstaat, Croes, & Nijkamp, Citation2016). Since the term ‘sustainability’ is seemingly ubiquitous in the public discourses of these international organisations, growth has become a ‘distinctly environmental project’ (McCarthy & Prudham, Citation2004, p. 276). Yet, an awakening to alternative viewpoints is now palatable in many destinations around the world: tourism has become regarded as too dominant a sector in many regions, and in such cases its negative impacts seem to increasingly overshadow its benefits. Specifically, where the influx of tourists has begun to dominate local economies and townscapes, or where large numbers of tourists attempt to visit individual sites, more critical perceptions of ‘crowdedness’ appear to have emerged.
Crowding effect was originally developed as a concept describing emotions arising out of perceived human density and resulting constraints (Stokols, Citation1972). Crowding as an issue for destinations and in particular tourist sites has been a recurrent topic in tourism research since the early 1970s, i.e Turner and Ash’s (Citation1975) reference to ‘golden hordes’ and popularised through Doxey’s (Citation1975) ‘Irritation Index’. Later, Social Exchange Theory (Emerson, Citation1976) became the starting point for tourism studies focused on issues of human interaction and exchange specifically in leisure contexts, highlighted that tourist numbers can become a source of ‘incompatibility’ between residents and outsiders (Ap, Citation1992; Neuts & Nijkamp, Citation2012; Ward & Berno, Citation2011). With regard to tourist perceptions, there is general agreement that crowding is situational and depends on individual norms and values, as well as the perceived characteristics of other tourists. Tourists associate crowding with waiting, stress, or specific (negative) destination qualities (Patterson & Hammitt, Citation1990; Perdue et al., Citation1999; Riganti & Nijkamp, Citation2008; Stewart & Cole, Citation2001). It has been highlighted that crowding can also be positive (Choi, Mirjafari, & Weaver, Citation1976). This insight, which Neuts and Nijkamp (Citation2012) emphasise has been mostly overlooked, is potentially of growing relevance in tourism (see also Popp, Citation2012). Notions of ‘being in the right place’ in the wider context of ‘following’ trends have gained importance because of information cascades and the concentration of news flows in the age of social media (Turkle, Citation2015), as well as an increasing focus by consumers on the acquisition of unique experiences, rather than material possessions as markers of identity (Addis & Holbrook, Citation2001). Specific sites may become increasingly attractive as a result of discussions in social media channels, or as recipients of high numbers of ‘like’ or positive evaluations on platforms such as TripAdvisor. illustrates annual resident to tourist ratios in a number of popular destinations around the world. Note that these mostly represent cities and smaller countries, as perceptions of crowding will be influenced by the concentration of people in time and space, as well as other factors, such as resident/tourist attitudes and comfort thresholds, LOS, weather patterns, season, or the popularity of specific attractions.
Table 1. Popular destinations and resident to annual tourist arrival ratios, 2015.
In comparison, residents’ attitudes to tourists and crowding have also been investigated in various cultural and geographical contexts. Early works discussed, for example, that residents were confronted with high infrastructure use including traffic congestion as a result of tourism, as well as second home purchases (Lankford, Citation1994; Sheldon & Var, Citation1984). However, negative perceptions of crowding were not confirmed in all contexts (Mok, Slater, & Cheung, Citation1991) and were shown to also depend on economic involvement in tourism (Andereck, Valentine, Knopf, &Vogt, Citation2005). Host irritation, Ward and Berno (Citation2011) affirm, can be mediated by factors such as positive perceptions of tourism impacts, more satisfying intercultural contacts and more positive stereotypes.
Crowding is perceived as a problem in Norway, a country mostly renowned for its vast landscapes and a tourism product largely based on associations of remoteness and ‘solitude’. Between 2010 and 2016, commercial overnight stays grew from 28.5 million to 33.1 million (Innovation Norway, Citation2017), while the cruise sector saw passenger numbers increase from 0.41 million in 2010 to 0.66 million in 2015. With arrivals concentrated in summer and focused on a limited number of popular sites, debates on crowding have become more prominent. These have mostly emerged in the context of day visitors arriving on cruise ships, dividing locals over the desirability of cruises (Brennpunkt, Citation2017; Travel News, Citation2017), as well as at the most popular sites, where large tourist numbers accumulate. This includes several Fjords, specifically Naeroyfjord and Geiranger Fjord, as well as popular sites, such as Trolltunga, Trollstigen, or Preikestolen. Notably, these are also sites receiving high rankings by TripAdvisor, and self-reinforcing processes of recommendations and high visitation rates may here result in ‘overtourism’. As an example, a tourist on the ‘Norway in a Nutshell’ package describes his experiences during a tour to some of the most ‘significant’ sites in the country, using the platform TripAdvisor:
“[…] on arrival at our final railway station there were not enough buses to take us to our “fiord cruise”. […] There were at least five full buses unloading passengers (so probably in excess of 300 people) onto a RoRo car ferry that was probably built to take 12 to 15 cars. Everybody was directed upstairs to the passenger lounge which was already full to bursting, being meant for probably no more than 50 people. We ended up spending the whole trip to Flam standing on a very empty and very wet car deck, missing most of the highlights of the fiord because we couldn't see over the sides of the ferry” (TripAdvisor, Citation2015).
Given the growing importance of traveller opinion, online reputation change is another aspect of overtourism if which destinations need to be aware. Crowding effects have also gained attention in more rural spots, where high visitor numbers have been attributed to a ‘Frozen effect’, i.e. growing interest in Norwegian landscapes as a result of the Disney movie, released in 2013. In order to counter these trends, Norway has already pursued campaigns to market different parts of the country as year-round destinations (Fjord Norway, 2016). Data from Innovation Norway (Citation2017) suggests, however, that the summer remains the most popular time to visit, with 65% of the new growth between 2015 and 2016 occurring in the warmest months, and hence adding to already high summer tourist numbers.
Optimisation and activities
An alternative to the maximisation of tourist numbers is optimisation, which is, in the context of this article, defined as any destination management strategy that seeks to stabilise – or even reduce – tourist numbers and to increase yield (value) through other mechanisms, such as new spending opportunities. Research that can be characterised as optimisation related has sought to identify markets that are more profitable (Weaver & Oppermann, Citation2000), more economically stable (Schiff & Becken, Citation2011), longer LOS (Alén et al., Citation2014), incurring a lower carbon cost (Gössling et al., Citation2015), or having favourable price perceptions and an interest in staying longer or visiting during another season (Gössling et al., Citation2016). All of these approaches to optimisation are essentially market segmentation exercises (Dolnicar, Citation2014), with the difference that optimisation would explicitly seek to increase financial returns while maintaining or even decreasing international arrival numbers.
Research in Sweden confirms that tourist spending is not necessarily constrained, with 45–90% of visitors from diverse countries reporting flexible, i.e. not principally limited, holiday budgets (Gössling et al., Citation2016). This is of particular relevance in the Scandinavian context, as Denmark, Iceland, Sweden, and Norway all represent high-value destinations, attracting wealthier visitor segments. Analysis for Sweden suggests, however, that within nationalities, specifically advantageous markets may be identified, based on favourable price perceptions, budgetary resources, and an expressed willingness to increase LOS (Gössling et al., Citation2016). In particular the latter may be of importance, as it has been linked to various destination challenges, such as shorter term tourists focusing their visits on the main attractions; or capacity limits at airports, with Norway requiring almost nine times as many international arrivals as Martinique to generate the same number of guest nights, a result of the island’s significantly longer average LOS (Gössling, Scott, & Hall, 2019). Where destinations can induce tourists to stay longer, they are likely to be able to sell additional activities or to reduce operational costs in the destination (e.g. room cleaning). Despite some evidence showing that shorter stays can result in higher spending per day (Alegre & Pou, Citation2006; Barros & Machado, Citation2010; Thrane & Farstad, Citation2012), encouraging longer stays may positively influence distribution across the destination – i.e. tourists visiting more peripheral attractions or regions and have positive effects for climate change mitigation, given that fewer arrivals ultimately reduces emissions associated with transportation.
Activities – i.e. any experience related to organised tours, cultural visits, or outdoors – may thus have the potential to contribute to an interest in staying longer and, vice versa, longer stays are likely to increase the interest in experience consumption. Destinations should ensure that offers are sustainable, for instance with regard to energy use or other environmental impacts, to safeguard against greater activity participation leading to increased negative externalities.
Methodology
To understand tourists’ spending patterns, LOS, as well as their interest in activities, a survey of international leisure tourists was conducted in south-western Norway. The region comprises the counties Sogn og Fjordane, Hordaland, and Rogaland, with a population of about 1.1 million (SSB, Citation2017) and is internationally branded as ‘Fjord Norway’. In 2011, the last year for which data are available, the region was visited by ∼970,000 international tourists during the summer (June–August). The most important markets include Germany, the Netherlands, France, Denmark, Sweden, the United States, and the United Kingdom. Summer leisure tourists spend on average 11.9 nights in Norway and 6.7 nights out of this in south-western Norway (Dybedal, Citation2014). ‘Activities’ in Norway include a wide range of offers, usually nature-based or cultural, and organised by small and medium-sized enterprises.
Data were collected between 25 May and 15 September 2016, over 153 data collection days. Tourists were interviewed by a company specialising in surveys, Faktum Analyse AS. Questionnaires were administered to tourists in English and German, to adequately capture arrivals by different transport modes. No language issues were encountered by visitors of other nationalities in completing the questionnaire. Interviews were carried out in six locations including the airport in Bergen, the ferry terminals in Kristiansand, Hella, and Lavik, as well as the centre of Bergen. This non-probability sampling technique was employed because no specific probability structure was expected, though varying survey days across weeks was adopted to reduce potential sampling bias (temporally stratified sampling; Hurst, Citation1994). Sampling also covered two central exit points from the area that is, passengers waiting for departure at Bergen airport (38 days, response rate 43%) and Kristiansand seaport (16 days, response rate 66%). To cover visitors exiting in the northern part of the region, questionnaires were handed out to travellers waiting for departure at Hella (29 days, response rate 70%) and Lavik (15 days, response rate 58%). These are two ferry terminals at Sognefjord. A screening question confirmed that respondents were leisure travellers who did not reside in Norway. As the Kristiansand seaport is outside the study region, an additional screening question was used there to identity passengers who had visited the counties Sogn og Fjordane, Hordaland, and/or Rogaland. Hence, a combination of an in situ and en route approach was used. In addition to these locations, questionnaires were randomly distributed to foreign vacationers in Bergen city centre (55 days, response rate 45%).
Response rates varied between 43 and 70%, in line with airport exit surveys (Rideng & Christensen, Citation2004), and interviews typically lasted between 10 and 15 minutes. In total, 5,249 questionnaires were completed and returned to the interviewers. Questions addressed perceived expensiveness of the country (Likert 1–10, with 10 representing a very expensive destination), LOS, participation, and potential interest in 33 types of activities, spending and expenses, as well as the type of accommodation used, information behaviour (e.g. use of TripAdvisor), holiday budgets, gender, age, income, and country of residence. Activity types were based on the official distinction used by Fjord Norway, with travellers reporting on the type of activity they participated in, and not the frequency of participation. To visit three museums would consequently be counted as one activity. ‘Intention to participate in activities’ consequently refers to those activities travellers had not actually participated in.
shows the distribution of respondents by gender, age, and nationality, indicating that about half of the respondents are male (50.4%) and female (49.6%). The age distribution includes in particular a large share (24.2%) of younger tourists (25–34 years old). Other age brackets are evenly distributed. Nationalities include, in particular, Germans (26.3%), British (11.0%), and US citizens (10.7%). Note that the nationality distribution in the survey cannot be compared to national arrival statistics, as this survey focuses on leisure tourists, while national data include leisure and business travellers.
Table 2. Sample demographics.
With regard to spending, 2,557 (48.7%) of respondents reported their expenditures in Norwegian Crowns (NOK) or national currencies, as well as personal net incomes and the number of days spent travelling. Where national currencies were reported, currency tables by the Bank of Norway were used to calculate NOK. In this article, values are provided in Euro to allow for comparison in a more widely established currency (1 NOK: 0.10575 Euro; November 2017).
Data analysis focused on the identification of markets with a potential to increase participation in activities. Spending outliers (NOK >200,000/trip; n = 11) were removed from all analyses. Means between groups of tourists were tested with t-tests for a wide range of parameters, including spending and income by nationality and accommodation type, price perceptions, participation in activities during the stay as well as per day (by nationality and accommodation type), as well as expressed interest in (further) participation in activities and nationality. Correlations were tested between some of the variables. Where these were found to be significant, results are reported. The analysis also derived spending per activity type, to allow conclusions regarding the activities that can make the most significant contributions to increase spending. Results are presented in the following sections and discussed with regard to their relevance for crowding/overtourism, as well as destination planning and marketing under scenarios of climate and global socioeconomic change. As a limitation, the article does not discuss where money was spent or by whom. Norway is a country with a more even distribution in incomes, however, where economic growth benefits large parts of society.
Various limitations characterise the survey. First of all, the questionnaire does not distinguish the proportion of money spent on transport. This is of importance, as local revenue is of interest in the context of optimisation approaches as discussed in this article. Yet, this survey focused on overall spending to increase response numbers as well as the reliability of answers. This raises the question as to whether spending by some nationalities contains a higher share of transport-related cost. Another dataset for Sweden distinguishing transport cost shares (Gössling et al., Citation2016; n = 1,914) was analysed to determine the relevance of these effects. It indicates that the cost of transportation varies between 8% and 21% for the 14 countries studied (transport cost share per day of stay; for countries with a sample size of n > 20). There is no indication that this share is higher for long-haul visitors, apparently because they tend to stay longer. For instance, the transport cost share is 10% for Chinese and 16% for Australians, and 18% for Austrians and 21% for British visitors. For Finland it is 8% and for Poland 9%. This suggests that transportation cost can only explain about 10% of spending differences between countries.
A second limitation is that tourists were asked about their LOS in Norway. In particular long-haul tourists may visit several international destinations during one trip (Gössling et al., 2019), which could cause bias. While this cannot be ruled out, tourists may rather have chosen not to answer the question, which clearly referred to the cost associated with the trip to Norway. The fact that more than half of all tourists did not answer the question on the cost of the trip would seem to confirm that those who were uncertain about this aspect chose to pass the question.
Prospects and potential strategies for optimisation: Insights from Norway
Current spending and price perceptions
Revenue generation is a key performance indicator for tourism destinations. The survey consequently investigated spending patterns as well as price perceptions among tourists. Spending is of relevance to determine the relative amount of money introduced in the Norwegian economy by visitors, while price perceptions are an indicator of resilience. Where countries are perceived as too expensive, this may deter visitation, particularly in a situation of economic downturn.
illustrates spending by tourist nationality, as an indicator of the overall contribution made by these groups to revenue generation, and in relation to income levels. US travellers (M = €3,782) were found to spend the most per person per trip, followed by travellers from Switzerland/Austria (M = €3,043), i.e. for these groups spending was significantly higher (p < 0.05) than for all other nationalities. Together with tourists from Italy, France, The Netherlands, Asia, and these nationalities are the highest spenders. Reported income data show that high spending is not necessarily related to income, with for instance Irish tourists reporting the third highest income and the third lowest spending levels. In particular visitors from Asia and the USA are disproportionally wealthy, reporting net annual personal incomes averaging €105,000 and €120,500, respectively (). This is considerably higher than the survey average of €59,000, which already represents a very high value. The European Union reports that the EU28 median net income is €16,500 (in 2016; Eurostat, Citation2017). Only visitors from Eastern Europe reported income levels close to European averages (€18,200). Tourists in south-western Norway, with three to four times the average European Union net income, consequently belong to a very wealthy share of global society.
Figure 1. Total spending in relation to income, by nationality (in Euro).
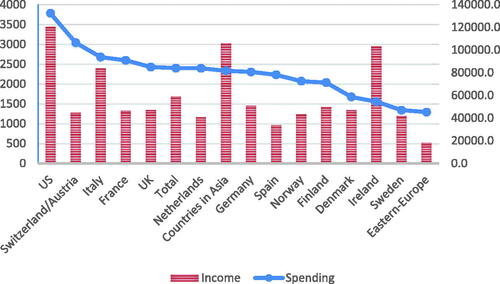
Figure 2. Spending per day and person, by nationality (Euro).
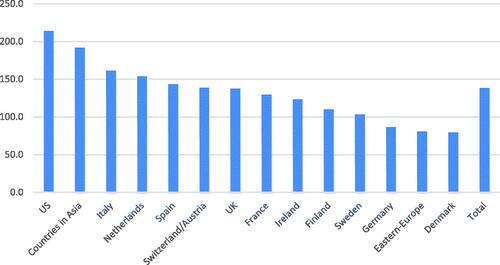
Overall spending patterns are confirmed in the analysis of per person per day spending patterns (). US-residents, Asian, and Italian visitors spend the most per day, up to €214 per person (p < 0.01; USA). Spending per day consequently shows a difference of almost a factor four between nationalities, with the lowest spenders being Danes at €79. High spending per day was also found to be significant for Asian tourists (M = €192, p < 0.01), as well as visitors from Italy (M = €161; p < 0.05). These results are largely aligned with earlier spending studies in Norway.
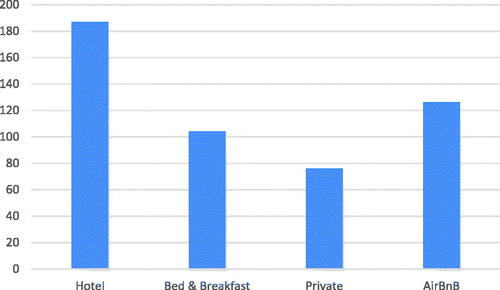
shows spending patterns by accommodation type, indicating that tourists staying in hotels deliver more money in the economy than those using AirBnB services, bed and breakfast, or private accommodation. More specifically, results indicate that hotel guests spend €187 per person per day (p < 0.01), 40% more than those staying in AirBnB accommodation (M = €126, p < 0.01). Findings also indicate that first time visitors spend significantly more than repeat visitors (Mfirst time = €132; Mrepeat = €104, p < 0.01). Results were also controlled for use of TripAdvisor, showing that tourists using TripAdvisor spent significantly more than others (MTripAdvisor = €162; MnonTripAdvisor = €114; p < 0.01).
Figure 3. Spending by accommodation type (Euro per person per day).
Price perceptions
To understand general perceptions of cost levels in Norway, respondents were asked how they rated the prices experienced in Norway on a scale from 1 to 10, and with regard to general price levels, food in restaurants, as well as alcoholic beverages. The scores on the three perceived price items were averaged. Results indicate differences between nationalities, Irish tourists experiencing prices as highest (M = 9.44), followed by tourists from Spain (M = 9.0), Eastern Europe (M = 9.0), and the UK (M = 8.98). The least affected by price experiences are visitors from Finland (M = 8.0; though this result is based on a small sample size of n = 17), followed by Swedes (M = 8.28) and tourists from Asia (M = 8.50). Findings are a likely reflection on market composition, specifically with regard to Asia, where particularly wealthy travellers are not deterred by Norway’s comparably high price levels. However, irrespective of country, travellers consider Norway’s price levels as high.
No significant differences in price perceptions were found between holiday types, i.e. cruise, visiting friends and relatives, sports, nature-experiences, adventure holidays, sun & sea, or countryside stays. Analysis, however, reveals that tourists booked on packages perceive prices as lower than the average tourist (Mpackages = 8.61; Mindividuals = 8.75, p < 0.01), a likely outcome of pre-payments and a comparably low cost within the country. For package tourists, there is a negative correlation between their actual and their expected spending (r = –0.08, p < 001). However, there is a positive correlation for visitors who planned and organised their trip individually between their actual and expected spending (r = 0.08, p < 0.01). A possible conclusion is that it may be easier to market additional offers, also in the form of activities, to package holidaymakers, and in the country. This may require co-operation with travel agents and tour guides, as such spontaneously booked activities may require a degree of flexibility on the side of these tourists.
Activities
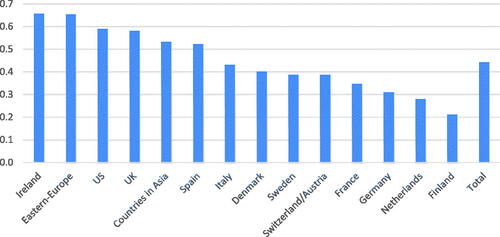
Activities are at the core of this analysis, as they have considerable importance for local spending, because money is more often directly injected in the local economy. This hypothesis is supported by the data set, as a significant relationship was found between activities and total spending (r = 0.04, p < 0.05). Activities may also be organised by smaller companies, with comparably large employment-generating potential. On average, tourists had engaged in 3.72 activities during the 6.7 days of their stay. However, about one third (30.9%) had not participated in any activities at all, while there is a statistically significant, but very small difference in perceptions of expensiveness between those participating and not participating in activities (MParticpateInActivities = 8.76; MNonparticipants = 8.66, p < 0.01). Hence, nonparticipation in activities cannot be explained with price perceptions. Further insights can be derived from the analysis of nationality to trip participation ratios (). Results indicate considerable differences, with tourists from Eastern Europe (M = 4.73), Ireland (M = 4.63), Switzerland/Austria (M = 4.29), and Spain (=4.28) participating disproportionally often in activities (all significant higher than the average; p < 0.05). In comparison, tourists from Denmark (M = 2.97), Sweden (M = 2.54), and Finland (M = 1.94), as well as Asian tourists (M = 3.00) were the least interested in activities (all significant lower mean than other tourists, p < 0.01). These results are largely identical if measured on a relative basis, i.e. if measured as activities per day (see ). Again, Irish, and East-European tourists are the most active at 0.65 activities per day, compared to, e.g. 0.2 activities per day for visitors from Finland. Given earlier findings regarding price perceptions, there appears to be some evidence that the tourists experiencing prices as highest are also those that are participating in most activities. Activity-participation may thus contribute to an understanding that Norway is expensive.
Figure 4. Total number of activities by nationality.
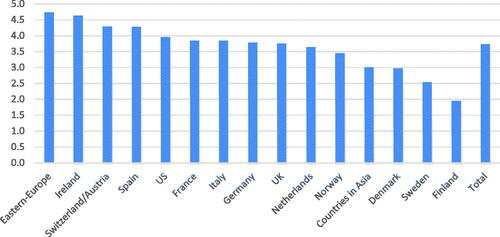
Figure 5. Activities per day of stay by nationality.
Analysis of activity groups reveals only small and nonsignificant differences. One potentially relevant finding is that cyclists and hikers experienced Norway as more expensive than other tourists (Mcyclists = 8.87; Mhikers = 8.79, p < 0.05). These are the main groups targeted by DMOs to develop new and potentially more sustainable tourism products in south-western Norway. Culturally interested tourists (architecture, culture, museums), another potentially more sustainable group of tourists, also experienced prices higher than others (Marchitecture = 8.83, Mculture = 8.83, Mmuseums = 8.79, all with a significant higher mean than other tourists at p < 0.05). However, as differences are small, price experiences in these segments does not necessarily make these tourists less relevant for Norway.
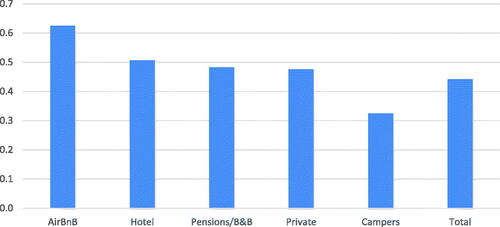
Activity levels were also investigated in relation to accommodation choices. For instance, it has been speculated that travellers staying in comparably cheap accommodation, such as pensions or AirBnB, will spend more money locally. While no statistically significant correlations were identified to support such a hypothesis, AirBnB guests were found to participate in more activities than other visitors (M = 0.62 activities per day, p < 0.01; compared to the average of M = 0.44). Campers were found to be the least active (M = 0.32, p < 0.01) ().
Figure 6. Activity per day by type of accommodation.
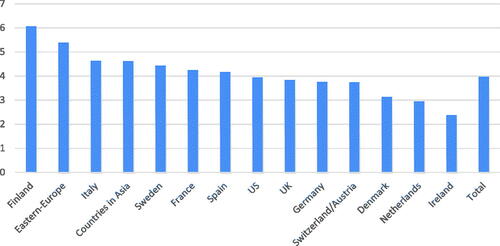
Finally, an important question is as to whether participation levels in activities can be increased. Data show considerable differences in the intention to participate in activities, depending on country (). Tourists from Finland (MFinland = 6.05, p < 0.01) and Eastern Europe (M = 5.38, p < 0.01) reported a significantly higher interest in (additional) activity participation than other tourists (MOthers = 3.94, p < 0.01). Notably, visitors from Eastern Europe already participate in many activities (0.65 per day), while tourists from Finland are not (0.28 per day), indicating that desirable activity levels may be different, depending on nationality. Here, Asian markets may also be of interest – while Asian tourists reported to have participated in very few activities, they expressed a considerable interest in experiences (M = 4.6; p < 0.01). As these visitors also have more favourable price perceptions of Norway, but only stay for short periods, marketing may have to make activity opportunities more visible, also with a view to increase length-of-stay. Nationalities with a low interest in activities include visitors from the Netherlands (Mactivities = 2.94, p < 0.01) and Denmark (Mactivities = 3.13, p < 0.05).
Figure 7. Number of activity types tourists would like to participate in.
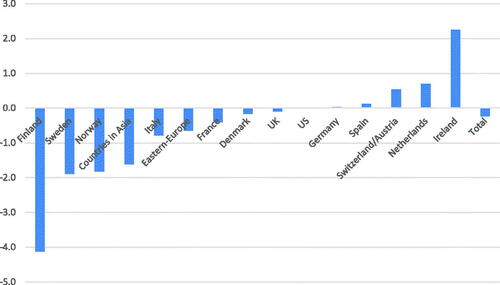
illustrates the gap between intended and actual activity participation. The greater the negative value, the greater is participation intention in comparison to actual participation. A positive values indicate that tourists already participate in high activity numbers compared to their intention to participate in further activities. Especially, tourists from the Nordic countries (Finland, Sweden, and Norway) tend to have higher intentions than actual participation rates for activities. In contrast, tourists from Ireland, Netherlands, Switzerland/Austria already participate in high numbers of activities, with limited interest in further participation.
Figure 8. Differences between actual number and intended number of activities.
Yet another group of interest for the marketing of activities are AirBnB guests, who reported a significantly higher intention to participate in activities than other tourists (MAirBnB = 5.32; Mothers = 3.85, p < 0.01), while hotel guests (MHotelGuests = 3.17; Mothers = 4.28, p < 0.01) reported low intentions. Notably, AirBnB guests also reported to have spent less money than planned, even though they already participate in higher activity numbers than other tourists. They consequently need to be considered a suitable group for marketing efforts in the context of activities, even though their price perceptions are less favourable, as are their overall spending patterns (). As AirBnB interferes with the residential housing market, the desirability of AirBnB guests will depend on the organisation of this platform, i.e. whether cities allow year-round rentals, or whether homes can only be made available temporarily, i.e. when permanent residents stay elsewhere. Notably, all tourists using the Internet to find information reported a significantly higher level of interest in activities (MInternetTourists = 4.09; Mothers = 3.37, p < 0.01). This, then, is another important insight for destination marketers, as they need to identify the channels used to identify activities, specifically in light of ongoing efforts to develop a Norway-specific platform for activities ().
Figure 9. Spending per day for different activities, in Norwegian Crowns.
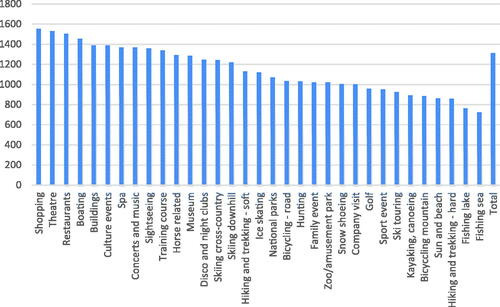
Table 3. Markets identified as suitable for the marketing of activities.
In comparison, tourists booked on package tours, who had been identified as having more favourable price perceptions of Norway, are considerably less interested in activities (MPackageTourist = 2.64; Mothers = 4.26, p < 0.01). A significantly lower interest in participation in activities was also expressed by repeat visitors in comparison to first time visitors (MRepeatVisitors = 3.51; MFirstTimeVisitors = 4.12; p < 0.01). These findings are validated against their actual participation in activities (MRepeatVisitors = 3.56; MFirstTimeVisitors = 3.79; p < 0.01). These latter findings are of importance because they indicate that a potential return visit may not be the best opportunity to market activities. Rather, it seems important that first time visitors become aware of the spectrum of opportunities, or that activities are marketed pro-actively. More knowledge is needed regarding the timing of booking activities, however.
In summary, the survey results were analysed on the basis of the assumption that activities are best suited to make a contribution to increasing LOS, to increase spending, to stimulate local economic development and hence to create employment. Results were framed against various parameters of relevance, including price perceptions, lower than expected spending, and interest in activities. These were again tested against nationality, holiday type, and accommodation choice. Results would support that AirBnB guests, two long-haul markets (Asia, USA), as well as two European markets (The Netherlands, Italy) may be the most relevant for the marketing of activities. This does not further distinguish the characteristics of the specific activities consumed by these tourist groups, an issue that should be considered in the future research.
Furthermore, a number of caveats need to be considered. First, visitors from The Netherlands are high spenders in terms of overall trip expenditure, but they expressed very limited interest in activities. It remains unclear whether pro-active marketing could convince Dutch visitors to spend more on activities, particularly since these visitors already have unfavourable price perceptions. On the other hand, AirBnB visitors are low spenders overall, also with unfavourable price perceptions, while they participate in many activities and expressed a strong intention to participate in more activities. This is of relevance given that this group reports to have spent less for the holiday than planned. Asian and Italian visitors also expressed considerable interest in activities, with Italians currently participating in fewer activities than the survey average. Here, it may be considered if language issues are a barrier to participation. US visitors are characterised by high incomes and favourable price perceptions, but only an average interest in additional activities.
These results provide many opportunities for DMOs to develop their product base. Two additional factors may be considered: Spending for different activities was found to vary, with some activities yielding considerably lower spending levels than others (). In the future, price optimisation of activities and their relative relevance for revenue generation may also be considered by DMOs, in consideration of tourist demand.
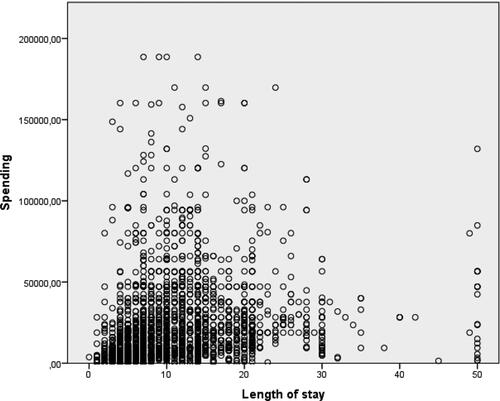
Figure 10. Scatterplot spending and length of stay, in Norwegian Crowns/day.
Discussion
This research studied a large sample of international leisure tourists with regard to price perceptions, net income, LOS, activities per day, spending per day, and activity intention.
This study suggests that it is advisable to focus on the development of specific segmented markets to optimise the Norwegian tourism system, i.e. those with more favourable price perceptions, high net incomes (as a proxy for spending options and market stability), high spending per day, greater LOS, and activity intention. These markets should make a greater contribution to destination development than others, though this may also involve trade-offs. Visitors from Asia and the USA (long-haul markets) as well as Italy (short-haul markets) were found to spend more on average, have significantly higher incomes, and more favourable price perceptions than the average tourist (). They also show greater interest in activity participation (Asia and Italy). Hence, it may be advisable to develop these markets. Visitors from the Netherlands could be another favourable market segment. They have lower net incomes, more negative price perceptions, and less favourable activity intentions, but they stay for significantly longer periods than other guests, and it may be possible to increase these visitors’ interest in activities. Trade-offs involve the carbon cost of each tourist. Visitors from Asia and the USA will travel far greater distances, and their contribution to climate change is greater. Increasing their LOS can help reduce carbon footprints per day in Norway. Currently, these markets stay for significantly shorter periods in Norway, possibly as a result of multiple destination visits.
This raises the question as to whether it is possible, and advisable, to increase LOS. As Barros and Machado (Citation2010, p. 702) highlighted, ‘high-spending tourists stay for shorter lengths of time’, while Grigolon, Borgers, Kemperman, and Timmermans (Citation2014, p. 166) affirmed that ‘[…] in general, longer lengths of stay are at first sight responsible for higher profits (i.e. regarding tourist accommodations), but shorter lengths of stay allow an increased number of tourists to visit a destination and make a larger contribution to tourism revenues, especially in the higher seasons’. These conclusions do not adequately capture the complexity of LOS. To illustrate this, LOS was analysed with regard to reported spending (). As the figure illustrates, there appears to be an increase in spending over time up to a certain point, the median split of the sample, which is 10 days, where it is possible to distinguish between visitors staying for this period of time as well as those staying longer. Correlation analysis between total spending and LOS does show unique patterns for the two groups, though both correlations are weak. While the correlation between LOS and total spending is positive and significant (r = 0.21, p < 0.01) for the shorter stay visitor group, it is close to zero and not significant in the longer-time visitor group (r = 0.04, p > 0.10). Hence, the economic contribution by visitors staying for longer periods is not necessarily determined, indicating opportunities for optimisation.
More generally, market segmentation to capture shorter staying, high spending vís-a-vís long-staying, moderate spending visitors (sensu Grigolon et al., Citation2014) is not a question of ‘either/or’, unless all accommodation is booked at capacity. Hence, increasing the average number of guest nights may be viable for most destinations during most of the year. Moreover, even for longer staying guests, there may be opportunities to increase spending. In the specific case of Norway, all four ‘recommended’ markets, i.e. Asia, USA, Italy, and The Netherlands spend more per day than the average tourist. If LOS was extended for visitors from Asia, USA, and Italy, average spending per day may decline. Yet, as the Dutch market illustrates, longer staying guests can still spend more than the average tourist. It should also be noted that AirBnB guests, who stay almost two and a half days shorter than the average tourist, spend less per day than the average visitor. Last, shorter stays incur a cost that should be considered. For instance, more arrivals require additional transport infrastructure, which is usually subsidised (Gössling, Fichert, & Forsyth, 2017), or additional staff, for instance to handle a greater number of room changes and cleaning. Long-distance visitors, if spending more time in Norway, may shorten their LOS in other destinations, which will be unfavourable for these destinations. However, they may also increase their overall stay or focus their visit exclusively on Norway: These are scenarios warranted from a viewpoint of climate change mitigation.
With regard to the rapidly emerging importance of online platforms, research indicates that AirBnB guests have less favourable price perceptions of south-western Norway, as well as net incomes considerably lower than the average tourist. They also stay for shorter periods and spend less money per day than the average visitor. This finding contradicts claims by some analysts (Jumpshot, Citation2016; Morgan Stanley, 2017). AirBnB guests are, however, the most frequent consumers of activities on a per day basis, and they are by far the most important visitors in terms of activity intentions (interest in further activities). While a focus on AirBnB guests is thus somewhat ambiguous from a destination viewpoint and should perhaps not be actively pursued in light of problems associated with the business model (e.g. Gutiérrez et al., Citation2017), it is meaningful to highlight activity opportunities to these travellers. Notably, AirBnB guests reported to have underspent their budgets, and it is thus likely that they can be encouraged to engage in more activities. AirBnB guests also spent more per day than tourists staying in bed and breakfast, or private accommodation.
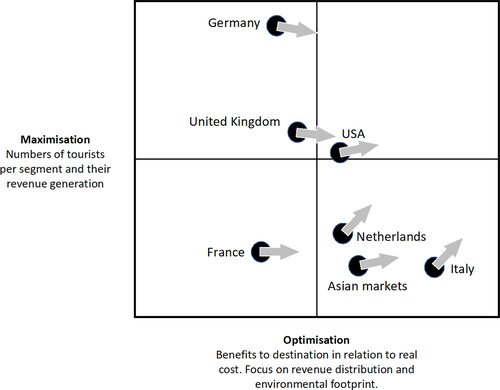
These findings are illustrated in , which demonstrates how destination managers may seek to develop various markets with regard to maximisation (more/fewer arrivals) as well as optimisation (marketing of activities). While all markets can be optimised with regard to activity consumption, focus should be placed on sustainable activities that will not increase perceptions of crowding. For instance, nature-based activities can attract travellers that stay longer (recreational fishing: M = 13.60 days; p < 0.01) or shorter (hunting: M = 8.40, p < 0.05), though both can generate very significant revenue.
Figure 11. Pathways to optimisation by market.
Destinations may use these results to more systematically develop markets on the basis of economic benefits, environmental impacts, and market resilience; and in consideration of each market segments’ relative importance. This is shown in , where maximisation and optimisation priorities are specified in the context of market segments and market size. Where the relative size of a market is to change, maximisation attributes related to revenue generation may be considered (existing spending, price perceptions, holiday budgets, LOS), while optimisation attributes may focus on parameters related to revenue distribution (spending by accommodation type, activity participation levels) as well as environmental outcomes (distance market to destination).
Table 4. Overview of maximisation versus optimisation attributes.
Results also support the more general view that ‘maximisation’ is a concept in need of reconceptualisation in view of ‘overtourism’, questions of economic distribution, and climate change; all of which demand new approaches to destination management (cf. Dwyer & Kim, Citation2003; Gössling et al., Citation2016). Currently, UNWTO (Citation2017) and national DMOs measure and compare ‘performance’ on the basis of indicators such as the share of global arrivals received, total arrival numbers and arrival growth, tourism employment, sector contribution to GDP, or tourism revenue. In light of challenges related to overtourism and climate change, destinations may rather seek to reduce tourist volumes, and to increase the benefits associated with each arrival, taking account of a broader range of performance criteria. These benefits need to be distributed, generating viable incomes and making a contribution to the circular economy. They need to be generated with environmental footprints that are small, and in line with climate change mitigation goals (ETC, Citation2018; Scott et al., Citation2016).
Some recommendations for DMOs may be deduced from the findings. First of all, ‘future’ indicators for destinations seeking to optimise the tourism system will require a more detailed understanding of tourist spending, interests, and other system characteristics, such as the development of LOS (leisure/business) and/or the carbon intensity of each arrival. Based on such data, destinations will be empowered to better target their marketing efforts at specific markets and segments, to develop new and attractive tourism products, and to reduce emissions from the tourism system. Where crowding is a problem, increasing LOS may represent a solution, though such interrelationships deserve to be better studied. Given high pressure on many destinations, as well as the need to immediately decarbonise tourism systems, destinations may also consider the introduction of departure taxes. Such market-based measures may have the triple advantage of reducing high growth rates, while increasing LOS and governmental revenue (ETC, Citation2018).
Conclusions
As with many other destinations, Norway has seen a rapid increase in tourist arrivals in recent years. This has sparked debates as to how to deal with crowding and related impacts, in what is widely perceived as ‘overtourism’ by residents and tourists. Within the emerging critical debate on maximisation, this study has sought to explore the role of activities as a form of tourism system optimisation. Results suggest that various forms of experiences, as cost-intense aspects of a holiday in south-western Norway, have the potential to stimulate spending, with positive side effects including opportunities for revenue generation and employment for small enterprises and in rural areas. Findings indicate that DMOs are well-advised to consider the development of new products in the context of spending and LOS by market. This also has repercussions for online reviews and reputation, with indications that tourists already perceive sites as unacceptably crowded.
In Norway, activity development may appeal to visitors from Asian markets, the USA, Italy and, potentially, The Netherlands in particular. These nationalities have the greatest economic value for Norway as a result of a combination of high relative net incomes, high spending patterns, more favourable price perceptions, or long periods of stay. Italy and The Netherlands have smaller environmental footprints, as a result of more limited amounts of energy needed for transportation. They also stay for longer periods and can thus reduce air transport infrastructure capacity demand. For this reason, any change in marketing should begin with these European markets. In comparison, the development of long-haul markets will increase the energy intensity of the Norwegian tourism system, for which there is little room under international decarbonisation agreements. Travellers who booked through AirBnB, as a specific tourist segment, were found to be less favourable with regard to any of the indicators of optimisation discussed in this article, but they reported the highest interest in activities. Overall, the insights are of considerable importance in terms of generating more stable and valuable tourism systems. They indicate that as destinations evolve, so does the need to consider more complex management approaches. New sets of indicators for DMOs should be developed that more adequately reflect emerging local and global challenges, such as the carbon intensity of tourism systems, as well as emerging issues of overtourism and revenue distribution. Optimisation of tourism systems can make an important contribution in this regard, for which data availability will be a key issue. DMOs are thus advised to more appropriately collect data from tourists, for instance when reservations are made or activities booked, so as to more systematically evaluate these for destination management against criteria for optimisation. They will also need to segment their markets differently and apply appropriate communications to reflect an optimisation strategy.
Disclosure statement
No potential conflict of interest was reported by the authors.
Additional information
Notes on contributors
Ove Oklevik
Ove Oklevik is an associate professor in marketing and statistics at Western Norway University of Applied Science, Norway. He holds a PhD in marketing from Norwegian School of Economics (NHH). He has published in journals such as Event Economics, Scandinavian Journal of Tourism and Hospitality, and International Journal of Contemporary Hospitality Management.
Stefan Gössling
Stefan Gössling is a professor at the School of Business and Economics, Linnaeus University and the Department of Service Management and Service Studies, Lund University, both Sweden. He is also a co-ordinator of tourism and transport research at the Western Norway Research Institute.
C. Michael Hall
Michael Hall is a professor in the Department of Management, Marketing and Entrepreneurship, University of Canterbury, New Zealand; docent, Department of Geography, University of Oulu, Finland; and a visiting professor, School of Business and Economics, Linnaeus University, Kalmar, Sweden. He has published widely on tourism, sustainability, resilience, regional development, environmental change, and World Heritage.
Jens Kristian Steen Jacobsen
Jens Kristian Steen Jacobsen is a professor at the University of Stavanger as well as the Institute of Transport Economics. He has specialised in aspects of mobilities and environmental perceptions. His recent publications encompass, for instance, perceptions and experiences of landscapes and other environments, place images and attractiveness, and use of social media and Web 2.0 in traveller information search and decision making.
Ivar Petter Grøtte
Ivar Petter Grøtte is a head of research at the Western Norway Research Institute. His interests include information and communication technologies, rural development, and technology innovation.
Scott McCabe
Scott McCabe is professor of Marketing and Tourism at the Nottingham University Business School, where he has worked for 11 years. He is currently Head of Professional Practice, responsible for continuing professional development activities in the school. He is also the current editor in chief (alongside Sara Dolnicar) of annals of tourism research and sits on the board of a number of other journals in tourism.
Related Research Data
References
- Addis, M. , & Holbrook, M. B . (2001). On the conceptual link between mass customisation and experiential consumption: An explosion of subjectivity. Journal of Consumer Behaviour: An International Research Review, 1 (1), 50–66.
- Alegre, J. , & Pou, L . (2006). The length of stay in the demand for tourism. Tourism Management, 27 (6), 1343–1355.
- Alén, E. , Nicolau, J. L. , Losada, N. , & Domínguez, T . (2014). Determinant factors of senior tourists’ length of stay. Annals of Tourism Research, 49 , 19–32.
- Andereck, K. L. , Valentine, K. M. , Knopf, R. C. , & Vogt, C. A . (2005). Residents’ perceptions of community tourism impacts. Annals of Tourism Research, 32 (4), 1056–1076.
- Ap, J . (1992). Residents' perceptions on tourism impacts. Annals of Tourism Research, 19 (4), 665–690.
- Barros, C. , & Machado, L . (2010). The length of stay in tourism. Annals of Tourism Research, 37 (3), 692–706.
- Barcelona Tourism (2016). Estadistiques de turisme. Barcelona: Ciutat I entorn. L’Ajuntament de Barcelona, la Diputació de Barcelona i el Consorci Turisme de Barcelona. Barcelona. Retrieved from http://www.barcelonaturisme.com/uploads/web/estadistiques/2016OTB2.pdf
- Blanke, J. , & Chiesa, T. (Eds.) (2013). The travel & tourism competitiveness report 2013: Reducing barriers to economic growth and job creation. Davos: Author.
- Brennpunkt. (2017). Shit O’hoi. Retrieved from https://tv.nrk.no/serie/brennpunkt
- Choi, S. C. , Mirjafari, A. , & Weaver, H. B . (1976). The concept of crowding: A critical review and proposal of an alternative approach. Environment and Behavior, 8 (3), 345–362.
- Croatia Ministry of Tourism (2016). Tourism in Figures 2015. Republic of Croatia.
- Dolnicar, S . (2014). Market segmentation approaches in tourism. In S. McCabe (Ed.), The Routledge handbook of tourism marketing (pp. 197–208). London: Routledge.
- Doxey, G. V . (1975). A causation theory of visitor-resident irritants, methodology and research inferences. The impact of tourism. Sixth Annual Conference Proceedings of the Travel Research Association, San Diego, pp. 195 – 198.
- Dwyer, L. , & Kim, C . (2003). Destination competitiveness: Determinants and indicators. Current Issues in Tourism, 6 (5), 369–414.
- Dwyer, L. , Pham, T. , Forsyth, P. , & Spurr, R . (2014). Destination marketing of Australia: Return on investment. Journal of Travel Research, 53 (3), 281–295.
- Dwyer, L. , Forsyth, P. , & Dwyer, W . (2010). Tourism economics and policy. Clevedon: Channel View.
- Dwyer, L. , Forsyth, P. , Fredline, L. , Jago, L. , Deery, M. , & Lundie, S . (2007). Yield measures for Australia’s special interest inbound tourism markets. Tourism Economics, 13 (3), 421–440.
- Dybedal, P . (2014). Profiles of foreign summer season tourism in Western Norway 2011. Oslo: Institute of Transport Economics.
- Emerson, R. M . (1976). Social exchange theory. Annual Review of Sociology, 2 (1), 335–362.
- ETC (European Travel Commission) (2018). Tourism and climate change mitigation. Embracing the Paris Agreement. Retrieved from http://www.etc-corporate.org/advocacy-sustainability
- Euromonitor 2017. Top 100 City Destinations Ranking. Euromonitor International. Retrieved from http://blog.euromonitor.com/2017/01/top-100-city-destination-ranking-2017.pdf
- Fjord, N . (2016). Topp attraksjoner. Retrieved from www.no.fjordnorway.com
- Gössling, S. , Hansson, C. B. , Hörstmeier, O. , & Saggel, S . (2002). Ecological footprint analysis as a tool to assess tourism sustainability. Ecological Economics, 43 (2-3), 199–211.
- Gössling, S. , Ring, A. , Dwyer, L. , Andersson, A.-C. , & Hall, C. M . (2016). Optimizing or maximising? A challenge to sustainable tourism. Journal of Sustainable Tourism, 24 (4), 527–548.
- Gössling, S. , Scott, D. , & Hall, C. M . (2015). Inter-market variability in CO2 emission-intensities in tourism: Implications for destination marketing and carbon management. Tourism Management, 46 , 203–212.
- Gössling, S., Fichert, F., & Forsyth, P. (2017). Subsidies in aviation. Sustainability, 9(8), 1295, http://www.mdpi.com/2071-1050/9/8/1295
- Grigolon, A. B. , Borgers, A. W. J. , Kemperman, A. D. A. M. , & Timmermans, H. J. P . (2014). Vacation length choice: A dynamic mixed multinomial logit model. Tourism Management, 41 (0), 158–167.
- Gutiérrez, J. , García-Palomares, J. C. , Romanillos, G. , & Salas-Olmedo, M. H . (2017). The eruption of Airbnb in tourist cities: Comparing spatial patterns of hotels and peer-to-peer accommodation in Barcelona. Tourism Management, 62 , 278–291.
- Guttentag, D . (2015). Airbnb: disruptive innovation and the rise of an informal tourism accommodation sector. Current Issues in Tourism, 18 (12), 1192–1217.
- Hall, C. M . (2008). Tourism planning (2nd ed.). Harlow: Pearson.
- Hall, C. M . (2009). Degrowing tourism: Décroissance, sustainable consumption and steady-state tourism. Anatolia, 20 (1), 46–61.
- Hall, C. M . (2014). Tourism and social marketing. Abingdon: Routledge.
- Hawkins, D. E. , Chang, B. , & Warnes, K . (2009). A comparison of the National Geographic Stewardship Scorecard Ratings by experts and stakeholders for selected World Heritage destinations. Journal of Sustainable Tourism, 17 (1), 71–90.
- Hurst, F . (1994). En route surveys. In J. R. B. Ritchie & C. R. Goeldner (Eds.), Travel, tourism, and hospitality research (pp. 453–472). New York, NY: Wiley.
- Independent. (2017). Eight places that hate tourists the most. Retrieved from http://www.independent.co.uk/travel/news-and-advice/places-hate-tourist-the-most-countries-ban-visitors-venice-thailand-amsterdam-japan-onsen-santorini-a7733136.html
- Innovation Norway . (2017). Key figures for Norwegian travel and tourism 2016. Retrieved from http://www.innovasjonnorge.no/contentassets/0d32e3231c0a4367a96838ee3bb5b294/key-figrues-2016.pdf
- Johnson, D . (2002). Environmentally sustainable cruise tourism: A reality check. Marine Policy, 26 (4), 261–270.
- Jumpshot. (2016). Airbnb infographic: Who uses Airbnb and why. Retrieved from https://www.jumpshot.com/airbnb-infographic-who-uses-airbnb-and-why
- Lankford, S. V . (1994). Attitudes and perceptions toward tourism and rural regional development. Journal of Travel Research, 32 (3), 35–43.
- Lawton, T. C . (2017). Cleared for take-off: Structure and strategy in the low fare airline business. London: Routledge.
- McCarthy, J. , & Prudham, S . (2004). Neoliberal nature and the nature of neoliberalism. Geoforum, 35 (3), 275–283.
- Mok, C. , Slater, B. , & Cheung, V . (1991). Residents’ attitudes towards tourism in Hong Kong. International Journal of Hospitality Management, 10 (3), 289–293.
- Morgan Stanley (2017). Surprising Airbnb Adoption Slowdown in US/EU, and What it Means for Hotels and OTAs. Retrieved from: http://www.fullertreacymoney.com/system/data/files/PDFs/2017/November/16th/ARCOST2017 1023211633_73976052-b8-11e7-863e-cb02ae2926cb_DigitalPremium.pdf
- Neuts, B. , & Nijkamp, P . (2012). Tourist crowding perception and acceptability in cities: An applied modelling study on Bruges. Annals of Tourism Research, 39 (4), 2133–2153.
- Nyaupane, G. P. , & Timothy, D. J . (2010). Power, regionalism and tourism policy in Bhutan. Annals of Tourism Research, 37 (4), 969–988.
- Patterson, M. E. , & Hammitt, W. E . (1990). Backcountry encounter norms, actual reported encounters, and their relationship to wilderness solitude. Journal of Leisure Research, 22 (3), 259–275.
- Perdue, R. R. , Long, P. T. , & Kang, Y. S . (1999). Boomtown tourism and resident quality of life: The marketing of gaming to host community residents. Journal of Business Research, 44 (3), 165–177.
- Popp, M . (2012). Positive and negative urban tourist crowding: Florence, Italy. Tourism Geographies. An International Journal of Tourism Space, Place and Environment, 14 (1), 50–72.
- Ridderstaat, J. , Croes, R. , & Nijkamp, P . (2016). The tourism development–Quality of life nexus in a small island destination. Journal of Travel Research, 55 (1), 79–94.
- Rideng, A. , & Christensen, P . (2004). En route surveys. Scandinavian Journal of Hospitality and Tourism, 4 (3), 242–258.
- Riganti, P. , & Nijkamp, P . (2008). Congestion in popular tourist areas: A multi-attribute experimental choice analysis of willingness-to-wait in Amsterdam. Tourism Economics, 14 (1), 25–44.
- Schiff, A. , & Becken, S . (2011). Demand elasticity estimates for New Zealand tourism. Tourism Management, 32 (3), 564–575.
- Scott, D. , Hall, C. M. , & Gössling, S . (2016). A report on the Paris Climate Change Agreement and its implications for tourism: Why we will always have Paris. Journal of Sustainable Tourism, 24 (7), 933–948.
- Sheldon, P. J. , & Var, T . (1984). Resident attitudes to tourism in North Wales. Tourism Management, 5 (1), 40–47.
- Skift. (2017). Summer of overtourism: 4 lessons for the travel industry. Retrieved from https://skift.com/2017/08/16/summer-of-overtourism-4-lessons-for-the-travel-industry
- SSB. (2017). Folkemengd 1 januar. Heile landet, fylke og kommunar. Retrieved from https://www.ssb.no/befolkning/statistikker/folkemengde/aar-per-1-januar
- Steen Jacobsen, J. K . (2003). Utenlandske turisters forbruk i Norge sommeren 2002. TØI rapport 636/2003. Oslo: Transportøkonomisk institutt.
- Stewart, W. P. , & Cole, D. N . (2001). Number of encounters and experience quality in Grand Canyon backcountry: Consistently negative and weak relationships. Journal of Leisure Research, 33 (1), 106–120.
- Stokols, D . (1972). A social-psychological model of human crowding phenomena. Journal of the American Planning Association, 38 (2), 72–83.
- Telegraph. (2018). Is Greece on the brink of an overtourism crisis? Retrieved from https://www.telegraph.co.uk/travel/destinations/europe/greece/articles/greece-overtourism-santorini
- Thrane, C. , & Farstad, E . (2012). Nationality as a segmentation criterion in tourism research: The case of international tourists’ expenditures while on trips in Norway. Tourism Economics, 18 (1), 203–217.
- Travel News. (2017). Innfører cruise-tak. Retrieved from http://travelnews.no/nyheter/innforer-cruise-tak/amp
- TripAdvisor. (2015). Norway in a Nutshell from Oslo to Bergen. Review of Fjord Tours. Retrieved from https://www.tripadvisor.com/ShowUserReviews-g190502-d1173124-r277589280-Fjord_Tours-Bergen_Hordaland_Western_Norway.html
- Turkle, S . (2015). Reclaiming conversation. New York, NY: Basic Books.
- Turner, L. , & Ash, J . (1975). The “golden hordes”: International tourism and the pleasure periphery. London: Constable Limited.
- UNWTO . (2014). Why tourism? Retrieved from http://www2.unwto.org/content/why-tourism
- UN World Tourism Organization (UNWTO) (2017). Yearbook of Tourism Statistics. Madrid, UNWTO.
- Ward, C. , & Berno, T . (2011). Beyond social exchange theory: Attitudes toward tourists. Annals of Tourism Research, 38 (4), 1556–1569.
- Weaver, D. , & Oppermann, M . (2000). Tourism management. New York, NY: John Wiley.
- World Economic Forum. (2017). Wish you weren’t here: What can we do about over-tourism? Retrieved from https://www.weforum.org/agenda/2017/09/what-can-we-do-about-overtourism
- World Bank (2017). Population. Retrieved from https://data.worldbank.org/indicator/SP.POP.TOTL