
Abstract
Tourism and recreation in protected areas may compromise conservation values if their forms and volumes exceed the area’s tolerance. Disturbance-sensitive species such as wild and semi-domestic reindeer (Rangifer tarandus tarandus) in most mountain areas in Fennoscandia are particularly vulnerable to humans, but disturbance research seldom includes data on the human component of this co-existence. By estimating the visitor volume in space and time and visitor characteristics in the largest national park and wild reindeer range in Norway we analyzed reindeer trail crossing propensity and examined the spatial overlap between humans and GPS-collared female reindeer (n = 98) during summer. The data showed that female reindeer herds used areas with overall less human traffic and recreational infrastructure. Reindeer herds started avoiding crossing hiking trails used by more than 10–15 persons per day and avoided crossing trails when visitor volumes exceeded 30–50 persons per day. During the hunting season, the herds were largely dispersed and crossed over trails independent of visitor volume, indicating a collective flight response to hunters. We discuss how including data on human use can further our understanding of ecological effects in disturbance research and how it can improve management interventions for better co-existence between humans and reindeer.
Introduction
One of the last herds of wild European reindeer rushes across the treeless landscape in a fluid motion. Knowledge of the routes, the timing, and the destination has been imprinted in the memories of young calves for millennia and makes up the core of the herd’s collective behavior (). They know where they are going. As the first storms sweep in from the west, the herd starts moving east toward its winter range, which offers better grazing conditions and a lower snow pack than the areas closer to the coast. The herd is, however, not alone. Hundreds of hunters are waiting along the known routes, as they have for millennia, hoping for a clear shot (Strand et al., Citation2012). This fall, every third animal will not make it to the winter range. Those who make the fall migration and survive the winter then prepare the reverse journey when winter loosens its grip, and the first rays of spring sunshine hold promise of bountiful summer forage. Along the way pregnant cows will give birth to the next generation before they proceed westward with their newborns. In the short summer that follows the animals need to build up muscle and fat reserves to make it another year. At the same time the tourist season reaches its peak, with thousands of hikers wanting to recharge and experience the Norwegian mountains (Flemsaeter et al., Citation2019).
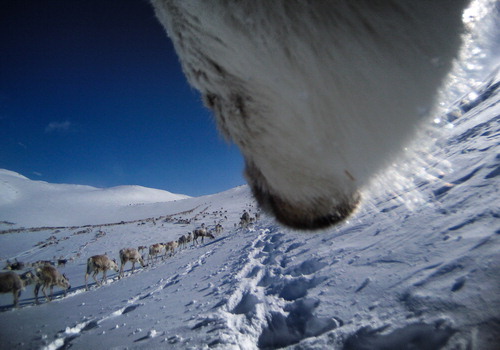
Figure 1. Wild reindeer seasonal migration at Hardangervidda range. Photo: Norwegian Institute for Nature Research.
Like most other ungulates, reindeer navigate a landscape of fear. In Norway, reindeer have been targeted by hunters for at least 10,000 years, and it is widely accepted that humans are perceived as predators by reindeer (Røed et al., Citation2014). In the recent centuries, however, concurrent land use changes have shifted the space available to reindeer to exhibit their flight responses (Reimers et al., Citation2006). Following industrialization, rapid and widespread development of heavy infrastructure has fragmented the mountain landscapes in Fennoscandia to the point of functional isolation with little to no gene flow among the populations (Kjørstad et al., Citation2017). Improved access also increased human presence in larger portions of the sub-ranges. Today, a new form of disturbance is on the rise. Tourism development in the form of outdoor recreation is rapidly increasing in rural regions and presents a new disturbance regime (Kaltenborn et al., Citation2014a). The challenge is to quantify it and discern how it affects reindeer. Previous research on the effects of infrastructure on reindeer habitat use has provided insight into the different kinds of avoidance responses, but this research has been conducted mostly in the fringes of their current ranges (e.g. Flydal et al., Citation2019; Skarin & Åhman, Citation2014). However, a new disturbance regime caused by human leisure activities interferes with reindeer (caribou) in a new way (Gundersen et al., Citation2019; Lesmerises et al., Citation2017; Citation2018; Nellemann et al., Citation2010). Hiking and backcountry skiing increasingly take place in wilderness-like areas that function as refuges for reindeer and that are often protected. These trends challenge management to balance conservation and use of the protected areas (Haukeland et al., Citation2010, Citation2013; Scolozzi et al., Citation2015). Current management of reindeer ranges increasingly need to consider the intensity of recreational use of “soft” infrastructure in remote mountain areas in addition to the piece–meal encroachment of heavy infrastructure along the fringes.
The role of interacting social and ecological processes in these systems have led to the social–ecological systems paradigm (Folke et al., Citation2005). Management of land and wildlife populations needs to be conducted within the constraints set by societal needs, values, and requirements, and similarly, development should not compromise biodiversity and ecosystem services (Allen et al., Citation2011; McFadden et al., Citation2011). To be most effective, management needs to consider the users that it will affect in addition to addressing the desired biological outcome (Bateman & Fleming, Citation2017; Monz et al., Citation2013). Management interventions to reduce disturbance of reindeer is people management, and internationally, sustainable management of natural resources has become increasingly challenging due to the immense human footprint on ecosystems and increased mobility in the human population. Most of the Norwegian mountain areas and national parks have observed increased human use, but receive relatively few visitors compared to national parks worldwide (Gundersen et al., Citation2015). Norwegian national parks are typically located in remote mountain areas and, by definition, have no roads and other heavy infrastructure (Holt-Jensen, Citation1978). Based on physical appearance, this corresponds more to the IUCN category I, wilderness areas, than category II, national parks. The principle of common access rights to all uncultivated land in Norway (Outdoor Recreation Act, Citation1957) is undisputable. Restricting access is thus highly controversial and very rarely used, even in protected areas (Kaltenborn et al., Citation2001; Nature Diversity Act, Citation2009). As a result, indirect approaches are more commonly applied in Norwegian national parks (Haukeland et al., Citation2010), for example by strategies to guide, inform or add/move/remove recreational infrastructure to direct the visitors to suitable areas that have less negative impact on reindeer (Manning, Citation2010).
Many studies from Fennoscandia have documented a range of responses by semi-domestic and wild reindeer to disturbance, including physiological changes (increased stress, activity, energy expenditure), altered behavior (less time spent on foraging), and changes in habitat use and migration routes (Flydal et al., Citation2019; Skarin & Åhman, Citation2014). This strongly supports the hypothesis of a spatial segregation between reindeer and humans (e.g. Nellemann et al., Citation2010; Panzacchi et al., Citation2013a, Citationb, Citation2015; Reimers & Colman, Citation2009; Strand et al., Citation2015; Vistad & Vorkinn, Citation2012), but infrastructure has largely been treated as a static attribute. As a consequence, the effects are often weak, variable or unclear (Flydal et al., Citation2019), or are impractical for managers working within constraints of existing infrastructure, where it is becoming more important to manage human presence. Adding spatiotemporal data on human use can be an important step toward improving the applicability of disturbance studies across large landscapes as this is internationally largely uninvestigated (Coppes et al., Citation2017; Gutzwiller et al., Citation2017; Monz et al., Citation2010). In this paper we propose an estimation method of human presence in a large national park using a combination of data sources.
Problem statement
Studies of disturbance on wildlife populations have previously treated human activity largely as an effect with constant magnitude (Bateman & Fleming, Citation2017). One has rarely had the opportunity to apply a more nuanced approach where the intensity of human travel varies in time, space, or among different user groups (Gutzwiller et al., Citation2017; Monz et al., Citation2010). However, without a description of the dynamic use of infrastructure it has been difficult to predict the effects of different disturbance regimes on wildlife populations, and, in turn, to come up with a more precise understanding of threshold levels or cumulative effects from human travel. If such precise knowledge is achievable, it will be very helpful in understanding human impact on wildlife populations, and particularly on reindeer populations in Norway. This will also be a necessary baseline when trying to agree on management goals for what constitutes acceptable use intensity (Haukeland et al., Citation2013; Tyre & Michaels, Citation2011). Obtaining accurate and usable visitor counts in remote backcountry settings is, however, challenging, especially in areas with dispersed use at both temporal and spatial scales (Kajala et al., Citation2007; Monz et al., Citation2010). Based on this, our aims with the paper are
Estimate spatial patterns of and intensity of use by visitors in the Hardangervidda area, both on and off marked trails, in three periods during summer and fall (low-, high- and hunting-season).
Present the spatial distribution of the reindeer herds in the Hardangervidda area during the three seasons.
Analyze reindeer trail crossings during the three seasons given trail use intensity, in comparison to trail use intensity of all available trails in the Hardangervidda area.
Discuss implications of such dataset as input in future disturbance research and for people management to better provide coexistence of visitors and reindeer in large mountain areas.
Material and methods
Study areas
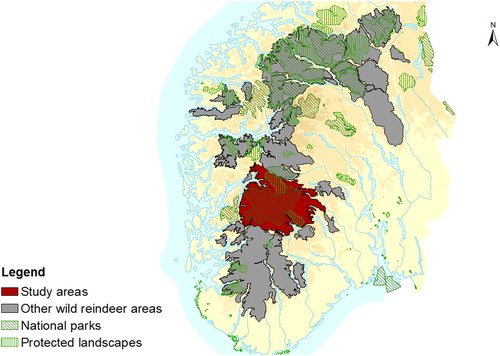
Hardangervidda national park (hereafter called NP) is one of 40 NPs in mainland Norway (). The NP was established in 1981 with a mandate to protect an intact and untouched alpine ecosystem that is important habitat for European wild reindeer. The park is 3422 km2, and lies entirely within the 8130 km2 Hardangervidda reindeer management unit (). The management unit encompasses alpine and subalpine ecosystems, and is the largest unit in the country. The reindeer management plan aimed to have a population size of 10,000 individuals during winter (Kjørstad et al., Citation2017). The management unit is located on a mountain plateau that forms the divide between east and west in Southern Norway. It spans climatic gradients, from an oceanic climate in the western part (high precipitation, mild winters) toward more of a continental climate in the eastern part (less snow cover, dry summers), and consequently encompasses a gradient of reindeer habitats. Historically, reindeer migrated to preferred seasonal habitats along these gradients (Gaare & Skogland, Citation1975; Strand et al., Citation2006), but now modulate their movements in response to infrastructure and disturbance. The reindeer use of the summer range was before the year of 2001 mostly in the northwestern part of Hardangervidda, an area that is seldom used in the period after 2001 (Gaare & Skogland, Citation1975; Strand et al., Citation2006).
Figure 2. Wild reindeer management areas in Southern Norway, including 23 distinct herds (in grey). The study area Hardangervidda wild reindeer area, including the National Park area, is in red.
The fringe area of the NP has a very high density of heavy infrastructure such as hydro-electric dams, main roads, gravel roads, private cabins, resorts etc., and recreational “soft” infrastructure like marked trails and tourist cabins. The northern part is intersected by highway Rv7, and the southern part is intersected by highway E134. Both roads are important transportation corridors between east and west and are large barriers for the reindeer movement (Strand et al., Citation2015).
The plateau has a relatively high density of marked trails and tourist cabins (mainly operated by the national trekking association, DNT) and sees moderate to high traffic on a national scale. Areas in the matrix between marked trails and tourist cabins are dominated by local users and wilderness seekers and have dispersed, low intensity use. Trolltunga in the west is the main attraction of the entire area, including a 14 km (28 km back and forth) marked trail with an elevation difference of approximately 1000 m. The visitation to Trolltunga has increased tremendously in the last years, from 15,000 visitors in 2013 to 80,000 visitors in 2018 (Selvaag et al., Citation2018). Trolltunga is situated inside the wild reindeer range with increases access to remote portions of the historical summer range (Strand et al., Citation2015).
Sampling of data on reindeer
In the period 2001–2018 a comprehensive research project has been implemented to identify management solutions to balance human use and protection of reindeer populations at Hardangervidda. Female reindeer were immobilized from helicopter and equipped with GPS collars. For each individual we obtained a location every 3 h from 15 June to 1 October, as this is the period when most visitors hike above tree line in the snow-free season. Outlying locations were identified and removed using the script provided in Bjørneraas et al. (Citation2010). Data processing and all analyses were performed using the software R.3.6.3 (R Core Team, 2020). In all, 98 female reindeer were tagged, which should ensure representative movement data for the highly herd-living Hardangervidda population in the period of 2001–2018 (). Longitudinal data on this scale are rare, and gives a unique look into the habitat use of reindeer over long periods of time. Position data are presented visually as density rasters based on the pooled GPS data set, using uniform kernel density estimation with a 200 m search radius (Heatmap plugin, QGIS 2.18).
Table 1. Number of GPS collared wild reindeer in the Hardangervidda range in the respective seasons.
Note that reindeer data refer only to females. Male reindeer seem to show different patterns of space use, however, male herds show higher tolerance for humans and often use fringe areas including areas with higher visitor volume (e.g. Strand et al., Citation2015). Oppositely, females are the most sensitive to summer disturbance factors, due to calving and the potential impact on fertility (Stankowich, Citation2008). Furthermore, note that although the results presented here are based only on the density of location for the GPS monitored individuals, our conclusions are also strongly supported by previous and ongoing studies investigating the fine-scale spatiotemporal dynamics of visitors and reindeer in wild reindeer ranges (Panzacchi et al., Citation2013a, Citationb; Citation2015).
Sampling of data on human use
The human use of the area was monitored in 2017 by using a combination of surveys with a short questionnaire in self-registration checkpoints at main park entrances (Selvaag et al., Citation2018), and by 68 automatic counters in 2016 (pre-project), 2017 and 2018. We performed an analysis of all possible entrances to Hardangervidda NP by studying aerial photo and infrastructure on map, and defined altogether 114 entrance points. Some of these entrances were not suitable for our methods, because they limited public access (private parking areas, small harbors etc.). We therefore truncated the dataset to include only those entrances that had a capacity for ≥20 cars and ended up with 35 main entrances. Here, we installed self-registration checkpoints from 15 June to 1 October, 2017. This is a commonly used method in Norway, and almost all 40NPs have up to date been assessed using this kind of survey. The sampling frame and methods is described in detail in Selvaag et al. (Citation2018). Self-registration cards were available in Norwegian, English and German. Each registration box was inspected 3 or 4 times over the summer. In all, 4980 self-registration cards were completed by individuals 14 years and older. The most common group sizes were two and three persons, and a few groups had more than 10 members (Selvaag et al., Citation2018). A test for non-response bias has been made for the checkpoints method (Wilberg, Citation2012), and the overall results showed some minor biases that were mainly in accordance with similar international studies on non-response surveys(e.g. Fredman et al., Citation2009; Hindsley et al., Citation2011): Local inhabitants were underrepresented, and highly educated people interested in nature conservation were to some extent overrepresented. However, we found no significant differences between a sample from these groups of visitors (locals, high-educated) and the entire survey material regarding trip characteristics, preferences, and attitudes (Selvaag et al., Citation2018), and we conclude that the survey sample was fairly representative for the people using the most popular entrances.
We measured visitor use at 27, 68 and 60 sites through automatic counters inside the NP during the summer season 2016, 2017 and 2018, respectively (15 June– 1 October). This was done by two kind of counters, EcoCounter (18 units) and TrafX (49 units), both with a pyroelectric sensor. The accuracy of the automatic counters is subject to both qualitative errors, as they can record movements that do not represent actual visitors, and technical errors, caused by characteristics of the counter or the installation site (Kajala et al., Citation2007). The effects of technical errors on the accuracy of counters have been intensively tested (Andersen et al., Citation2014) and operate in summertime within a ±5% accuracy with proper installation. Regarding qualitative errors we have corrected the number of counts for activity related to installation and operation of the counters. Installation of the counter sensor one meter above the trail ground exclude smaller animals like sheep and dogs but may also have missed some children. However, small children are always hiking together with adults that have been counted. Twenty-nine counters were placed in proximity to the self-registration boxes to calculate response rates for the survey. We counted 46,616 individuals on 28 locations (target population) during the time the self-registration boxes were operating, indicating an overall response rate of 10.7% (i.e. the 4980 respondents to the survey). In fact, the response rate is somewhat higher, because a person often fills out a questionnaire on behalf of a group of people.
Estimation of trail use index (TUI)
The Trail Use Index (hereafter called TUI) indicates the estimated number of people in each trail segment, per day (Gundersen et al., Citation2019). Note that although the TUI is correlated to the number of different visitors on each trail, it is not equal to such number. For example, a given visitor can walk the same trail segment back and forth and be counted twice, and a given visitor usually walks several trail segments. Hence, the TUI reflects the number of persons (but not necessarily different individuals) walking a given trail segment, which is an adequate measure regarding disruption to and impact on reindeer trail crossing. The day-to-day use of trail segments varies largely with factors such as weather conditions, day of the week, hunting period, and the timing of organized trips (Andersen et al., Citation2014). However, based on average levels of use we defined three different distinct periods during summer season: Low summer season (Jun 15–Jul 14), high summer season (Jul 15–Aug 19) and hunting season (Aug 20–Oct 1 ).
With several hundred trail segments in the Hardangervidda NP, we did not have the capacity to install automatic counters at all segments. Instead, each questionnaire respondent had the opportunity to draw their hiking routes on maps. We digitized all the hiking routes, identified trail segments in the NP, and obtained a pattern of visitor use. We defined a trail segment as the route from an entrance to the first trail junction or the route between two trail junctions inside the NP. The number of respondents that drew their routes on a particular trail segment accounted for a relative use of that particular trail segment compared to all the other trail segments identified. The use of each trail segment is the basic unit in the intensity map, describing both the spatial pattern of use and the relative volume of visitors on each trail segment. In all 2555 respondents drew their route starting their trip from the 35 main entrances, distributed over 180 trail segments. We used data from all the other counters on selected trail segments to test the accuracy of this estimation method. We compared estimates of day visitors at each segment with day counter data (157 counting sites) from 2017–2018, and the linear regression model from the trip drawings fit well with the counter data at Hardangervidda (Selvaag et al., Citation2018) and other wild reindeer ranges (Gundersen et al., Citation2019).
Analyzing TUI of trails crossed by reindeer compared to available trails
To analyze which trails reindeer crossed during the three seasons, and whether the TUI of these differed from all the available trails in the Hardangervidda area, we converted reindeer GPS locations with regular 3 h intervals into linear trajectories and spatially linked these to the trail segments. In cases where one reindeer trajectory crossed more than one trail segment, the trajectory was assigned the TUI value of the most intensively used trail segment. TUI values were binned by regular sequences of 5 (0–5, 5.01–10, etc.), and relative number of reindeer crossings and available trail segments (km) within each bin were calculated. Because the TUI values where highly asymmetrical (right skewed) we later log transformed this data (i.e. ln(TUI + 1) to produce only positive values). Patterns of reindeer crossings as a function of TUI, as well as all available trails, were analyzed using smoothing splines in general additive models (GAM), and model predictions were plotted each for the three seasons.
Results
Visitor volume and dynamics
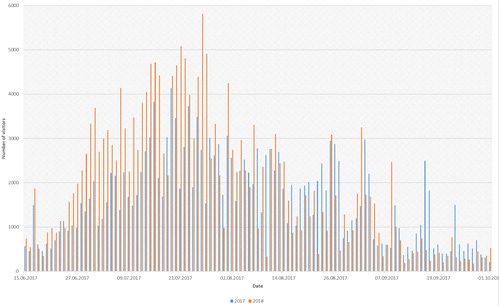
We counted a total of 332 307 persons passing by the 68 automatic counter sites at Hardangervidda during the summer 2017 (1 July–1 October) and 354 949 persons passing 60 counter sites in 2018. Out of this, 152 437 persons (46%) passed the counter at Trolltunga in 2017 and 142 206 (40%) persons in 2018, that is the main visitor attraction in the Hardangervidda NP. The peak visitation happened in the end of July and the beginning of August, and occurred somewhat earlier in 2018 than 2017 (). The intensity of visits fluctuated daily over the entire season (i.e. all three periods), but was particularly pronounced during the low season and hunting season, when visitation rates were much higher on weekends than on weekdays. The number of visitors was substantially lower during the hunting season than the high visitor season, and was highest during the first week (Aug 20–Aug 27). Our year-round counters (n = 8) showed a seasonal rhythm with high use intensity in the summer season (July–September), followed by a period of low use during late autumn and early winter (October–March). The intensity increased a bit in the late winter–early spring (noticeably around Easter), and then decreased to a minimum in May during snowmelt. The counters also depict the day-to-day variation that can be explained by weekdays vs. weekends, holidays, and weather conditions. Another prominent characteristics from the counter data is that about 90% of the counts are within a 12 hours daily time span from 08:00 to 20:00.
Figure 3. Number of visitors passing by 68 (2017) and 60 (2018) automatic counters during the period of 15 June–1 October at all main entrances and selected trail segments within the Hardangervidda NP.
Visitor profile based on questionnaires
Hardangervidda NP is frequently visited on daytrips and is also a prominent tourist destination with high proportions of foreign visitors, first-time visitors and visitors that used marked trails only (). Very few respondents used the areas outside marked trails (2%), and out of all visitors, 9% can be classified as strong purist seeking solitude and authentic experiences in wilderness-like areas (Vistad & Vorkinn, Citation2012). Local residents (3% of all respondents) typically know the area well and commonly use different parts of the NP, often in conjunction with other activities such as herding, fishing, hunting, or berry picking. In general, local visitors are underrepresented in such surveys (Fredman et al., Citation2009; Wilberg, Citation2012), but 3% of the survey sample is a very low number compared to comparable data from the other 39 NPs in Norway (data not shown). This indicates that a very low proportion of the users at Hardangervidda (Trolltunga excluded) are local residents living in the eight neighboring municipalities. Two percent of the visitors were part of an organized trip. Most of the visitors did not have much knowledge about the area (rating of “very poor” or “poor” knowledge), but were satisfied or very satisfied with the outdoor facilities in the park.
Table 2. User profile of the visitors to the Hardangervidda National Park: Based on the onsite survey using self-registration checkpoints at the 34 main entrances (n = 4980 respondents). The entrance Trolltunga was excluded from the material.
Trail use index and reindeer density
We identified large variations in the intensity of trail use by the visitors within the study area (). Some sections of the study area have a dense network of trails that see a high intensity of use, whereas other areas have few trails and low intensity of use. Especially the northwestern and northern parts of Hardangervidda NP had very high trail densities and intensities of use.
Figure 4. Trail Use Index (mean values for 2017 and 2018) and location of 98 GPS monitored reindeer in Hardangervidda NP area during low summer season (Jun 15–Jul 14) in the period of 2001–2018.
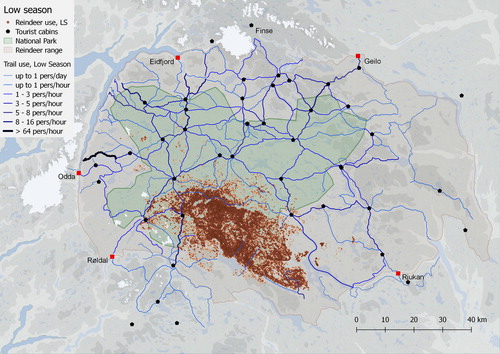
Figure 5. Trail Use Index (mean values for 2017 and 2018) and location of 98 GPS monitored reindeer in Hardangervidda NP area during high summer season (Jul 15–Aug 19) in the period of 2001–2018.
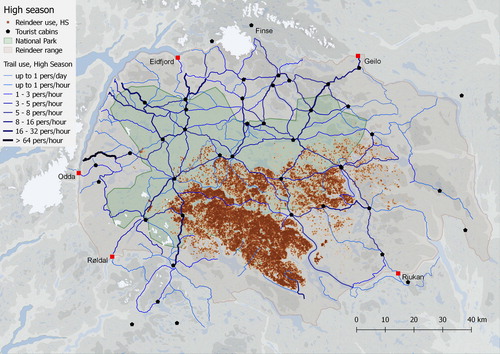
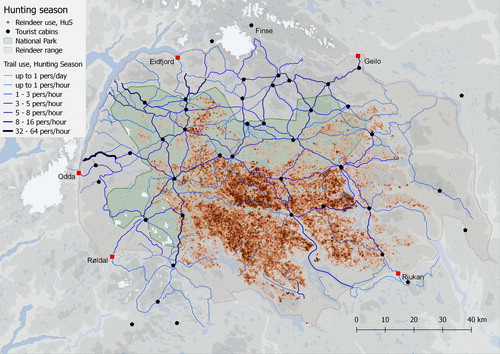
Figure 6. Trail Use Index (mean values for 2017 and 2018) and location of 95 GPS monitored reindeer in Hardangervidda NP area during hunting season (Aug 20–Oct 1) in the period of 2001–2018.
Reindeer were concentrated in the southeastern area during the low and high summer seasons ( and ), but were more dispersed during the hunting period (). A qualitative inspection of the maps indicate a seasonal large-scale segregation, where reindeer use areas with lower density of trails or areas with trails with minor use during the whole summer (15 June–20 August; both low and high summer seasons). During this period the reindeer used only about 20% of potential total summer grazing areas. The locations most frequently used by reindeer were in the areas much less frequently used by humans, characterized by no marked trails or tourist cabins ().
During the hunting season the situation was different, and the reindeer used a much larger area. However, areas in the west and in the fringe in the north were not used by reindeer during the hunting season, even though historic records suggest these areas were used in late summer and early fall. In the hunting period, the visitor traffic is somewhat lower overall, but some trails in the fringe areas in the western and northern part are important for multiple-day hiking and day-trips in this period.
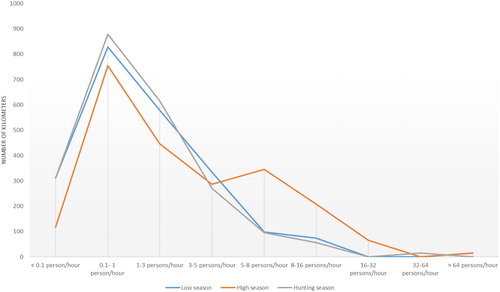
In all we identified 2241 km of hiking routes in the Hardangervidda area derived from the visitor’s drawings (). There were very different intensities of use between the segments. Most trail segments saw less than 1 person per hour. There was only one segment with a higher intensity than 64 persons per hour, the Trolltunga trail, which exceeded 64 persons per hour both during low and high summer season. We identified 635 km of trail (28% of all segments) with more than 30 visitors per day during the high summer season (). The similar figures in the low summer season were 523 kilometers and 23% of all segments. The most intensively used trails were in the fringe areas, but there were several trails with high level of use in the center of the Hardangervidda NP ().
Figure 7. Number of kilometers in each Trail Use Index class (mean values for 2017 and 2018) during low summer season (Jun 15–Jul 14), high summer season (Jul 15–Aug 19), and hunting season (Aug 20–Oct 1) in the Hardangervidda NP.
Trail use index and reindeer crossing
We identified that reindeer prefer to cross trails with low TUI intensity compared with high TUI intensity for all seasons (). During low and high summer seasons, the relative number of reindeer crossings were substantially higher at low TUI trails than of trail availability (). As TUI increased the numbers of reindeer crossings dropped below availability, indicating that reindeer actively avoided crossing intensively used trails. During hunting season () reindeer crossings followed the same pattern as trail availability, indicating no selection or avoidance of trails based on intensity of human use.
Figure 8. Relative distribution of reindeer crossings and available trails in the Hardangervidda area as a function of human trail use (TUI) during low tourist season (Jun 15–Jul 14), high tourist season (Jul 15–Aug 19), and hunting season (Aug 20–Oct 1) 2016–2018. TUI values were binned and converted to a logged scale (ln(TUI + 1)). Patterns of use and availability were fitted by smoothing splines in general additive models.
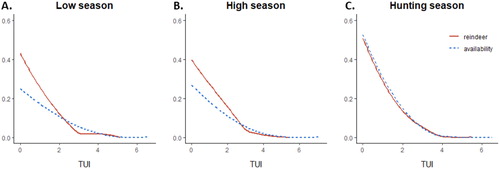
The analyses indicate that the reindeer herds during low and high summer seasons started avoiding trails used by more than 10–15 persons per day (i.e. ln(TUI + 1) = 2.2–2.7) and refrained from crossing when intensity increased to more than 30–50 persons per day (i.e. ln(TUI + 1) of 3–4). These analyses did not identify an absolute threshold value for ceased movement, but we observed trails crossing at a maximum of 239 persons per day on one trail segment in the hunting season.
Discussion and implications
The human component in disturbance research
Recent studies on the spatial and temporal overlap of reindeer and humans have addressed the gap between scale of investigation and the scale of the disturbance (Flydal et al., Citation2019; Skarin & Åhman, Citation2014). Our data showed that a relatively high proportion of the trail segments (48%) experienced only up to 10 person/day; a much lower proportion (15%) of the segments had more than 50 persons/day on average; and the most intensely used trail segment had on average 1777 persons/day in the period 15 July to 20 August 2018. Our reindeer density and trail crossing data showed that this enormous spatial variation in human use is likely to have differential impacts on wild reindeer movement and habitat use. We interpret our data to be an indication of strong negative spatiotemporal relationship between occurrence of humans and reindeer during summer. These findings were derived from analyses that showed a reduction of reindeer trail crossing by increasingly human trail use (2016–2018) and from visual inspection of maps that showed spatial segregation between human use (2017–2018) and reindeer density (2001–2018). Internationally, there are very few disturbance studies on reindeer and caribou that have included temporal use of infrastructure. Leblond et al. (Citation2013) identified a positive correlation between caribou avoidance of roads and disturbance level on the roads, and they concluded that: “Our study showed that the avoidance behavior of a large, disturbance-sensitive herbivore is related to disturbance intensity”. Lesmerises et al. (Citation2017, Citation2018) found that there exists a vigilance–feeding tradeoff related to the intensity of hikers and functional loss of habitat as result of the intensity of backcountry skiing. These studies and our results illustrate that the responses of reindeer to human activity are complex, and that our understanding of them can be improved by precise data on human usage intensity. Much of the progress in disturbance research has come from our ability to obtain more detailed information on reindeer habitat use (Panzacchi et al., Citation2013b, Citation2015). Adding detail on the human component can represent an important step toward a more comprehensive understanding of thresholds and tolerance levels for wildlife in general (Bateman & Fleming, Citation2017; Gutzwiller et al., Citation2017). Gathering data on human use of large and remote ranges is complex, challenging and time consuming (Monz et al., Citation2010). However, new technology now enables researchers to sample data on reindeer (from GPS tags) and human use (from in situ automatic counters, self-registration checkpoints) at regional and long-term scales at an affordable cost (Gundersen et al., Citation2019). Thus, we argue that improved quantitative data on the human use of infrastructure as input in empirical analyses will substantially increase our knowledge of the impacts of disturbance and the effects of management interventions.
Even though these findings result from a comprehensive empirical dataset from Hardangervidda NP, it is not a mechanistic analysis of reindeer habitat selection. However, our study is the first to describe the spatial and temporal pattern of human use at a very large spatial extent (>8000 km2) with dispersed human use, and based on the results we hypothesize that human use is an important factor in explaining the concentrated space use by GPS collared female reindeer herds in summer since 2001. This is supported by earlier habitat selection models that indicated potentially suitable reindeer summer habitats distributed over most parts of the Hardangervidda wild reindeer range (Falldorf, Citation2013). A weakness here is that the data on human use is from a short period (2016–2018) relative to the long-term series of reindeer data. There may be some changes in the human use of the area in this period (e.g. the increasing popularity of Trolltunga), but based on data from hotel and tourist cabin stays (Strand et al., Citation2006, Citation2015) and the fact that there have been very few changes in the recreational infrastructure during this period (Selvaag et al., Citation2018), we may assume that the spatial and temporal pattern of human use from 2017 to 2018 is fairly representative for the period 2001–2018. Our study shows some overall patterns that are supported by ecological studies from other reindeer areas in Norway (Kjørstad et al., Citation2017), and that generate hypotheses to be formally tested.
Management of ungulate populations is characterized by a long history of collaboration between managers and scientists, which produced a relatively good understanding of population dynamics, density dependent processes, effects of harvest, space use and life history for the focal species (Strand et al., Citation2012). Today’s reindeer management puts increasing attention to spatially explicit issues related to land management in each management unit, and by explicitly including the human dimension. Many of the wild reindeer ranges in Southern Norway overlap with national parks, and park management is faced with a tradeoff between allowing for increased tourism development and conserving Europe’s last remaining wild reindeer herds (Kjørstad et al., Citation2017). Despite this apparent tradeoff, we have here showed that there could be large potential for “sharing space” in NPs through spatial and temporal segregation of visitor activities from core reindeer areas. There is therefore a need to understand reindeer habitat selection in relation to different levels of human presence on the landscape (Gundersen et al., Citation2019).
Management intervention to change human behavior
A wide range of methodologies has been developed to deal with the complex dynamics of social–ecological systems, including management strategies that explicitly aim at increasing knowledge, reducing uncertainty, and increasing the legitimacy in the implementation phase by involving the stakeholders (Allen et al., Citation2011). Wildlife managers and land policy makers are thus faced with the challenge to harmonize the complexity of competing societal needs, stakeholders, individual requirements and wildlife management goals. Such challenge has to be tackled in light of a certain degree of uncertainty associated to each of these layers, which may grow throughout the decision-making process (McFadden et al., Citation2011; Tyre & Michaels, Citation2011). With the recent shift in national park policy follows an increased demand for knowledge-driven management, which needs to be largely site specific (Haukeland et al., Citation2010). Governmental initiatives to improve rural economies cannot come at the expense of conservation values, and any business development is regulated by the same laws and statutes as before the initiative was launched. It is therefore imperative that management strategies are adaptive and driven by defensible analyses (Allen et al., Citation2011).
Our findings have implications for managing outdoor recreation in way that can minimize detrimental effects on reindeer populations. First, results from the surveys showed that most visitors use designated recreational infrastructure (main entrance, marked trails, bridges, tourist cabins), and on the contrary, very few hiked off marked trails. This suggests that there are potentially large refuge areas in the matrix between recreational infrastructure in the Hardangervidda NP, but we have showed that the reindeer herds refrained from crossing over heavily used trails to reach these areas. Even though most of the heavily used trails are in the fringe areas, some trail segments in the central part of Hardangervidda have high intensity of use in parts of the summer. This may be one of the most important reason that the reindeer herd at Hardangervidda currently uses only about 20% of the available summer grazing area resources (Strand et al., Citation2015). We identified several trail segments in the historical core summer range which constrain the herd’s space use. These marked trails are located east and north of the core summer grazing area and may prevent the animals to move to the western and northern part of Hardangervidda NP. Especially the western part of the area historically encompassed important summer grazing areas for the herd that have not been used in the GPS collaring period from 2001 (Gaare & Skogland, Citation1975). Long-term effects of concentration of the herds and potentially overgrazing in a relatively small area during the summer have not been studied. It is a high priority management goal to increase the reindeer space use and movement (Hardangervidda National Park Management Plan 2011). To reach this goal it may be necessary to remove some of the most problematic trails and cabins (e.g. Nellemann et al., Citation2010), or introduce other kind of restrictions that reduce the volume of visitors in summer in these areas.
Few studies have estimated the spatial and temporal dynamics of human use of recreational infrastructure in large remote areas (Gutzwiller et al., Citation2017; Monz et al., Citation2010; Riungu et al.,Citation2018). Our data show that intensity of use of the trail network in Hardangervidda NP varied substantially. In general, the majority of trails see low intensity use (i.e. less than 20–30 persons a day) in the area. The greater Hardangervidda plateau resembles wilderness and the use of the area is dominated by low-intensity outdoor recreation activities like hiking, fishing, hunting, and others uses that focus on the experience of a pristine landscape. Public right of access and the tradition of outdoor recreation in Norway is for comparison much less commercialized and specialized than outdoor recreation activities available in North America (Kaltenborn et al., Citation2001). Translated directly as “every man’s right” (allemannsretten in Norwegian), the law grants any one the right, with in certain restrictions, to roam freely across private and public land, and to pick wildberries, mushrooms and flowers, collect drywood for campfire, and put up a tent, although no closer than 150 m from private homes and cabins. This freedom to enjoy nature comes with responsibilities, and assume good judgment by everyone involved. Direct visitor management measures such as zoning of use and quota restrictions are rarely applied in Norwegian national parks. Instead, indirect approaches to channeling visitors and physical site-specific management measures are more common. One important approach is to use physical infrastructure strategically for visitor guidance. Examples include visitor centers, viewpoints, information plates, marked trails, campsites and bridges that will attract and concentrate visitors in a particular area, while protecting valuable natural resources at same time. As the concept of protected areas (often within wild reindeer range) is shifting from “protection from people” to “sustainable use”, a much deeper understanding of responses to anthropogenic disturbance is urgently needed to support sustainable and more flexible management strategies (Kaltenborn et al., Citation2014b). One of the main challenges is thus to manage visitors by different types of site-specific measures and facilities (Manning, Citation2010; Riungu et al., Citation2018). For example, in backcountry hiking areas, management is largely about trail management, since most use occurs along marked trails (Gundersen et al., Citation2015). Trail restrictions are most likely to be accepted – and hence most effective – for those who use services and infrastructure in the mountain areas, as long they have other options for their hikes. However, any kind of area restrictions (space and time) will provoke locals, visitors participating in subsistence harvesting, and wilderness seekers. There can be considerable variation in user profiles across reindeer ranges. Improved knowledge abouthuman use of these area can be a critical component for assessing how acceptable new management interventions could be.
Management zoning as a tool for sharing space
Our results suggest that the segregation between reindeer and visitors during low and high summer seasons depends in part on the amount of recreational infrastructure and the intensity of use of the infrastructure, and this is in line with former research that have studied cumulative disturbance from “soft” infrastructure (e.g. Panzacchi et al., Citation2013a). In the low and high tourist seasons our analyses indicate that the most used trails in reindeer core areas caused problem for the reindeer to cross over, and thus limited their space use. During the hunting period, however, the reindeer are, continuously disturbed by hunters. This “state of emergency” causes the herd to cross trails and coincidentally use a large part of its range. It is a paradox that this stressed behavior can have management advantages, since the herd sometimes starts to reuse historically important areas and migration corridors during the hunting season (Panzacchi et al., Citation2013a). The reindeer were more dispersed during the high summer season than during the low summer season (earlier in summer). The main reason for this is likely that the females consider the risk for crossing large rivers for the calves to be too high early in the summer (Strand et al., Citation2006). The area uses for the reindeer in the period 2001–2018 have been narrowed to a smaller area in the southeast corner of Hardangervidda NP during the low summer season. Earlier analyses have stated that large areas at Hardangervidda are suitable calving areas (south-facing slopes, early spring, grazing resources etc.; Panzacchi et al., Citation2015), and the herd has had calving areas much further west and south before the GPS collaring period (Strand et al., Citation2006). It is not easy to interpret the reasons for observed patterns, and both biotic and abiotic factors may have implication for the choice of calving areas in May. Especially, cross country skiing between public tourist cabins in the late winter may also affect the choice of calving areas (Strand et al., Citation2006).
If a true socio–ecological systems approach were to be adopted, the primary challenge is to balance human presence with reindeer conservation. Thus far, trail restrictions or other types of active separation of reindeer and people have not been implemented in Norwegian NPs. The only active measure has been to reduce the degree and rate of encroachment into the protected area, showing a skewed balance toward tending more to human development than to reindeer conservation. Restricting access to certain areas would level out the imbalance and uphold the ecological portion of the social–ecological systems idea. Based on this segregation we suggest a simple three-part zoning strategy that consider different zones: Wilderness areas, backcountry hiking areas, and main entrance areas (Gundersen et al., Citation2019). Wilderness zones are equivalent to refuge areas for reindeer. In these areas we suggest no future development of recreational infrastructure, and existing infrastructure may be subject to removal if they jeopardize access to important functional areas. Backcountry hiking areas take place at the main network of recreational infrastructure at Hardangervidda NP, in most cases marked trails between the tourist cabins. Backcountry infrastructure includes simple facilities like bridges, information boards, maps, signs etc. There may be the largest conflicts between tourism and reindeer in the backcountry zone, and in sections with high conflict levels it may be necessary to remove infrastructure or regulate their use. Examples of such situations include marked trails that act as barriers for reindeer, where an alternative to removing the trail is to regulate the number of visitors. In the entrance zone, development of new infrastructure may attract visitors for mountain experiences and at same time deter them from using areas in the core reindeer areas.
Trail use estimates revealed that segments in the central part of the park had relatively low number of visitors compared to entrance areas. An overall strategy should be channel visitors to the fringe areas and reducing the intensity in sensitive reindeer area. The current management plan allows differential management between fringe and core areas, which essentially is zonation (Riungu et al., Citation2018). Our findings have implications for the success of marketing destinations in the fringe areas, for example keeping the day-trip and first-time visitors in the fringe areas could imply that they stay out of the sensitive reindeer area. The appropriate destination attractions and activities should be allocated and presented to visitors in order to enhance destination competitiveness in the fringe areas, e.g. also provide some kind of wilderness-like experiences the feeling of solitude and authentic experiences (Vistad & Vorkinn, Citation2012). These strategies may be strengthened by a marketing and information strategy to pull the visitors to sites with appropriate attractions and at same time cause less strain on the conservation values of the NP. To know that their presence and behavior in the fringe areas of Hardangervidda NP does not compromise reindeer conservation may also be important for many tourists.
Disclosure statement
No potential conflict of interest was reported by the author(s).
Additional information
Notes on contributors
Vegard Gundersen
Vegard Gundersen has particular interests within the field of outdoor recreation and human dimension of nature. His research often includes the interface between human use and ecology including both qualitative and quantitative research methods.
Knut Marius Myrvold
Knut Marius Myrvold is an ecologist and specialist in river ecosystems, including fish and invertebrates, but also terrestrial wildlife. His work includes in particular population ecology, habitat selection, ecological connectivity, predation, conservation biology and modelling of socio-ecological systems.
Geir Rune Rauset
Geir Rune Rauset is an ecologist working with population ecology and management aspects of large carnivores and ungulates in the Nordic countries using different quantitative methods and analyzes.
Sofie Kjendlie Selvaag
Sofie Kjendlie Selvaag works mostly with visitor surveys and monitoring to support management actions in national parks and other vulnerable nature areas. She has also done research on outdoor recreation and nature-based tourism in general.
Olav Strand
Olav Strand is an ecologist with particularly interest of mountain ecosystems, population ecology, predation and conservation biology of mostly wild reindeer and arctic fox.
References
- Allen, C. R., Fontaine, J. J., Pope, K. L., & Garmestani, A. S. (2011). Adaptive management for a turbulent future. Journal of Environmental Management, 92(5), 1339–1345. https://doi.org/10.1016/j.jenvman.2010.11.019
- Andersen, O., Gundersen, V., Wold, L. C., & Stange, E. (2014). Monitoring visitors to natural areas in wintertime: Issues in counter accuracy. Journal of Sustainable Tourism, 22(4), 550–560. https://doi.org/10.1080/09669582.2013.839693
- Bateman, P. W., & Fleming, P. A. (2017). Are negative effects of tourist activities on wildlife over-reported? A review of assessment methods and empirical results. Biological Conservation, 211, 10–19. https://doi.org/10.1016/j.biocon.2017.05.003
- Bjørneraas, K. A. R. I., Moorter, B. R. A. M., Rolandsen, C. M., & Herfindal, I. V. A. R. (2010). Screening global positioning system location data for errors using animal movement characteristics. Journal of Wildlife Management, 74(6), 1361–1366. https://doi.org/10.2193/2009-405
- Coppes, J., Burghardt, F., Hagen, R., Suchant, R., & Braunisch, V. (2017). Human recreation affects spatio-temporal habitat use patterns in red deer (Cervus elaphus). PLoS One, 12(5), e0175134. https://doi.org/10.1371/journal.pone.0175134
- Falldorf, T. (2013). Habitat use of wild reindeer (Rangifer t. tarandus) in Hardangervidda, Norway. NINA Report 1530. Norwegian Institute for Nature Research.
- Flemsaeter, F., Gundersen, V., Rønningen, K., & Strand, O. (2019). The beat of the mountain: A transdisciplinary rhythmanalysis of temporal landscapes. Landscape Research, 44(8), 937–914. https://doi.org/10.1080/01426397.2018.1535652
- Flydal, K., Tsegaye, D., Eftestøl, S., Reimers, E., & Colman, J. E. (2019). Rangifer within areas of human influence: Understanding effects in relation to spatiotemporal scales. Polar Biology, 42(1), 1–16. https://doi.org/10.1007/s00300-018-2410-6
- Folke, C., Hahn, T., Olsson, P., & Norberg, J. (2005). Adaptive governance of social–ecological systems. Annual Review of Environment and Resources, 30(1), 441–471. https://doi.org/10.1146/annurev.energy.30.050504.144511
- Fredman, P., Romild, U., Emmelin, L., & Yuan, M. (2009). Non-compliance with on-site data collection in outdoor recreation monitoring. Visitor Studies, 12(2), 164–181. https://doi.org/10.1080/10645570903203471
- Gaare, E., & Skogland, T. (1975). Wild reindeer food habits and range use at Hardangervidda. In Fennoscandian tundra ecosystems. (pp. 195–205). Springer.
- Gundersen, V., Mehmetoglu, M., Vistad, O. I., & Andersen, O. (2015). Linking visitor motivation with attitude towards management restrictions on use in a national park. Journal of Outdoor Recreation and Tourism, 9, 77–86. https://doi.org/10.1016/j.jort.2015.04.004
- Gundersen, V., Vistad, O. I., Panzacchi, M., Strand, O., & Moorter, B. V. (2019). Large-scale segregation of tourists and wild reindeer in three Norwegian national parks: Management implications. Tourism Management, 75, 22–33. https://doi.org/10.1016/j.tourman.2019.04.017
- Gutzwiller, K. J., D'Antonio, A. L., & Monz, C. A. (2017). Wildland recreation disturbance: Broad–scale spatial analysis and management. Frontiers in Ecology and the Environment, 15(9), 517–524. https://doi.org/10.1002/fee.1631
- Hardangervidda National Park Management Plan (2011). County Governor of Buskerud. Telemark and Hordaland.
- Haukeland, J. V., Grue, B., & Veisten, K. (2010). Turning national parks into tourist attractions: Nature orientation and quest for facilities. Scandinavian Journal of Hospitality and Tourism, 10(3), 248–271. https://doi.org/10.1080/15022250.2010.502367
- Haukeland, J. V., Veisten, K., Grue, B., & Vistad, O. I. (2013). Visitors’ acceptance of negative ecological impacts in national parks: Comparing the explanatory power of psychographic scales in a Norwegian mountain setting. Journal of Sustainable Tourism, 21(2), 291–313. https://doi.org/10.1080/09669582.2012.692685
- Hindsley, P., Landry, C. E., & Gentner, B. (2011). Addressing onsite sampling in recreation site choice models. Journal of Environmental Economics and Management, 62(1), 95–110. https://doi.org/10.1016/j.jeem.2010.10.007
- Holt-Jensen, A. (1978). The Norwegian wilderness: National parks and protected areas (Tokens of Norway). Tanum-Norli.
- Kajala, L., Almik, A., Dahl, R., Diksaitè, L., Erkkonen, J., Fredman, P., … Wallsten, P. (2007). Visitor monitoring in nature areas: A manual based on experiences from the Nordic and Baltic countries (pp. 39–45). TemaNord 2007:534. Swedish Environmental Protection Agency, Nordic Council of Ministers.
- Kaltenborn, B. P., Haaland, H., & Sandell, K. (2001). The public right of access – Some challenges to sustainable tourism development in Scandinavia. Journal of Sustainable Tourism, 9(5), 417–434. https://doi.org/10.1080/09669580108667412
- Kaltenborn, B. P., Andersen, O., & Gundersen, V. (2014a). The role of wild reindeer as a flagship species in new management models in Norway. Norsk Geografisk Tidsskrift – Norwegian Journal of Geography, 68(3), 168–177. https://doi.org/10.1080/00291951.2014.904400
- Kaltenborn, B. P., Hongslo, E., Gundersen, V., & Andersen, O. (2014b). Public perceptions of planning objectives for regional level management of wild reindeer in Norway. Journal of Environmental Planning and Management, 58(5), 819–836. https://doi.org/10.1080/09640568.2014.898204
- Kjørstad, M., Bøthun, S. W., Gundersen, V., Holand, Ø., Madslien, K., Mysterud, A., Myren, I. N., Punsvik, T., Røed, K. H., Strand, O., Tveraa, T., Tømmervik, H., Ytrehus, B., & Veiberg, V. (2017). Miljøkvalitetsnorm for villrein. Forslag fra ekspertgruppe [Environmental quality standard for wild reindeer – Suggestions from an expert group], Trondheim. NINA Report 1400. Norwegian Institute for Nature Research
- Leblond, M., Dussault, C., & Ouellet, J. P. (2013). Avoidance of roads by large herbivores and its relation to disturbance intensity. Journal of Zoology, 289(1), 32–40. https://doi.org/10.1111/j.1469-7998.2012.00959.x
- Lesmerises, F., Johnson, C. J., & St-Laurent, M.-H. (2017). Refuge or predation risk? Alternate ways to perceive hiker disturbance based on maternal state of female caribou. Ecology and Evolution, 7(3), 845–854. https://doi.org/10.1002/ece3.2672
- Lesmerises, F., Dery, F., Johnson, C. J., & St-Laurent, M. H. (2018). Spatiotemporal response of mountain caribou to the intensity of backcountry skiing. Biological Conservation, 217, 149–156. https://doi.org/10.1016/j.biocon.2017.10.030
- Manning, R. (2010). Studies in outdoor recreation (3rd ed.). Oregon State University Press.
- McFadden, J. E., Hiller, T. L., & Tyre, J. (2011). Evaluating the efficacy of adaptive management approaches: Is there a formula for success? Journal of Environmental Management, 92(5), 1354–1359. https://doi.org/10.1016/j.jenvman.2010.10.038
- Monz, C. A., Cole, D. N., Leung, Y.-F., & Marion, J. L. (2010). Sustaining visitor use in protected areas: Future opportunities in recreation ecology research based on the USA experience. Environmental Management, 45(3), 551–562. https://doi.org/10.1007/s00267-009-9406-5
- Monz, C. A., Pickering, C. M., & Hadwen, W. L. (2013). Recent advances in recreation ecology and the implications of different relationships between recreation use and ecological impacts. Frontiers in Ecology and the Environment, 11(8), 441–446. https://doi.org/10.1890/120358
- Nature Diversity Act (2009). Act of 19 June 2009 No. 100 Relating to the Management of Biological, Geological and Landscape Diversity. http://www.regjeringen.no/en/doc/Laws/Acts/nature-diversity-act.html?id=570549
- Nellemann, C., Vistnes, I., Jordhøy, P., Støen, O. G., Kaltenborn, B. P., Hanssen, F., & Helgesen, R. (2010). Effects of recreational cabins, trails and their removal for restoration of reindeer winter ranges. Restoration Ecology, 18(6), 873–881. https://doi.org/10.1111/j.1526-100X.2009.00517.x
- Outdoor Recreation Act (1957). LOV 1957–06–28 nr 16: Lov om friluftslivet.
- Panzacchi, M., Van Moorter, B., Jordhøy, P., & Strand, O. (2013a). Learning from the past to predict the future: Using archaeological findings and GPS data to quantify reindeer sensitivity to anthropogenic disturbance in Norway. Landscape Ecology, 28(5), 847–859. https://doi.org/10.1007/s10980-012-9793-5
- Panzacchi, M., Van Moorter, B., & Strand, O. (2013b). A road in the middle of one of the last wild reindeer migration routes in Norway: Crossing behaviour and threats to conservation. Rangifer, 33(2), 15–26. https://doi.org/10.7557/2.33.2.2521
- Panzacchi, M., Van Moorter, B., Strand, O., Loe, L. E., & Reimers, E. (2015). Searching for the fundamental niche using individual–based habitat selection modelling across populations. Ecography, 38(7), 659–669. https://doi.org/10.1111/ecog.01075
- Reimers, E., & Colman, J. E. (2009). Reindeer and caribou (Rangifer tarandus) response towards human activities. Rangifer, 26(2), 55–71. https://doi.org/10.7557/2.26.2.188
- Reimers, E., Miller, F. L., Eftestøl, S., Colman, J. E., & Dahle, B. (2006). Flight by feral reindeer Rangifer tarandus tarandus in response to a directly approaching human on foot or on skis. Wildlife Biology, 12(4), 403–413. https://doi.org/10.2981/0909-6396(2006#x00029;12[403:FBFRRT]2.0.CO;2
- Riungu, G. K., Peterson, B. P., Beeco, J. A., & Brown, G. (2018). Understanding visitors' spatial behavior: A review of spatial applications in parks. Tourism Geographies, 20(5), 833–857. https://doi.org/10.1080/14616688.2018.1519720
- Røed, K. H., Bjørnstad, G., Flagstad, Ø., Haanes, H., Hufthammer, A. K., Jordhøy, P., & Rosvold, J. (2014). Ancient DNA reveals prehistoric habitat fragmentation and recent domestic introgression into native wild reindeer. Conservation Genetics, 15(5), 1137–1149. https://doi.org/10.1007/s10592-014-0606-z
- Scolozzi, R., Schirpke, U., Detassis, C., Abdullah, S., & Gretter, A. (2015). Mapping alpine landscape values and related threats as perceived by tourists. Landscape Research, 40(4), 451–465. https://doi.org/10.1080/01426397.2014.902921
- Selvaag, S. K., Gundersen, V., Dokk, J. G., Romtveit, L., Strand, O., Wold, L. C., & Holter, T. (2018). Brukerundersøkelse i Hardangervidda nasjonalpark sommeren 2017. [Visitor survey in Hardangervidda National Park Summer 2017]. NINA Report 1530. Norwegian Institute for Nature Research.
- Skarin, A., & Åhman, B. (2014). Do human activity and infrastructure disturb domesticated reindeer? The need for the reindeer's perspective. Polar Biology, 37(7), 1041–1054. https://doi.org/10.1007/s00300-014-1499-5
- Stankowich, T. (2008). Ungulate flight responses to human disturbance: A review and meta-analysis. Biological Conservation, 141(9), 2159–2173. https://doi.org/10.1016/j.biocon.2008.06.026
- Strand, O., Bevanger, K., & Falldorf, T. (2006). Reinens bruk av Hardangervidda. Sluttrapport fra Rv7-prosjektet [Wild reindeer habitat use at Hardangervidda]. NINA Report 131. Norwegian Institute for Nature Research.
- Strand, O., Nilsen, E. B., Solberg, E. J., & Linnell, J. C. D. (2012). Can management regulate the population size of wild reindeer (Rangifer tarandus) through harvest? Canadian Journal of Zoology, 90(2), 163–171. https://doi.org/10.1139/z11-123
- Strand, O., Jordhøy, P., Panzacchi, M., & Van Moorter, B. (2015). Veger og villrein Oppsummering – Overvåking av Rv7 over Hardangervidda [Roads and wild reindeer: A summary of the monitoring program at Rv7 in Hardangervidda]. NINA Report 1121.Norwegian Institute for Nature Research.
- Tyre, A. J., & Michaels, S. (2011). Confronting socially generated uncertainty in adaptive management. Journal of Environmental Management, 92(5), 1365–1370. https://doi.org/10.1016/j.jenvman.2010.10.014
- Vistad, O. I., & Vorkinn, M. (2012). The wilderness purism construct—Experiences from Norway with a simplified version of the purism scale. Forest Policy and Economics, 19, 39–47. https://doi.org/10.1016/j.forpol.2011.12.009
- Wilberg, K. A. K. (2012). Bortfallsstudie i Dovrefjell–Sunndalsfjella nasjonalpark: En test av selvregistreringskasser som metode for registrering av ferdsel i naturområder [Non-compliance study in Dovrefjell–Sunndalsfjella National Park: A test in self-registration checkpoints to register use of nature areas [Master's thesis]. Norwegian University of Life Sciences, Ås.