

Abstract
An increasing body of literature has highlighted the significant carbon impact of academic conferences. Our paper further adds to this growing body of evidence by introducing a newly assembled dataset from a sample of 263 economics conferences, including 55,006 presentations by 26,312 academics. First, we offer a detailed description of the travelling pattern of academics presenting their work at these conferences, and highlight the main differences between academics and institutions in different geographical regions. Academic conferences are intuitively linked to increased dissemination in the expectation that they boost various impact metrics. For this reason we look at the relative role of the distance travelled and the number of trips made to present each paper in driving the number of citations these papers receive. We present evidence that the number of trips matters for more citations but longer distances are only associated with higher citation numbers for European academics. The potential reasons behind this heterogeneity are discussed in detail. Our results offer support to recent evidence showing that higher carbon impact is not necessarily associated with enhanced academic outcomes.
Disclosure statement
No potential conflict of interest was reported by the authors.
Appendix
Figure A1. Distributions of distance travelled per return trip by frequent and less frequent travellers (kernel density estimates).
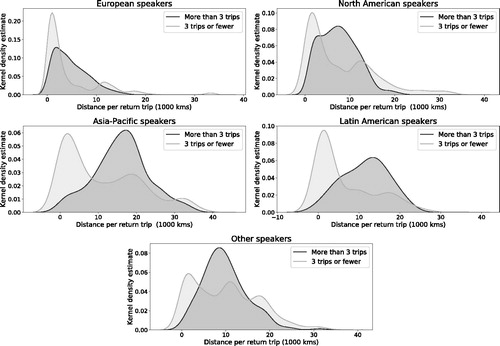
Figure A2. Trips and travel distance by region, by year.
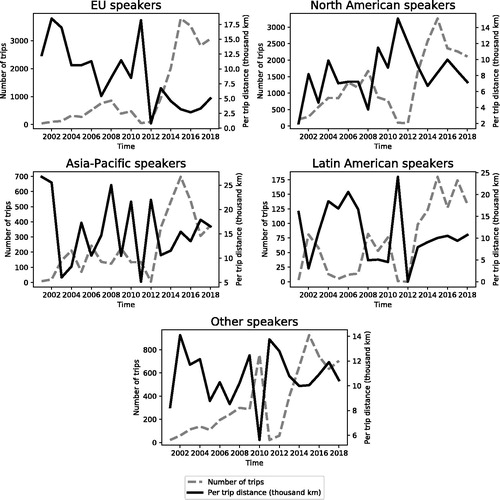
Figure A3. Ridge regressions with different levels and the linear regression coefficients.
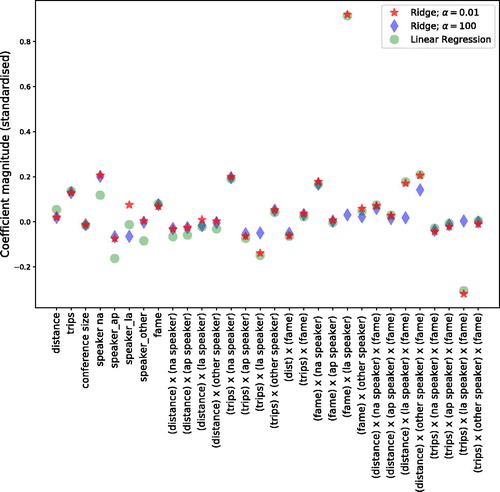
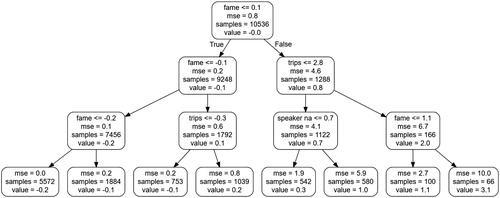
Figure A4. Regression tree.
The figure shows the estimated coefficients for the OLS and two ridge regressions using two different levels of regularisation (α ≈ 0 and α = 100) on Model 1, where we regress citation count on all available variables.
A tree consists of a root node (node 1), containing all observations. This node is split into branches and leaves (end nodes) based on the value of predictors. The regression tree algorithm does segment the predictor space into a number of regions and within each leaf it calculates the average predicted value and percentage of the training observations within that region. The variable that determines node 1 is the most important variable for the classification.
Notes
1 Although some universities started flagship initiatives, such as ’Flying Less Policy’ at the Concordia University in Montreal, https://www.concordia.ca/content/dam/artsci/geography-planning-environment/docs/Flying_Less_Policy_GPE_June1_2019.pdf
2 Here we refer to social cost in a Coasian sense, which includes the direct private costs of attending these conferences, and the externalities they impose through increased carbon emission.
3 As de Leon and McQuillin (Citation2020) explain, maturation and advertisement can be thought of as the formation and diffusion of scientific knowledge, which has a rich literature but is tangential to the purposes of this paper.
4 The choice of economics came from the affiliation of one of the authors, which meant that we were qualitatively familiar with the conferences in our sample.
5 To see how this compares to the population of economics conferences, we looked at econbiz.de, which lists 1888 general economics conferences, of which 547 (29%) were in the US + Canada, 880 (47%) in the Europe, and 461 (24%) in other countries. Although this implies somewhat more European and fewer North American conferences, the distribution does not look strikingly different from our sample.
6 Kernel density estimates are an alternative to histograms to visualise the empirical distribution of the data. It is an estimate of the underlying distribution (which is why there are sub-zero distances), and is calculated by weighting the distances between the data points: with more observations close to each other, the estimate will be higher, indicating a higher probability of observing that value.
7 The difference can be four-fold, see for example here: https://www.clevel.co.uk/flight-carbon-calculator/.
8 Although we focus on carbon dioxide (CO2) emission, we acknowledge that flying has other harmful effects (for example nitrogen oxide and nitrogen dioxide emission). As such we only provide conservative estimates of the true scale of harmful effects.
10 Tables A17 and A18 in the Appendix provide more details, and offer calibrations under more extreme assumptions.
11 We opted against using Google Scholar as they do not provide a data API.
12 When randomly comparing with citation numbers on Google Scholar, we found that there was sometimes a discrepancy, probably due to the difference in their search algorigthms, but the difference between the Google and Microsoft figures tended to be small.
13 As speaker names often appear in different forms (e.g. with or without middle names), we used approximate string matching to find the same names. Approximate (or fuzzy) string matching refers to the technique of finding strings that match a pattern approximately - but not perfectly. For example the entries Peter Ormosi, Peter L Ormosi, and Peter Laszlo Ormosi do not perfectly match, although they refer to the same author. With various approximate matching algorithms, one can adjust how much distance between two strings should be tolerated for a match in order to include all permutations of the same name or title.
14 In economics conference papers are not typically cited separately, the citation relates to the working paper and the final published versions of the paper.
15 Wynes et al. (Citation2019) for example finds strong correlation between age and academic standing and the number of trips and mileage.
16 Full regression results are given in in the Appendix.
17 The paper puts less emphasis on interpreting the exact magnitude of the coefficients. The low RFootnote2 figures imply that the estimated model is not a very good one for prediction, but our interest is not in prediction, rather in the relationship between 3 variables to test Hypothesis 1.
18 Ridge regressions assume that the predictors in the estimated model are standardised.
19 CART analysis is a tree-building technique, which is suitable when the outcome (dependent) variable is continuous.
21 The lognormal distribution - whereby the log of a random variable is normally distributed - is frequently used to fit to size data.
22 For these back of the envelop figures we first calibrated the parameters of the distribution of conference size in the sample (assuming lognormal distribution), then using these parameters, we generated a random sample of 25,247 lognormally distributed conferences sizes, which gave us the total number of trips. Multiplying this by the average distance in our sample we got the total distance travelled.
23 For papers that use citation numbers or related bibliometric data in evaluating academic conference-going and mobility see for example: de Leon and McQuillin (Citation2020), Sugimoto et al. (Citation2017), Adams (Citation2013), Wynes et al. (Citation2019), or Derudder and Liu (Citation2016).
Additional information
Notes on contributors
Konstantinos Chalvatzis
Konstantinos Chalvatzis is Professor of Sustainable Energy Business and Academic Chair for ClimateUEA at the University of East Anglia. His consortium research has received academic, industrial and investment co-funding of over 23m euros and has been published in the highest impact factor journals of his field. He has been visiting scholar at the Department of Geographical Sciences, University of Maryland, College Park and he is visiting Professor at the Department of Economics, University of Bologna.
Peter L. Ormosi
Peter Ormosi is an associate professor of Competition Economics, and a member of the Centre for Competition Policy at the University of East Anglia. Before joining academia he worked for the Hungarian Competition Authority and the OECD. He has published in both economics and law journals of international excellence. He has provided advice and delivered various reports for the Competition and Markets Authority, the European Commission, the OECD, UNCTAD, and the World Bank on issues related to impact evaluation and the estimation of the consumer benefits of competition policy.