
Abstract
Emissions of greenhouse gases from tourism transport are rising globally, with air transport accounting for the largest share. Although travel is not likely to decrease drastically, people could travel differently, and still have similar experiences. This study aims to map the emissions from air travel and analyse the theoretical potential for emissions reduction by changing transport mode and destinations, and the readiness potential for emissions reduction based on tourists’ stated readiness to change their travel behaviour. The theoretical potential was assessed by analysing alternative trips to closer destinations and using transport modes with lower emissions or through virtual meetings. The readiness potential was assessed by a survey designed to capture people’s stated readiness to change their behaviour. The results show a theoretical potential for an emissions reduction of 67%, while the readiness potential is 26%. About half of the readiness potential for reductions is from changing destination, while only a small share is from changing transport mode. This shows that, when accounting for people’s readiness to change behaviour, destination choice has a greater potential to reduce emissions compared to transport mode choice. This finding has implications for policy makers in designing policy measures to reduce emissions.
Introduction
The largest share of tourism’s emissions of greenhouse gases (GHG) comes from tourism-related transport and from air travel in particular (Gössling & Peeters, Citation2015; Lenzen et al., Citation2018). The climate impact, i.e. GHG emissions measured in CO2-equivalents (CO2-eq), from tourism transport depends mainly on two factors: how far we travel (i.e. destination choice) and how we travel (i.e. transport mode choice) (Gössling et al., Citation2005; Peeters et al., Citation2006).
People will keep travelling. However, changing destination or transport mode could reduce the climate impacts from tourism transport significantly without compromising the activities or experiences that people seek. Trip types (see e.g. Oh et al., Citation2004) such as travelling for Urban entertainment which involves cultural events and food experiences in an urban area, can be taken using different transport modes and destination choices while still offering similar activities and experiences. This could mean shortening the distance by travelling from London to Paris instead of London to New York, which both offer Urban entertainment, or choosing train over air travel. For business travellers, a change could mean staying at their home office and holding a virtual meeting (cf. Julsrud & Gjerdåker, Citation2013; Roby, Citation2014).
The role of the consumer in choosing transport modes with lower emissions has previously been highlighted as a crucial research area (Hergesell & Dickinger, Citation2013; Scott & Becken, Citation2010), in particular in association with the increasing GHG emissions from air travel (Gössling & Peeters, Citation2015; Larsson & Kamb, Citation2018). Air travel has several times higher emissions per passenger-km compared to travel by train or shared car (Larsson & Kamb, Citation2019). Given that people also, on average, travel longer distances by air compared to other modes of transport (Reichert & Holz-Rau, Citation2015), the emissions per trip are high.
Consumers are starting to become more aware of the climate impacts of air travel. In a 2019 survey, when asked about their commitment to reducing climate impact, 75% of the respondents in Europe and 69% in the US claimed that they intended to fly less for holidays (European Investment Bank, Citation2019). There has also been intense public debate in some countries (e.g. Germany, the Netherlands, and Sweden) about the climate impact of flying (e.g. Buijtendijk & Eijgelaar, Citation2020; Liljestrand, Citation2018; Sullivan, Citation2020; Vidal, Citation2019). In Sweden, for example, the term flygskam (“flight shame”), describing the negative feelings associated with the climate impact from flying, was coined and then spread around the world (Jacobson et al., Citation2020; Wolrath Söderberg & Wormbs, Citation2019). This indicates that there may be a potential for shifting from predominant travel practices with high emissions towards alternatives with lower emissions.
This paper has two objectives. The first is to map GHG emissions from air travel (leisure and business) and analyse the theoretical potential for reductions of GHG emissions, while still allowing people to experience the same type of trip. Secondly, it aims to analyse a more realistic potential for reductions of GHG emissions based on tourists’ stated readiness to change their behaviour, i.e. being able and willing to change transport mode and destination (cf. Stradling, Citation2004). This is referred to as the readiness potential. In addition, possible factors that explain tourists’ readiness to change are analysed. To meet the objectives this study analysed data from Sweden.
Greenhouse gas emissions from tourism transport
Aviation accounts for a relatively small share of all tourist trips but the distances travelled are long for air travel, resulting in high emissions (Aamaas & Peters, Citation2017; Åkerman, Citation2012; Christensen, Citation2016). Global aviation accounted for approximately 3.5% of total anthropogenic effective radiative forcing in 2018, where about half stems from CO2 emissions and the rest from non-CO2-emissions, such as water vapour emitted at high altitudes (Lee et al., Citation2020). Scientific uncertainty about the impact from these non-CO2-emissions is however still large, albeit reduced in recent calculations (Lee et al., Citation2020), and which metric to use is debated (for a discussion on metrics see e.g. Fuglestvedt et al., Citation2010). One particular challenge is related to comparing short- and long-lived gases. Depending on the chosen metric and time horizon (e.g. 20 or 100 years), CO2 multipliers range severalfold (Lee et al., Citation2020). The best available approximation is that the total global warming potential is 1.7 times greater than for CO2 alone with a 100-year perspective (Azar & Johansson, Citation2012; Lee et al., Citation2020). Furthermore, if emissions from the production and distribution of jet fuel are included, some 20% would need to be added on top of the CO2 emissions from the combustion of the jet fuel alone (e.g. Moretti et al., Citation2017)
At the same time, the distribution between countries and individuals is far from equal, with estimates that only a few percent of the global population take an international flight in a given year (Gössling et al., Citation2019; Peeters et al., Citation2006). A hypermobile elite account for a large share of the emissions (Gössling et al., Citation2009; Reichert & Holz-Rau, Citation2015).
There is potential to reduce emissions for all transport modes. Electrification of cars and the reduction of GHG emissions due to increasing share of renewable energy in electricity production in Europe (European Environment Agency, Citation2018; Moro & Lonza, Citation2018) will reduce the GHG emissions from cars, as well as from trains. For aviation, biofuels may reduce GHG emissions and there are ambitious targets for biofuel use in e.g. Sweden (SOU, Citation2019:11). The estimates of emissions reductions achieved from biofuel use do however vary substantially, with estimates ranging from almost no net emissions to even increased emissions, depending on differences in e.g. crops used and estimates of land use changes (Ahlgren & DI Lucia, Citation2014; Souza et al., Citation2015). Hence, the climate benefits of large-scale global biofuel use are not given. There is also much debate about all-electric aircraft, but in the coming decades all-electric aircraft can only be expected to replace shorter flights, which only make up a small share of the total aviation volumes, and hence have limited potential to reduce global aviation emissions (Epstein & O’Flarity, Citation2019; Schäfer et al., Citation2019). Furthermore, aviation features substantial inertia and in the past it has taken around 50 years from the development of new aircraft until the entire fleet has been replaced (IPCC, Citation1999).
In order to reach the Paris agreement target and limit global warming to 1.5–2 deg, emissions need to be reduced in all sectors, including tourism transport. Given that technological development in aviation is not likely to deliver the emissions reductions needed in the coming decades, constraining demand may become necessary (Peeters, Citation2017). Since this could be achieved by shifting to other modes of transport or shortening distances, destination and transport mode choice are important aspects of achieving emissions reductions.
Possibilities for reducing emissions but still travelling
Given that people still want to travel and have similar experiences as today there are two main strategies for reducing emissions: changing transport mode or choosing closer destinations (which for business travel includes staying in one’s own office for virtual meetings).
Reduction of emissions through transport mode choice
When studying transport mode choice, it is important to note that this choice is not made in a vacuum. It is interlinked with, and indirectly influenced by, several other decisions concerning the choice of destination, trip type, accommodation, travel company, duration, departure date, etc. (Dellaert et al., Citation1998; Oh et al., Citation2004). These decisions are, in turn, linked to travel motives, i.e. the trip’s fulfilment of the individual’s basic needs and wants such as self-development, safety, and relationship needs (Nicolau & Más, Citation2006; Pearce & Lee, Citation2005).
Focusing on factors explicitly linked to transport mode choice, Hergesell and Dickinger (Citation2013) point out price, time and convenience as crucial factors, and that time had a particularly large effect on train trips longer than five hours. Other important factors are social norms as well as individual factors such as environmental concern, car ownership, age, education, occupation, income, and life stage. Rating different factors, environmental concern was rated as the least important factor. Even if this might have changed with the recent public debates in some countries, as discussed in the introduction, it is likely that price and travel time will remain more important than environmental concerns when choosing transport mode (Grigolon et al., Citation2012; Hares et al., Citation2010; Hergesell & Dickinger, Citation2013).
Although these results may be disheartening, and transport mode choices with lower emissions difficult to achieve, recent studies show that the existence of good alternatives (e.g. high-speed trains or night trains) is important when changing tourism transport behaviour and to limit flying. With alternative modes of travel, people are not deprived of travel altogether but instead offered a slightly different experience (Wolrath Söderberg & Wormbs, Citation2019). Furthermore, Jacobson et al. (Citation2020) point out the importance of both changed societal norms and implementation of effective policy instruments as pivotal to achieving large-scale reductions in air travel.
Reductions of emissions through destination choice
If the sacrifice of giving up flying is too great, another way to decrease climate impacts is to choose a destination closer to home that still offers the same type of trip. An example, from a European perspective, is to choose the Canary Islands instead of Thailand for a holiday. This change of destination could halve GHG emissions, but possibly offer a similar trip type (e.g. experiencing sun, nature, and food).
As discussed regarding transport mode choice, the destination choice is interlinked with other choices, needs and wants (cf. Goffi & Cucculelli, Citation2014; Wall & Mathieson, Citation2006). Many additional factors that influence destination choice have also been listed. Wall and Mathieson (Citation2006, p. 48; see also Nicolau & Más, Citation2006) list, for example, attractions at the destination, expected availability and quality of services, price level at the destination, attributes of the host population, visa restrictions and distance to the destination. Previous experiences at destinations are also part of the process. This could be positive experiences creating loyalty or negative experiences, such as travel hassles (Schuster et al., Citation2006), affecting the destination choice.
Regarding the distance to the destination, Nicolau and Más (Citation2006) find in their review that there is no consensus in previous research on whether a long distance has a deterrent or attraction effect on the chance that tourists will choose a specific destination. This might be linked to the fact that tourists have poor knowledge about the physical distance, partly since you can travel long distances in a short amount of time when travelling by air (Larsen & Guiver, Citation2013). Nicolau and Más (Citation2006) propose that the trip type and travel motivation are important in this context. Their results show that “search for climate” (i.e. a warm, sunny climate), “novelty” (i.e. experiencing new places), and “visiting family and friends” make tourists travel further, but that the “search for tranquillity” and “broadening cultural knowledge” make tourists choose destinations closer to home (Nicolau & Más, Citation2006).
While leisure travel in many cases is flexible in terms of destination, with many destinations offering similar experiences and activities, business travel is less so, since e.g. customers are located at specific destinations. On the other hand, business travel could partly be replaced by virtual meetings. Face-to-face meetings are sometimes hard to avoid, but the share of virtual meetings can be increased by e.g. encouraging virtual meetings when relationships have already been established, by providing employees with the know-how as well as incentives (Arnfalk et al., Citation2016; Julsrud & Gjerdåker, Citation2013), and by employing activities for increasing trust between members of virtual teams (Liao, Citation2017).
Method
In order to meet the objectives of the study, to map and analyse both the theoretical potential and the readiness potential for reductions in GHG emissions while still allowing tourists to take the same types of trips, we performed a study of Swedish residents’ air travel (leisure and business). Emissions from Swedish residents’ air travel have been estimated at 10 million tonnes CO2-eq, which is the same order of magnitude as Swedish residents’ car travel (Larsson et al., Citation2018). Sweden is an interesting case for several reasons, partly because of the good availability of data, but also because there have been intense political debates on different policy measures related to climate impacts of air travel (Larsson et al., Citation2020) and decreases in air passenger numbers even before COVID-19 (down 4% in 2019 compared to 2018 Swedavia Airports [Citation2020]). Thus, changing travel behaviour is part of the public discourse in Sweden. This means that readiness to change travel behaviour can be expected to be higher in this context, but also that respondents’ replies might be more reliable due to awareness of the connection between air travel and climate impacts being high among Swedes (Jacobson et al., Citation2020).
The study was carried out in three steps. Firstly, trip types were created based on the national Swedish travel survey and emissions for each trip type were calculated. Secondly, the theoretical potential for emissions reductions was calculated for the trip types that contribute the largest shares of GHG emissions. This was done through the development of alternative trips to other destinations or different transport modes with lower emissions. Finally, a survey was sent out to a sample of Swedish residents to assess their readiness to change their travel behaviour to the alternative trips in order to calculate the readiness potential for emissions reductions. This survey also included several possible explanatory variables (e.g. norms), which were analysed in relation to tourists’ readiness. The three steps are described in detail below.
Developing trip types
The basis for this analysis was the data set “Swedes’ travel 2017,” which is a national travel survey covering travel “outside of your home environment” (Statistics Sweden, Citation2018). Both business travel and private travel are included in the survey. For this study, we used the survey questions concerning activities and experiences that tourists participated in during their trip (i.e. defining the trip type), their transport mode and their destination. The annual survey collects data from 5000 randomly selected individuals per month in Sweden, in total 60,000 individuals per year. The response rate in 2017 was 30%. The survey covered trips made in the past month and data are weighted by Statistics Sweden to represent the Swedish population. In 2017, 14,000 trips were recorded, of which 54% were by car, 21% by air, 12% by train and 13% by other modes of transport. As this study focuses on emissions from air travel, only trips involving air travel were analysed (2967 trips).
The concept of trip type was applied in order to analyse the emissions from current air travel. Trip type (also referred to as trip typology, tourism styles or trip purpose) is based on which activities (also referred to as experiences sought) tourists participate in during their trip (Oh et al., Citation2004). Previous research shows that trip type influences tourist behaviour, e.g. what tourists consume at the destination, and in our case how tourists travel, the choice of destination and ultimately the level of emissions. Examples of trip types found in previous studies are Active outdoor, Urban entertainment, Relax with families, and Social with friends (Littrell et al., Citation1994; Oh et al., Citation2004). It is vital to emphasise that changing destination or transport mode changes the trip characteristics even if it is still the same trip type (e.g., trips for Urban entertainment to Sydney and Copenhagen have quite different characteristics). This is one reason for why it is important to understand travellers’ readiness to change through the follow-up survey (see further down).
In the survey Swedes’ travel 2017, respondents could choose between 20 leisure activities and 7 business activities (see Supplemental material). They could report multiple activities for each trip. Trips including “visit family and friends” and business activities were identified a priori as separate trip types, as these trips are fixed in terms of destination, and thus leave less room for emissions reductions. The remaining cases were analysed in a binary cluster analysis (average linkage) to identify distinctive trip types. In order to identify clusters where respondents have activities in common (not an absence of activities in common) the Dice similarity coefficient was used to perform the cluster analysis. It ignores the co-absences of activities, i.e. co-absences are excluded from the calculation of the similarity measure, and matches are weighted double (Everitt et al., Citation2011). Oh et al. (Citation2004) used a similar approach to identify trip types in their study of tourists’ shopping behaviour. lists the twelve trip types found in the cluster analysis.
Table 1. Trip types listed in descending order based on the number of trips.
The five trip types with the largest shares of total emissions were analysed further for their theoretical and readiness potentials. To do so, each trip type was divided into subtypes based on destination and season (see for examples). The destination directly affects the potential for changing transport mode, as travellers are not likely to use ground transport for intercontinental trips under the current availability of cheap air travel. Therefore, destinations were divided into Europe, Intercontinental, or the Canary Islands (the Canary Islands is (1) one of the most common destinations for Swedish tourists, and (2) the distance to the Canary Islands is in between the distance to European and intercontinental destinations). For the trip type Warm climate, the trips were divided into summer and winter, since northern Europe is not a possible alternative for those seeking warm climate during the winter season.
Table 2. Examples of trip type, subtypes, and alternative trips.
Emissions calculations
For each trip, the emissions were calculated. For air travel, the shortest distance to the destination was calculated (as detours are taken into account in the emissions factor, see Larsson et al., Citation2018) and multiplied by emissions of 170 g CO2-eq per passenger-km. While CO2 emissions are typically higher per passenger-km for shorter trips, non-CO2 emissions are typically higher for longer, and thus using an average emissions factor for all distances is more justified when including non-CO2 emissions. This figure is based on direct emissions of 90 g CO2 per passenger-km (Larsson et al., Citation2018), non-CO2 effects adding 70% (Lee et al., Citation2020), and emissions from the production and distribution of fuel amounting to 20% on top of the CO2 emissions (average of Edwards et al., Citation2014; Moretti et al., Citation2017; Unnasch & Riffel, Citation2015; Knörr & Hüttermann, Citation2016; SOU, Citation2019:11).
For ground transport, 25% was added to the shortest distance to the destination to take into account the longer distances when travelling on the ground, based on the average extra distance to eight common destinations in Europe. Extra distances due to stopovers are however not taken into account for any transport mode due to lack of data. Train trips were assumed to be by electric trains with emissions of 34 g CO2-eq per passenger-km. This was used for trips to continental Europe and 10 g CO2-eq per passenger-km within the Nordic countries. For car travel an emissions factor of 54 g CO2 per passenger-km was applied for leisure trips (assuming occupancy of 2.9 persons in the car) and 100 g CO2-eq per passenger-km was applied for business travel (assuming 1.5 persons) (Larsson & Kamb, Citation2019). For virtual meetings the emissions from additional equipment and internet usage are small in comparison to physical meetings (Borggren et al., Citation2013). In this paper, we assume zero emissions from virtual meetings.
Theoretical potential for emissions reduction
In order to assess the theoretical potential for emissions reduction, alternative trips with lower emissions were developed for each subtype (see ). For transport modes, the following alternatives to aircraft were analysed:
car (the most common transport mode),
train (the transport mode with the lowest emissions).
For destinations the following alternatives were analysed:
Nordic countries, as the alternative to intercontinental and European destinations,
continental Europe, as the alternative to intercontinental destinations,
the Canary Islands, as the alternative to intercontinental destinations.
shows examples of trip types, subtypes, and alternative trips. Trip type and subtypes are listed to the left and alternative trips are divided into columns based on transport mode (aircraft, car, and train) and destination. For the trip type Business, the alternative virtual meeting was also included. As all trips were originally made by aircraft, the alternatives under aircraft represent changing only the destination, while alternatives under car and train represent changing only the transport mode or combinations of both factors. For instance, the first subtype, Warm climate – intercontinental in summer, has six alternative trips: aircraft to the Canary Islands or Europe (changing destination) and car or train to continental Europe or Nordic countries (changing both destination and transport mode). The theoretical potential (pt) for emissions reduction (i.e. “−X%” in ) was calculated as the difference between the emissions of the alternative trip, and the original trip type and subtype: pt = (ealt−eair)/Eair,tot, where ealt denotes the emissions of the alternative trip or subtype, eair the emissions of the original trip or subtype by air, and Eair,tot the total emissions of the original trips by air.
Readiness potential for emissions reduction
A separate survey was designed to analyse tourists’ readiness to make alternative transport and destination choices. The data were collected in November 2019 through an online survey conducted by a professional market research provider. The panel consists of 70,000 members in Sweden and the participants for the survey were randomly sampled from this panel based on gender, age, and geographical area. Moreover, they had to fulfil certain criteria connected to the study design. The respondents had to have made at least one flight in the past two years, which matched the subtypes (see ). The aim of the sampling procedure was to fill quotas for each subtype. This quota sampling procedure was necessary so that all subtypes would be covered in the analysis (cf Hair et al., Citation2017). The survey was, in total, sent to 1500 panel members whereof 1066 answered the survey (71% response rate). The non-response cohort included those that did not meet the initial criteria (of having made at least one flight in the past 2 years) or the age criteria (15–74 years old). Out of the 1066 respondents, 961 had made at least one of the 12 trip subtypes (see ). The remaining 105 respondents had made trips by air, but they had not made any of the trip subtypes that were included or they failed to complete the whole survey.
Table 3. Theoretical potential for emissions reduction per trip type.
If the respondents had made one or several subtype trips, they were asked about their readiness to make alternative destination and transport mode choices for one of the (randomly assigned) subtypes. The respondents were presented with the alternative trips and asked: “How likely is it that you would make any of the following trips instead?,” on a scale from 1 (not likely at all) to 5 (very likely). Those who answered 4 or 5 were assumed to be ready to make the alternative trip instead of the original trip.
Finally, the survey included items linked to key explanatory variables that have previously been shown to be relevant to explaining sustainable consumer and travel behaviour. Both personal and social norms have been connected to sustainable behaviour (e.g. Jansson et al., Citation2010; Stern, Citation2000; White et al., Citation2019). In the survey, personal norms were measured by three items (e.g. I feel a moral obligation to reduce the negative climate effects of my vacations, Cronbach alpha = .90) and social norms with two items (e.g. I think that my friends expect that I consider the climate when I make decisions about vacations; Cronbach alpha = .78). General concern about climate was also measured (I feel worried about the changes to the earth’s climate). On top of these variables, three variables measuring travel experience were included in the survey (number of leisure flights during the last two years, number of business flights during the last two years, number of continents visited) (cf. Pearce & Lee, Citation2005), as well as age and gender.
Results
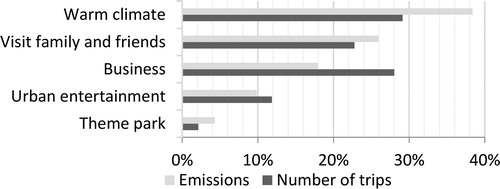
shows the emissions and number of trips for the five trip types with the largest shares of emissions. Trips for Warm climate on average result in longer distances, causing a notably larger share of the emissions in comparison to the number of trips. The situation is the opposite for business trips since distances are shorter on average. These five trip types account for 96% of the aviation emissions and are further analysed below in term of their theoretical and readiness potential for emissions reduction.
Figure 1. Emissions and number of flights for the five trip types with the largest shares of emissions.
Theoretical potential for emissions reduction
The results of the analysis of the theoretical potential for emissions reduction can be seen in , which shows the share of the total aviation emissions that each subtype causes and the emissions reduction each alternative trip would result in. As is seen in the bottom of the second column, all the subtypes listed in account for 72% of emissions from the Swedish population’s air travel. This is less than the 96% the five trip types account for in total, as the analysis only includes subtypes with considerable potential for emissions reduction and where alternative trips could offer similar activities and experiences. This primarily excludes the subtypes Business trips with purposes other than meetings (about 6% of emissions) and Visit family and friends – intercontinental (17%).
Changing destination, but still using air travel, have considerable potential for emissions reduction. For instance, if everyone who seeks Warm climate – intercontinental chose to fly to the Canary Islands instead, as much as 7% of air travel emissions could be abated. If all trips to both the Canary Islands and intercontinental destinations were replaced by flights to destinations in continental Europe, the reductions in air travel emissions is 21%. This does however include changing to alternative trips for warm climate in Europe during winter (add up to 9%). European destinations could offer similar experiences during winter if travellers are seeking a warm climate for e.g. sports activities, but less so for a beach holiday. Nevertheless, this shows that emissions can be significantly reduced by shortening the distance, even when people keep flying.
Likewise, changing the mode of transport has considerable potential for emissions reduction. For instance, if all travellers seeking Warm climate – Europe took the train instead, emissions reductions add up to 11% (the net of reduced air emissions and increased train emissions). If all subtypes of trips within Europe were made by train to the same destinations, emissions could be reduced by a total of 26%. Similar potential can also be achieved if car transport is used instead. Finally, there is also great theoretical potential to replace business trips with virtual meetings, i.e. 12% of air emissions. In total, if the alternative trips with the greatest emissions reductions for each subtype are added together, then emissions could be reduced by 67%.
Readiness potential for emissions reduction
In the preceding analysis, we showed that there is a large theoretical potential for GHG emissions reduction if alternative trips that offer similar experiences and activities were conducted instead. The basis for the readiness potential for emissions reduction is the degree of readiness to change transport modes and/or destinations (please see Supplemental information for the readiness for each subtype and alternative trip).
The readiness potential for emissions reduction, given that all who stated they would be ready to choose the alternative trip actually did make this change, can be seen in . Compared to the theoretical potential for emissions reduction (67%, ), the readiness potential for emissions reduction based on travellers’ readiness to change their travel behaviour is smaller (26%, ). What becomes evident in is that it is not always the transport mode with the lowest emissions or the destination closest to Sweden that has the largest readiness potential for emissions reduction (e.g. replacing aircraft with trains). The largest readiness potential emissions reduction (9.8%) comes instead from replacing Warm climate trips to intercontinental destinations and the Canary Islands with flights to destinations in Continental Europe. This means that just changing the destination has greater potential for emissions reduction than changing to train or car, even though the reduction per trip is less. In total, about half of the readiness potential comes from just changing to closer destinations.
Table 4. Readiness potential for emissions reduction.
Combining both factors, i.e. changing both destination and transport mode, also has a large readiness potential for emissions reduction. By replacing flights to Europe for Warm climate in summer with car trips to a Nordic destination for example, emissions could be reduced by 4.9%.
Changing just the mode of transport has a lower readiness potential for emissions reduction, as the readiness is lower for these alternatives. The largest potential emissions reduction is through replacing trips to Visit family and friends – Europe with train trips (2.1%). Looking at Business, the readiness for replacing trips for meetings with virtual meetings is much lower, resulting in a lower readiness potential for emissions reduction (2.2%, compared to the 12% theoretical potential).
Finally, an analysis was performed to identify the characteristics of people ready to change their behaviour. This analysis, as displayed in the correlation table in , showed that both social and personal norms are related to readiness to change behaviour overall, and for all individual trip types except when travelling to visit family and friends. Climate concern was also positively related to a readiness to change for all trip types except business travel. Finally, both travel experience and age were negatively related to readiness to change for several trip types, indicating that younger people and people with less travel experience are more ready to change travel behaviour. In all, the explanatory variables had a stronger effect on travelling for a warm climate than on the other trip types, while they had less effect on travelling to visit friends and family.
Table 5. Bivariate correlations between explanatory variables and readiness to change transport behaviour.
Discussion and conclusions
The objectives of this paper were to analyse the theoretical potential reductions in GHG emissions while still allowing people to experience the same type of trip, and to analyse the readiness potential reductions based on tourists’ stated readiness to change their behaviour. The results emphasise the pivotal importance of distance to the destinations for reductions, alongside mode of transport which is a more established factor.
The impact of destination choice
The theoretical potential for emissions reduction by changing destinations and transport mode is very large. The trip types and subtypes we have studied cover 72% of the emissions from Swedish residents’ air travel and if all these trips were replaced with the alternative trips with lowest emissions, the emissions from air travel could be reduced by 67% (net of reduced aviation emissions and increased train and car emissions). The fact that changing the mode of transport can result in lower emissions is hardly a surprise, but the potential inherent in choosing other destinations is not as well established (Larsen & Guiver, Citation2013; Peeters et al., Citation2006).
The result shows that there is a readiness potential, based on peoples’ stated readiness to change their behaviour, to reduce emissions from tourism transport by 26%. About half of this potential comes from changes to closer destinations, a little less than half from combined changes of transport mode and destination, while only a small share comes from transport mode changes alone. The media often portrays this as an either/or issue, a dichotomy, where you either stop flying all together or continue with business as usual. In reality, the options are far more nuanced and the difference in emissions between flying to countries close by or intercontinentally are substantial. Thus, to keep travelling, but minding the distance when making destination choices, is a significant first step towards reducing the climate impact from tourism travel.
It should be stressed that this study does not address the concept of a sustainable trip and the alternative trips in the analyses should not be interpreted as such, even when the emissions reduction is significant. To reach the two-degree target, emissions need to be reduced drastically in all sectors in the near future (IPCC., Citation2014) and there is a need to move “away from long and medium-haul air travel” (Peeters, Citation2017, p.183) as yet, zero emissions flights such as all-electric aircraft are not available (Schäfer et al., Citation2019).
On tourism transport habits
The analysis of the explanatory variables shows that younger tourists, with less travel experience, higher climate concern, perceiving stronger social and personal norms (for reducing the climate impacts from tourism), are more ready to change their travel behaviour. The role of norms is well-established in the contexts of sustainable consumption behaviours (Jansson et al., Citation2010; White et al., Citation2019) and tourism behaviour, even if there is a gap between the establishment of strong personal norms for example, and actual behavioural change (cf. Gössling & Buckley, Citation2016). Moreover, flying is strongly linked to the social practice of tourism (Jacobson et al., Citation2020) and transport choices are, in general, strongly habitual (Verplanken & Roy, Citation2016). Thus, the higher levels of readiness among younger and less experienced tourists may be due to these groups having not yet formed strong transport and tourism habits. However, other factors such as climate awareness or travel budget restraints could also affect the levels of readiness (cf. Grigolon et al., Citation2012; Hergesell & Dickinger, Citation2013).
Policy interventions or disruptive events could help break habitual consumer behaviour (White et al., Citation2019). Previous disruptive events such as terrorist attacks, financial crises or pandemics have only temporarily affected the growth of aviation emissions (Lee et al., Citation2009). However, at this moment in time, there are several coinciding disruptive events and policy interventions, such as the new climate discourses fuelled by youth climate movements, passenger taxes, and the novel respiratory disease COVID-19. If good alternatives with lower emissions are developed and marketed that make it easy to form new, more sustainable tourism habits, we might see changes that are more permanent in travel behaviour (Jacobson et al., Citation2020; White et al., Citation2019; Wolrath Söderberg & Wormbs, Citation2019).
Trip types with limited potentials
For two of the trip types, Visit family and friends and Business, the potentials are far more limited than for the other trip types. Alternative modes of transport can be an option within Europe but for intercontinental trips there are no good alternatives today. Having family and friends in other countries is also one of the most common concerns mentioned in a study looking at people who have stopped flying (Wolrath Söderberg & Wormbs, Citation2019). In our study, we find that trips for visiting family and friends account for 26% of all air travel emissions and that personal and social norms do not have an impact on the readiness to alter these trips (in contrast to all other trip types). In a globalised world, where social connectedness is becoming increasingly important, it is likely that flying to visit family and friends will increase as a trip type (Gössling et al., Citation2018).
Business travel, on the other hand, has a large theoretical potential but low readiness potential for emissions reduction. If implemented in the right way, and used for the right type of meetings, virtual meetings can however achieve considerable emissions reductions. To change the level of readiness, effective actions from both the private and public sectors are needed, such as passenger taxes and changes in frequent flyer programs. Additionally, norms connected to business travel need to change, in particular since norms affect readiness to change behaviour for business trips (see ) and alternatives such as virtual meetings are available. The COVID-19 crises might be the helping hand that businesses need in this regard, since many employees have been working from home using virtual meetings instead of travelling. New business travel habits might be formed based on these experiences.
Realizing the readiness potential
Our study highlights a substantial stated readiness to make other choices which would result in much lower emissions. It is important to underscore that the step from a stated readiness to actual behavioural change is substantial. Numerous studies in different fields, in particular connected to sustainable behavioural change, have identified this attitude/behaviour gap as challenging, something which is also highly relevant in the tourism context (Juvan & Dolnicar, Citation2014). Identifying exactly what would be needed to realise this potential is however outside the scope of this study. It would likely involve a range of changes including higher individual dedication to lower one’s own climate impact, changes in price relations between low and high emissions travel alternatives, improved availability and convenience of low emissions alternatives and perhaps even an altered discourse about what constitutes a ‘good’ vacation. There is a range of policy options (e.g. labelling, distance-based passenger taxes or personal carbon allowances) that can stimulate this change (Kantenbacher et al., Citation2018; Larsson et al., Citation2020). One interesting option, which aims to facilitate change based on the widespread readiness to take alternative trips, is information policies. In Sweden, compulsory climate labelling for all types of travel is being investigated (Transport Analysis, Citation2020). This policy instrument has a relatively high acceptance among consumers in general (Larsson et al., Citation2020; Li et al., Citation2017). A policy implication of this study is that it is crucial that carbon labelling of trips (long-distance in particular) conveys the importance of the distance to destinations, and not just the emissions per passenger-km. It should also include comparisons between transport modes (e.g. flying vs. car or bus) in order to avoid only “within-mode” comparisons. Wolrath Söderberg and Wormbs (Citation2019) highlights this by showing that the knowledge of the order of magnitude of emissions from flying compared to other sources, in their case food or electricity consumption, has been an important factor for people who have stopped flying. Ideally, the label should also capture travel frequency, e.g. by including emissions per day of stay as shorter trips enable more frequent travel. This should however be done carefully, so that e.g. intercontinental trips lasting several weeks are not perceived as low-carbon options. Having said this, measures that are more drastic are needed to reach the two-degree target in the long-term, making substantial decreases in emissions (cf. Allwood et al., Citation2019; Peeters, Citation2017). However, in this process, it is important to design policies that are perceived as fair and effective in order to attain public support (Larsson et al., Citation2020).
Contribution
To conclude, this study has methodological, theoretical, and policy implications. Firstly, this study has developed methods for calculating and analysing the climate impacts from tourism transport centred on tourists’ trip types and the factors distance and transport mode. This could be adapted for other contexts. Secondly, building on previous research (on destination choice, transport mode choice and sustainable consumer behaviour), the study advances knowledge about which trip types cause large emissions of GHG, and tourists’ readiness to change their tourism transport behaviour. Furthermore, why readiness to change behaviour differs between trip types is also a contribution, based on explanatory variables linked to sustainable consumer behaviour research (cf. White et al., Citation2019). Thirdly, for policymakers this study highlights the opportunities and challenges for emissions reduction. In combination with an understanding of tourists’ readiness to change their behaviour, it can guide policymakers in developing suitable policy measures such as distance-based taxes and compulsory climate labelling.
Limitations and future research directions
Several methodological choices and delimitations were made in the present study. Firstly, it has used the concept of trip types to analyse potential emissions reductions. Another possible method would be to use travel motives, which also influence the choice of transport mode and destination (Nicolau & Más, Citation2006; Wall & Mathieson, Citation2006). In addition, this study only includes outbound tourism travel from Sweden. Another perspective would be to map and analyse inbound tourism to a geographical region using the same method, which then would give the entire scope of climate impact from tourism travel (for the specific country).
Due to low detail on travel routes (e.g. transits), emissions were calculated using the shortest distances for all transport modes. Including extra distances from transits would however on a macro level likely not increase emissions more than a few percent (Jamin et al., Citation2004).
There are also significant uncertainties related to the non-CO2 effects. The updated best estimate of 1.7 is lower than the previous figure from 2010 (Lee et al., Citation2020) and results in a reduction of the emission factor we use for air travel with about 10%. This did however only have a minor effect on the analysis since the emissions from alternative trips by train and car are one or several orders of magnitude smaller. Similarly, to calculate the emissions from train travel we have used average emission data for European electricity, while there are several alternative options. For the same reasons, alternative emissions factors for train would not have a substantial impact on the overall conclusion. Thus, the method is robust with regards to these uncertainties and assumptions.
Furthermore, our analysis is based on two separate surveys with different samples. Both samples aim to be representative of the Swedish population, but there are obvious limitations to this approach. In future studies it is recommended, where possible, to include all questions, covering travel behaviour and stated readiness to change behaviour, in one single survey.
Additionally, in the second survey, the respondents answer questions on their readiness to change travel behaviour on only one of the trips they have made in the past two years. This fails to take into account how flying frequency may influence the stated readiness. Future research should aim at considering travel frequency more explicitly.
Finally, the COVID-19 crisis has hit the travel industry hard and it is likely that the readiness to change travel habits and ultimately tourism demand will change when the crisis is over. Tourism travel is however infrequent for most people (Peeters et al., Citation2006), and to study such changes further longitudinal studies are needed. Such studies could capture differences in travel frequency between groups over time (cf. Frändberg, Citation2009), changes in demand for different trip types (e.g. the long-term effects of the crisis on business travel or the recovery of the air travel market), and the impacts of policy initiatives and future disruptive events.
Acknowledgements
We would like to thank our colleagues, in particular Tommy D. Andersson and Jonas Nässén, who offered their insights in early stages of this work and the three reviewers who gave valuable comments to further advance this paper.
Disclosure statement
No potential conflict of interest was reported by the authors.
Data availability statement
Swedes’ travel: The data that support the findings of this study were provided by the Swedish Agency for Economic and Regional Growth. Restrictions apply to the availability of these data. Please see https://tillvaxtverket.se/statistik/turism/svenskars-resande.html
Readiness survey: Due to the nature of this research, participants in this study did not agree to the public sharing of their data.
Additional information
Funding
References
- Aamaas, B., & Peters, G. P. (2017). The climate impact of Norwegians’ travel behavior. Travel Behaviour and Society, 6, 10–18. https://doi.org/10.1016/j.tbs.2016.04.001
- Ahlgren, S., & DI Lucia, L. (2014). Indirect land use changes of biofuel production - a review of modelling efforts and policy developments in the European Union. Biotechnology for Biofuels, 7(1), 35. https://doi.org/10.1186/1754-6834-7-35
- Åkerman, J. (2012). Climate impact of international travel by Swedish residents. Journal of Transport Geography, 25, 87–93. https://doi.org/10.1016/j.jtrangeo.2012.07.011
- Allwood, J., Azevedo, J., Clare, A., Cleaver, C., Cullen, J., Dunant, C. F., Fellin, T., Hawkins, W., Horrocks, I., Horton, P., Ibell, T., Lin, J., Low, H., Lupton, R., Murray, J., Salamanti, M., Serrenho, A. C., Ward, M., & Zhou W. (2019). Absolute zero: Delivering the UK’s climate change commitment with incremental changes to today’s technologies.
- Arnfalk, P., Pilerot, U., Schillander, P., & Grönvall, P. (2016). Green IT in practice: virtual meetings in Swedish public agencies. Journal of Cleaner Production, 123, 101–112. https://doi.org/10.1016/j.jclepro.2015.08.063
- Azar, C., & Johansson, D. (2012). Valuing the non-CO2 climate impacts of aviation. Climatic Change, 111(3–4), 559–579. https://doi.org/10.1007/s10584-011-0168-8
- Borggren, C., Moberg, Å., Räsänen, M., & Finnveden, G. (2013). Business meetings at a distance – decreasing greenhouse gas emissions and cumulative energy demand? Journal of Cleaner Production, 41, 126–139. https://doi.org/10.1016/j.jclepro.2012.09.003
- Buijtendijk, H., & Eijgelaar, E. (2020). Understanding research impact manifestations in the environmental policy domain. Sustainable tourism research and the case of dutch aviation. Journal of Sustainable Tourism.
- Christensen, L. (2016). Environmental impact of long distance travel. Transportation Research Procedia, 14, 850–859. https://doi.org/10.1016/j.trpro.2016.05.033
- Dellaert, B. G. C., Ettema, D. F., & Lindh, C. (1998). Multi-faceted tourist travel decisions: A constraint-based conceptual framework to describe tourists' sequential choices of travel components. Tourism Management, 19(4), 313–320. https://doi.org/10.1016/S0261-5177(98)00037-5
- Edwards, R., Larivé, J.-F., Rickeard, D., & Weindorf, W. (2014). Well–to–tank report version 4.a. JRC Technical Reports. Luxembourg.
- Epstein, A. H., & O’Flarity, S. M. (2019). Considerations for reducing aviation’s CO2 with aircraft electric propulsion. Journal of Propulsion and Power, 35(3), 572–582. https://doi.org/10.2514/1.B37015
- European Environment Agency. (2018). Trends and Projections in Europe 2018: Tracking progress towards Europe’s climate and energy targets. EEA Report. Publications Office of the European Union.
- European Investment Bank. (2019). 2nd EIB climate survey (2/4) citizens’ commitment to fight climate change in 2020. BVA.
- Everitt, B., Landau, S., Leese, M., & Stahl, D. (2011). Cluster analysis. Wiley.
- Frändberg, L. (2009). How normal is travelling abroad? Differences in transnational mobility between groups of young Swedes. Environment and Planning A: Economy and Space, 41(3), 649–667. https://doi.org/10.1068/a40234
- Fuglestvedt, J. S., Shine, K. P., Berntsen, T., Cook, J., Lee, D. S., Stenke, A., Skeie, R. B., Velders, G. J. M., & Waitz, I. A. (2010). Transport impacts on atmosphere and climate: Metrics. Atmospheric Environment, 44(37), 4648–4677. https://doi.org/10.1016/j.atmosenv.2009.04.044
- Goffi, G., & Cucculelli, M. (2014). Components of destination competitiveness. The case of small tourism destinations in Italy. International Journal of Tourism Policy, 5(4), 296–326. https://doi.org/10.1504/IJTP.2014.068035
- Gössling, S., & Buckley, R. (2016). Carbon labels in tourism: persuasive communication? Journal of Cleaner Production, 111, 358–369. https://doi.org/10.1016/j.jclepro.2014.08.067
- Gössling, S., Ceron, J.-P., Dubois, G., & Hall, C. M. (2009). Hypermobile travellers. In Climate change and aviation: Issues, challenges and solutions. Earthscan.
- Gössling, S., Cohen, S. A., & Hibbert, J. F. (2018). Tourism as connectedness. Current Issues in Tourism, 21(14), 1586–1600. https://doi.org/10.1080/13683500.2016.1157142
- Gössling, S., Hanna, P., Higham, J., Cohen, S., & Hopkins, D. (2019). Can we fly less? Evaluating the ‘necessity’ of air travel. Journal of Air Transport Management, 81, 101722.
- Gössling, S., & Peeters, P. (2015). Assessing tourism’s global environmental impact 1900–2050. Journal of Sustainable Tourism, 23(5), 639–659. https://doi.org/10.1080/09669582.2015.1008500
- Gössling, S., Peeters, P., Ceron, J.-P., Dubois, G., Patterson, T., & Richardson, R. B. (2005). The eco-efficiency of tourism. Ecological Economics, 54(4), 417–434. https://doi.org/10.1016/j.ecolecon.2004.10.006
- Grigolon, A. B., Kemperman, A. D., & Timmermans, H. J. (2012). The influence of low-fare airlines on vacation choices of students: Results of a stated portfolio choice experiment. Tourism Management, 33(5), 1174–1184. https://doi.org/10.1016/j.tourman.2011.11.013
- Hair, J. F., Celsi, M., Ortinau, D. J., & Bush, R. P. (2017). Essentials of marketing research. McGraw-Hill/Higher Education.
- Hares, A., Dickinson, J., & Wilkes, K. (2010). Climate change and the air travel decisions of UK tourists. Journal of Transport Geography, 18(3), 466–473. https://doi.org/10.1016/j.jtrangeo.2009.06.018
- Hergesell, A., & Dickinger, A. (2013). Environmentally friendly holiday transport mode choices among students: The role of price, time and convenience. Journal of Sustainable Tourism, 21(4), 596–613. https://doi.org/10.1080/09669582.2013.785555
- IPCC. (1999). Aviation and the global atmosphere –A special report of IPCC working groups I and III. Intergovernmental panel on climate change. Cambridge University Press.
- IPCC. (2014). Climate change 2014: Mitigation of climate change. Contribution of working group III to the fifth assessment report of the intergovernmental panel on climate change. Cambridge University Press.
- Jacobson, L., Åkerman, J., Giusti, M., & Bhowmik, A. K. (2020). Tipping to staying on the ground: Internalized knowledge of climate change crucial for. Sustainability, 12(5), 1994. https://doi.org/10.3390/su12051994
- Jamin, S., Schäfer, A., Ben-Akiva, M. E., & Waitz, I. A. (2004). Aviation emissions and abatement policies in the United States: a city-pair analysis. Transportation Research Part D: Transport and Environment, 9(4), 295–317. https://doi.org/10.1016/j.trd.2004.03.001
- Jansson, J., Marell, A., & Nordlund, A. (2010). Green consumer behavior: determinants of curtailment and eco-innovation adoption. Journal of Consumer Marketing, 27(4), 358–370. https://doi.org/10.1108/07363761011052396
- Julsrud, T. E., & Gjerdåker, A. (2013). Managing obligations and opportunities: Long distance travels and personal network strategies in global organizations. Research in Transportation Business & Management, 9, 29–40.
- Juvan, E., & Dolnicar, S. (2014). The attitude–behaviour gap in sustainable tourism. Annals of Tourism Research, 48, 76–95. https://doi.org/10.1016/j.annals.2014.05.012
- Kantenbacher, J., Hanna, P., Cohen, S., Miller, G., & Scarles, C. (2018). Public attitudes about climate policy options for aviation. Environmental Science & Policy, 81, 46–53.
- Knörr, W., & Hüttermann, R. (2016). EcoPassenger. Environmental Methodology and Data. Heidelberg/Hannover.
- Larsen, G. R., & Guiver, J. W. (2013). Understanding tourists’ perceptions of distance: A key to reducing the environmental impacts of tourism mobility. Journal of Sustainable Tourism, 21(7), 968–981. https://doi.org/10.1080/09669582.2013.819878
- Larsson, J., & Kamb, A. (2018). Semestern och klimatet. Metodrapport. Version 1.0. Chalmers.
- Larsson, J., & Kamb, A. (2019). Travel and climate - Methodology report. Chalmers University of Technology.
- Larsson, J., Kamb, A., Nässén, J., & Åkerman, J. (2018). Measuring greenhouse gas emissions from international air travel of a country’s residents methodological development and application for Sweden. Environmental Impact Assessment Review, 72, 137–144. https://doi.org/10.1016/j.eiar.2018.05.013
- Larsson, J., Matti, S., & Nässén, J. (2020). Public support for aviation policy measures in Sweden. Climate Policy, 20(10), 1305–1321. https://doi.org/10.1080/14693062.2020.1759499
- Lee, D. S., Fahey, D. W., Forster, P. M., Newton, P. J., Wit, R. C., Lim, L. L., Owen, B., & Sausen, R. (2009). Aviation and global climate change in the 21st century. Atmospheric Environment (1994), 43(22), 3520–3537. https://doi.org/10.1016/j.atmosenv.2009.04.024
- Lee, D. S., Fahey, D. W., Skowron, A., Allen, M. R., Burkhardt, U., Chen, Q., Doherty, S. J., Freeman, S., Forster, P. M., Fuglestvedt, J., Gettelman, A., De León, R. R., Lim, L. L., Lund, M. T., Millar, R. J., Owen, B., Penner, J. E., Pitari, G., Prather, M. J., … Wilcox, L. J. (2020). The contribution of global aviation to anthropogenic climate forcing for 2000 to 2018. Atmospheric Environment, 244, 117834.
- Lenzen, M., Sun, Y.-Y., Faturay, F., Ting, Y.-P., Geschke, A., & Malik, A. (2018). The carbon footprint of global tourism. Nature Climate Change, 8(6), 522–528. https://doi.org/10.1038/s41558-018-0141-x
- Li, Q., Long, R., & Chen, H. (2017). Empirical study of the willingness of consumers to purchase low-carbon products by considering carbon labels: A case study. Journal of Cleaner Production, 161, 1237–1250.
- Liao, C. (2017). Leadership in virtual teams: A multilevel perspective. Human Resource Management Review, 27(4), 648–659. https://doi.org/10.1016/j.hrmr.2016.12.010
- Liljestrand, J. (2018). Jag är trött på att visa mitt barn en döende värld. Expressen.
- Littrell, M. A., Baizerman, S., Kean, R., Gahring, S., Niemeyer, S., Reilly, R., & Stout, J. (1994). Souvenirs and tourism styles. Journal of Travel Research, 33, 3–11.
- Moretti, C., Moro, A., Edwards, R., Rocco, M. V., & Colombo, E. (2017). Analysis of standard and innovative methods for allocating upstream and refinery GHG emissions to oil products. Applied Energy, 206, 372–381. https://doi.org/10.1016/j.apenergy.2017.08.183
- Moro, A., & Lonza, L. (2018). Electricity carbon intensity in European Member States: Impacts on GHG emissions of electric vehicles. Transportation Research Part D: Transport and Environment, 64, 5–14. https://doi.org/10.1016/j.trd.2017.07.012
- Nicolau, J. L., & Más, F. J. (2006). The influence of distance and prices on the choice of tourist destinations: The moderating role of motivations. Tourism Management, 27(5), 982–996. https://doi.org/10.1016/j.tourman.2005.09.009
- Oh, J. Y.-J., Cheng, C.-K., Lehto, X. Y., & O’Leary, J. T. (2004). Predictors of tourists’ shopping behaviour: Examination of socio-demographic characteristics and trip typologies. Journal of Vacation Marketing, 10(4), 308–319. https://doi.org/10.1177/135676670401000403
- Pearce, P. L., & Lee, U.-I. (2005). Developing the travel career approach to tourist motivation. Journal of Travel Research, 43(3), 226–237. https://doi.org/10.1177/0047287504272020
- Peeters, P. (2017). Tourism’s impact on climate change and its mitigation challenges : How can tourism become ‘climatically sustainable’?. NHTV.
- Peeters, P., Gossling, S., & Becken, S. (2006). Innovation towards tourism sustainability: Climate change and aviation. International Journal of Innovation and Sustainable Development, 1(3), 184–200. https://doi.org/10.1504/IJISD.2006.012421
- Reichert, A., & Holz-Rau, C. (2015). Mode use in long-distance travel. Journal of Transport and Land Use, 8(2), 87–105. https://doi.org/10.5198/jtlu.2015.576
- Roby, H. (2014). Understanding the development of business travel policies: Reducing business travel, motivations and barriers. Transportation Research Part A: Policy and Practice, 69, 20–35.
- Schäfer, A. W., Barrett, S. R. H., Doyme, K., Dray, L. M., Gnadt, A. R., Self, R., O’Sullivan, A., Synodinos, A. P., & Torija, A. J. (2019). Technological, economic and environmental prospects of all-electric aircraft. Nature Energy, 4(2), 160–166. https://doi.org/10.1038/s41560-018-0294-x
- Schuster, R. M., Hammitt, W. E., & Moore, D. (2006). Stress appraisal and coping response to hassles experienced in outdoor recreation settings. Leisure Sciences, 28(2), 97–113. https://doi.org/10.1080/01490400500483919
- Scott, D., & Becken, S. (2010). Adapting to climate change and climate policy: Progress, problems and potentials. Journal of Sustainable Tourism, 18(3), 283–295. https://doi.org/10.1080/09669581003668540
- SOU. (2019:11). Biojet för flyget. www.regeringen.se
- Souza, G. M., Ballester, M. V. R., Victoria, R. L., & Diaz-Chavez, R. (2015). Bioenergy & sustainability: Bridging the gaps. Environmental Development, 15, 1–2.
- Statistics Sweden. (2018). Svenskarnas resande.
- Stern, P. C. (2000). New environmental theories: Toward a coherent theory of environmentally significant behavior. Journal of Social Issues, 56(3), 407–424. https://doi.org/10.1111/0022-4537.00175
- Stradling, S. G. (2004). Readiness for modal shift in Scotland. Scottish Geographical Journal, 120(4), 265–275. https://doi.org/10.1080/00369220418737211
- Sullivan, A. (2020). To fly or not to fly? The environmental cost of air travel. Deutsche Welle.
- Swedavia Airports. (2020). Trafikstatistik på Swedavias flygplatser. https://www.swedavia.se/globalassets/statistik/swedavia_201912.pdf
- Transport Analysis. (2020). Obligatoriska klimatdeklarationer Rapport för långväga resor.
- Unnasch, S., & Riffel, B. (2015). Review of jet fuel life cycle assessment methods and sustainability metrics. John A. Volpe National Transportation Systems Center (US).
- Verplanken, B., & Roy, D. (2016). Empowering interventions to promote sustainable lifestyles: Testing the habit discontinuity hypothesis in a field experiment. Journal of Environmental Psychology, 45, 127–134. https://doi.org/10.1016/j.jenvp.2015.11.008
- Vidal, J. (2019, January 26). Why I only take one holiday flight a year. The Guardian.
- Wall, G., & Mathieson, A. (2006). Tourism: Changes, impacts, and opportunities. Pearson Prentice Hall.
- White, K., Habib, R., & Hardisty, D. J. (2019). How to SHIFT consumer behaviors to be more sustainable: A literature review and guiding framework. Journal of Marketing, 83(3), 22–49. https://doi.org/10.1177/0022242919825649
- Wolrath Söderberg, M., & Wormbs, N. (2019). Grounded: Beyond flygskam. European Liberal Forum & Fores.