
 ?Mathematical formulae have been encoded as MathML and are displayed in this HTML version using MathJax in order to improve their display. Uncheck the box to turn MathJax off. This feature requires Javascript. Click on a formula to zoom.
Abstract
The climate impact from international aviation was 2.4% of the world’s total climate impact in 2018, and is expected to grow. International regulation of this impact is not aligned with trajectories to stay below 1.5 °C of global warming. Conventional approaches to allocating climate impact to international aviation also lack one of the important drivers for air travel: tourism. Existing studies have focused on the carbon footprint of residents’ outbound air travel, but there is a lack of focus on the climate impact from inbound air travel. This article quantifies the climate impact of inbound air travel, and presents it alongside the impact of outbound air travel, to get a full picture of the climate impact of tourism-driven air travel and provide insights for tourism’s decision-makers. This was done in a case study for Sweden. The results show that the emissions from inbound air travel have grown 3 times more than emissions from outbound air travel each year, at a faster rate than the yearly growth for all international air travel. Responsibility for the climate impacts of inbound and outbound air travel is discussed, along with further actions such as demarketing and focusing on closer source markets.
1 Introduction
International arrivals worldwide grew 5% per year in the 10 years prior to the COVID-19 pandemic, outpacing the growth in global GDP (UNWTO, Citation2020b). With half of all arrivals travelling by air (UNWTO, Citation2020a), global greenhouse gas (GHG) emissions from aviation have also grown. The total CO2 emissions from global aviation were 2.4% of total global CO2 emissions in 2018, and the it total global warming effect could be twice as high if one includes the non-CO2 effects of aviation (Lee et al., Citation2021). International air travel and its climate impact are projected to grow, even given the impact of the COVID-19 pandemic, which temporarily halted this development in 2020 (IATA, Citation2016; ICAO, Citation2020; UNWTO & ITF, Citation2019). Now, air travel is rebounding (Hall et al., Citation2020), and IATA projects that European air travel volumes will be back at pre-pandemic levels by 2024 (IATA, Citation2021). In a baseline scenario expected before the pandemic, aviation GHG emissions would more than double by 2050 compared to 2018 levels (Cames et al., Citation2015). To be aligned with the Paris Agreement’s 1.5 °C target, the IPCC has modelled that global GHG emissions must halve by 2030 and reach net zero around by 2050 (IPCC, Citation2018).
International air travel’s climate impact is best regulated with international measures to ensure consistency. However, the current policy landscape for international aviation is not deemed to be aligned with the 1.5 °C target (ICSA, Citation2019; IEA, Citation2020; Larsson et al., Citation2019). For instance, ICAO’s new market-based instrument called the Carbon Offsetting Reduction Scheme for International Aviation (CORSIA) is criticised for not being sufficient to achieve needed emissions reductions (Graver, Citation2020; IEA, Citation2020). Also, how CORSIA will interact with the EU Emissions Trading System (EU ETS) has not yet been decided, and using only CORSIA could undermine the EU’s emissions reduction ambitions (European Environmental Agency et al., Citation2019; ICF Consulting et al., Citation2020; Larsson et al., Citation2019). ICAO and the EU also advocate technological development to deal with aviation’s climate impact, such as electric or hydrogenfuelled aircraft, yet these have little potential to be commercialised widely within the next 10–20 years (Rondinelli et al., Citation2014; Schäfer et al., Citation2019). Sustainable Aviation Fuels (SAFs), such as biofuels and electrofuels, show more promise in the short to middle term, and are part of net-zero pathways for aviation (European Environmental Agency et al., Citation2019; ICAO, Citation2019c; Wise et al., Citation2017). However, biofuels constitute only 0.05% of current jet fuel consumption, at double the price in Europe, and electrofuels are four times more expensive than conventional fuel (Åkerman et al., Citation2021; Eurocontrol, Citation2021). Therefore, the potential of SAFs is, in the short-term, limited. Given the projected lack of certainty as to whether current policies and technologies can deliver the needed reductions in emissions in time, additional national policies to reduce emissions may be necessary, at least in the short term (Larsson et al., Citation2019).
New climate policies or other measures are often rendered less effective because of the benefits aviation offers: fast and affordable long-haul travel that enables global tourism. Tourism is a major employer in many countries and contributed 10.3% to global GDP in 2019 (WTTC, Citation2020). Nevertheless, in the tourism sector, air travel is the sole biggest contributor to climate change. It contributed 20% of the direct and indirect carbon footprint from tourism in 2013 (Lenzen et al., Citation2018). Seeking tourism growth while also wanting to limit aviation’s climate impact is a common goal conflict for destinations (Elofsson et al., Citation2018).
Given aviation’s climate impact and the lack of adequate international policies, air travel’s climate impact should not be overlooked by national tourism decision-makers, especially in countries with ambitions to reduce their climate impact. Currently, international aviation’s climate impact can be reported voluntarily to the UN in addition to national inventories as the amount of bunker fuels sold (UNFCCC, Citation2020). From a tourism perspective however, this may not be a fair representation of the cause of emissions, as the climate impact associated with a traveller is not necessarily tied to the country where the fuel is sold, due to transfers and transits, for example The validity of bunker fuel as the allocation principle has been called into question before, because for countries with large airport hubs, it does not fairly reflect the population’s GHG emissions from outbound air travel (Larsson et al., Citation2018). Allocation principles based on inbound and outbound travel would be more in line with international tourism patterns
Inbound travel is defined as travel to a country by non-residents, while outbound travel is defined as travel outside a country by its residents (IRTS, Citation2008). The climate impact from outbound air travel has been quantified in several countries (see, e.g. Aamaas et al., Citation2013; Aamaas & Peters, Citation2017; Christensen, Citation2016; Kamb & Larsson, Citation2019). However, existing studies of the climate impact from air travel for international inbound tourism often have a broader focus. For example, Gössling et al. (Citation2015) looked at air travel emissions intensities based on the market composition for inbound tourism, while other studies have looked at the total ecological or carbon footprints from inbound tourism and travel (e.g. Peeters & Schouten, Citation2006; Sharp et al., Citation2016). A focus on the climate impact from international inbound air travel in relation to a nation’s climate ambitions is missing, however.
This article intends to fill this gap and provide insights on the climate impact from international air travel from a tourism perspective. The aim of the article is to quantify the climate impact of international visitors’ inbound air travel, and present it together with the climate impact of residents’ outbound air travel, to see whether this quantification can provide valuable policy insights for tourism’s decision-makers. This will be done using a case study of Sweden, where outbound air travel’s climate impact is already quantified and disclosed publicly by the Swedish Environmental Protection Agency (Swedish Environmental Protection Agency, Citation2021), while outbound air travel has not been studied.
One of Sweden’s climate goals is to reach net-zero GHG emissions by 2045 (Swedish Environmental Protection Agency, Citation2019), a goal the Swedish government has declared they will work proactively to achieve (Sweden’s Ministry of Finance, Citation2019). Furthermore, Sweden has seen an increase in both inbound and outbound tourism in the last decade (Swedish Agency for Economic & Regional Growth, Citation2019), and Sweden aims to increase inbound tourism through active marketing efforts in long-haul markets such as China (Government Offices of Sweden, Citation2019; Ministry of Enterprise & Energy & Communications, 2019; Swedish Tourism Industry Association, n.d.). Inbound tourism to Sweden has also been shown to be dependent on aviation (Naess-Schmidt et al., Citation2019). As such, Sweden is a case with a clear goal conflict, representing a country with ambitious climate goals that is also aiming to grow its inbound tourism numbers from long-haul markets, and is thus a case where important insights may be gained for tourism’s decision-makers.
1.1. Tourism-driven air travel
There are many definitions of tourism, but in the context of this article, we use the IRTS definition of tourist as a visitor who stays overnight for no longer than a year in a place outside their usual environment for any main purpose (business, leisure, personal) except to be employed in the place visited (IRTS, Citation2008). As air travel contributes a large share of the climate impact from tourism (Lenzen et al., Citation2018), tourism-driven air travel is important to understand. Two factors are needed to explain why someone travels to a specific place (Dann, Citation1977). The push factor makes the individual tourist inclined to travel, while the pull factor is what attracts tourists to a specific destination. The push factor is our intrinsic motivation to travel which, from a country perspective, tends to increase outbound air travel. Recent social movements such as “Flygskam” (flight shame) (Gössling et al., Citation2020) specifically targets the push factor. Policies can also target the push factor, for example a policy requiring a climate declaration for long-distance trips, which aims to make consumers more aware of the climate impact of long-distance trips (Åkerman et al., Citation2016).
The pull factor instead promotes inbound tourism to a country and/or destination. This factor will be the focus if the aim is to increase the tourism in a destination or destination country, and is often influenced by destination marketing organisations. Their primary role is to increase the destination’s competitiveness through marketing, as there are many similar destinations out there (Pike & Mason, Citation2011). Attracting direct flights is one proven method for destination marketing organisations to increase numbers of international visitors (Halpern, Citation2008). Marketing and lobbying in target markets are thus ways for destinations to increase their pull factor, and the numbers of international visitors to them. Destinationbased carbon management is a framework that specifically focuses on this pull factor, which destinations can use to manage their carbon footprint (Gössling et al., Citation2015). One option that focus on the pull factor is demand control through demarketing (Beeton & Benfield, Citation2002; Medway et al., Citation2010). Demand control implies controlling the demand for tourism in destination, and demarketing is a means to this end. It aims to reverse the marketing of a certain destination, for either everyone or specific groups, to ensure that the pull factor is reduced. This strategy can also be applied more broadly, e.g. to reduce negative local environmental or social impacts from tourism, or to optimise the tourism demand mix through strategic marketing based on low carbon footprint and high economic yield markets (Sun et al., Citation2020).) . As these push and pull factors are always part of why a person travels to a specific place, both should be taken into account when making decisions concerning tourism with the aim to reduce its climate impact.
2 Climate Impact methodology
To quantify the amount of CO2eq emissions from air travel allocated to inbound tourism a methodology from Larsson et al. (Citation2018) was used. This method was derived from a standardised methodology used to calculate GHG emissions from the transport sector as explained by Schipper and Fulton (Citation2003),and based on the Kaya identity, which is often used to calculate CO2 emissions based on the economy of a whole country or the world (Andrew et al., Citation2017). In total three variables in total were derived to obtain the total GHG emissions from inbound trips: the number of inbound nonresident round trips Tinbound,non−residents [trips], average distance travelled per inbound round trip and CO2eq per passenger kilometre (pkm) Epkm [kg CO2eq/pkm]. Multiplying these variables gives the total amount of GHG emissions Etotal [kg CO2eq], seen in Equationequation 1
(1)
(1) :
(1)
(1)
This method was applied to the case of Sweden, and can be applied to any other country where there is similar data available. Each variable will be explained in the following sections.
2.1. Number of trips
The calculations of the number of trips utilises the number of arriving and departing passengers at Swedish airports with scheduled and non-scheduled international flights Pinternational, collected from the Swedish government agency Transport Analysis (n.d.). By multiplying the number of passengers by the percentage of non-resident passengers (foreigners, travellers from abroad), the number of inbound trips to Sweden by non-residents was calculated. The share of non-resident passengers was retrieved from Kamb and Larsson (Citation2019) who had received it from Swedavia, which is a Swedish state-owned enterprise operating Sweden’s largest airports. It was assumed that all travellers to Sweden coming by air came to Swedish airports only, meaning that visitors flying to nearby airports such as Copenhagen, Denmark were not included.
2.2. Average distance per trip
To calculate the average distance travelled per trip to Sweden by a non-resident traveller, the distance between the origin and final destination for each traveller was first calculated. Data on where a traveller originated from was retrieved from UNWTO (Citation2019a). UNWTO gathers tourism statistics in the form of arriving tourists by country of residence, which for Sweden is reported to UNWTO by Statistics Sweden and Swedish Agency for Economic and Regional Growth as arrivals in accommodation establishments. The distance between Sweden and the tourist’s country of origin was calculated using great-circle distanceFootnote1, the standard used by ICAO to report pkm (ICAO, Citation2009). The data was not fine-grained enough to show from/to which airport the tourist had travelled; instead the geographical mid-point of the country was used for the coordinates, found at https://www.cia.gov/index.html.
The tourist’s country of residence data from UNWTO (Citation2019b) includes passengers arriving in Sweden via all modes of transport. It was therefore multiplied by the percentage of arrivals that can be attributed to air travel. The numbers used were adapted from Naess-Schmidt et al. (Citation2019) and can be seen in . For the countries not included by Naess-Schmidt et al., arrivals were assumed to be 100% by aviation. To get the average distance, the data was weighted by the number of inbound tourists from the specific country and the distance to that country.
Table 1. Table of the percentage of guest nights at commercial accommodation establishments allocated to air travel, data adapted from Naess-Schmidt et al. (Citation2019).
2.3. Average kg CO2eq per pkm
In the calculation of the average kg CO2eq per pkm, the same overall method and material as used by Kamb and Larsson (Citation2019) was used. This includes the non-CO2 effects, thus the kg CO2eq and not just kg CO2, in the final results. This method utilised the total consumption of jet fuel from the International Energy Agency (IEA) (n.d.), using linear trends when the data was unavailable, and specific kg CO2 per kg fuel from IPCC (Citation2006). The total consumption of jet fuel globally was then divided by the total number of kilometres travelled by air globally (total pkm Dtot [km]), on both scheduled and non-scheduled flights, retrieved from ICAO (Citation2019b). With data from ICAO, the share of the weight that ought to be allocated to people (calculated assuming 160 kg per passenger assumed, for their body weight, luggage, seat, etc.) rather than freight on the aircraft was also calculated. The total consumption of jet fuel also includes military use, the exact share not being specified. This share was instead estimated by exponential fit using estimates from IPCC (1999) (7% in 2015), Lee et al. (Citation2010) (11% in 2002), and Gössling and Humpe (Citation2020) (8% in 2018). The estimated military share was then deducted from the total fuel consumption.
An adjustment was made to the kg CO2 per pkm to take into account the difference in emissions from aircraft starting at Swedish airports, due to i.e. the use of bio-fuels and more efficient aircraft than worldwide average. Sweden-specific data for international fuel sold was retrieved from the Swedish Environmental Protection Agency (Citation2019) and data on international pkm with Sweden as the origin of flights were retrieved from the Swedish Transport Agency, with an extrapolation for 2018 as data for 2018 was unavailable. The average percentage difference between global kg CO2 per pkm and Sweden’s kg CO2 per pkm was then used to arrive at the adjusted kg CO2 per pkm for Sweden. The Sweden-specific data could be used directly instead of using the global averages; however, as at least half the planes get fuelled somewhere other than Sweden, the method above was used to reflect this fact in the final results while still adopting a conservative approach to the total impact.
Aviation contributes to global warming through kg CO2 emissions but also through non-CO2 effects such as emissions of particulate matter, water vapour and NOx, and their impacts on aerosols, clouds, and the composition of the atmosphere (Azar & Johansson, Citation2012). These effects are not always included when assessing the climate impact from aviation for policy design, or in official data, as the level of scientific understanding of how large the climate impact is from these emission remains low and estimates have large uncertainties (Azar & Johansson, Citation2012; Lee et al., Citation2010, Citation2021). These effects were included in the latest IPCC report (Boucher et al., Citation2013) and in the Swedish residents’ climate impact from air travel results from Kamb and Larsson (Citation2019), and therefore they are included in this article. Which metric to include them in is also not settled, but for several reasons Global Warming Potential with a 100-year perspective (GWP100) has been deemed appropriate (see for example Fuglestvedt et al., Citation2010). A recent study provided an updated estimate (with reduced uncertainty for the GWP100 factor) for aviation of 1.7, meaning that the total climate impact from aviation is 70% higher than from its CO2 emissions alone (Lee et al., Citation2021). This figure is lower than the previous estimate of 1.9 (Lee et al., Citation2010). Thus, the total CO2 emissions Etotal,CO2 were multiplied by an emissions weighting factor of 1.7 to get the total CO2-equivalent emissions.
. Results
The results for each variable, which when combined yield the climate impact of inbound air travel by non-residents to Sweden, are presented in this section. The results are presented using the same approach for outbound trips by Swedish residents, calculated for 2000–2017 by Kamb and Larsson (Citation2019), with an extrapolation for outbound trips for 2018. These calculations were also updated with the non-CO2 emissions weighting factor of 1.7 (see Section 2.3), instead of the 1.9 factor Kamb and Larsson used, yielding results that can be compared to the calculations for inbound trips in this article. The comparison is presented to provide a comprehensive picture of inbound and outbound air travel to and from Sweden.
3.1. Resulting number of trips
In , the number of round trips by non-residents to Sweden (inbound) and Swedish residents going abroad (outbound) is shown for the period 2014–2018. There was an increase in both inbound and outbound trips from and to Sweden during this period.
Figure 1. Number of international round trips by non-residents and Swedish residents (data based on Kamb and Larsson (Citation2019) and from Transport Analysis (Citation2020)).
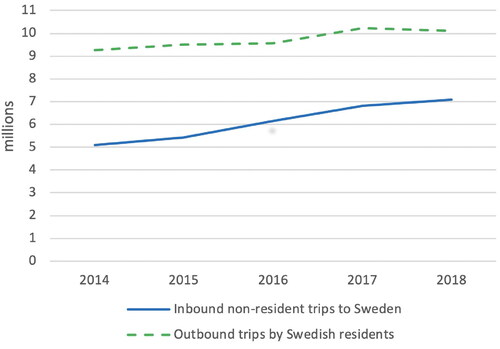
The number of outbound trips is higher than the number of inbound trips, and that did not change during the period. However, the annual percentage growth for 2014–2018 for inbound trips to Sweden was 8.5%, which is almost four times the annual growth rate of outbound trips (2.2%). Also, in 2014–2018 inbound trips increased by 1.98 million trips (38.8% increase), and outbound trips by 0.84 million trips (9.1% increase). This means that even in absolute numbers, inbound trips are increasing more than outbound trips. If this growth were to continue, the number of inbound trips would outstrip the number of outbound trips before 2030.
The number of inbound trips to Sweden increased in the last 10 years (2009–2018) at a growth rate of 8.5% per year, which can be compared to the annual growth rate of all international arrivals, which has been 5% in the last 10 years (UNWTO, Citation2020b). The number of inbound aviation trips to Sweden is thus growing faster than the total number of international arrivals, via all transport modes, worldwide.
3.2. Resulting average distance
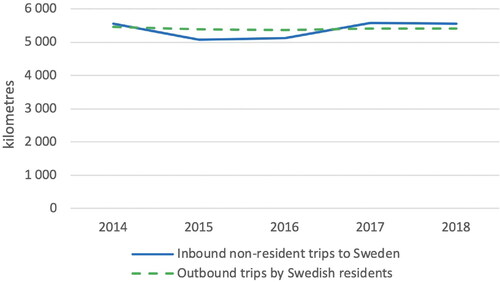
The air travel distances for inbound and outbound round trips for the period 2014–2018 are shown in . The average distances for inbound and outbound round trips are at the same level and both have been stable between 2014 and 2018 at around 5300 km. To put this number into perspective, a round trip from Greece to Sweden (mid-point of the country) is about 5200 km. Other models for air travel worldwide have found similar patterns of low growth in the average distance travelled (Graver et al., Citation2020). The results suggest that Swedish residents on average fly the same distance to their destinations as non-resident travellers travel to get to Sweden. This is reasonable, as air travel connections are convenient for travel both to and from certain areas.
Figure 2. Calculated average round trip distance by non-residents in kilometres, compared to outbound trips by Swedish residents with data based on Kamb and Larsson (Citation2019).
3.3. Resulting average kg CO2eq per pkm
The average kg CO2 per pkm and CO2eq per pkm from 2014 to 2018 are shown in , and are the same for both inbound and outbound trips. The yearly average efficiency improvement in kg CO2 per pkm was 1.36% per year for the period 2014–2018 (compared to 2.7% per year between 2000 and 2013) according to the results. Efficiency improvements have thus been declining in recent years. Furthermore, 2014–2018 was not in line with the industry goal of a 2% annual efficiency improvement according to the results (ICAO, Citation2019a). The overall improvement was a reduction of 5.3% in the period 2014–2018.
Figure 3. Calculated Swedish-adjusted global kg CO2 per pkm and kg CO2eq per pkm including the non-CO2 effects with an EWF at 1.7 (Lee et al., 2021), adjusted for Sweden.
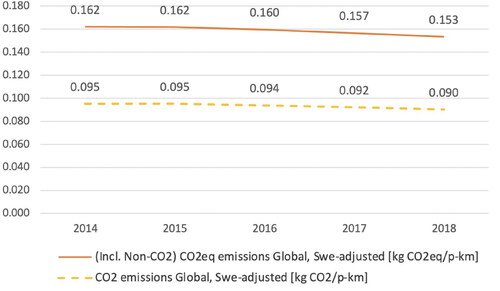
The results in include the adjustment of the GHG emissions per pkm for Sweden. On average, the figure for kg CO2 per pkm based on Swedish data was 6% lower than the global figure between 2000 and 2018, suggesting that aircraft flying from Sweden are on average more efficient. Thus 6% was deducted from the global kg CO2 per pkm to reflect the difference in aircraft being refuelled in Sweden in the round-trips of the inbound and outbound travellers. The resulting intensity figure is thus a bit lower than the global kg CO2 per pkm and should be adjusted accordingly if used in other calculations. The total GHG emissions per pkm, including the non-CO2 effects, are shown by the upper line in , in kg CO2eq per pkm.
To validate these results, they can be compared with the global average kg CO2 per pkm estimates. The figure calculated by the International Council on Clean Transportation (ICCT) of 0.092 kg CO2 per pkm in 2018 (Graver et al., Citation2020) differs by only 4% from the 2018 estimate in this article. The difference is acceptable and the result can thus be deemed valid.
3.4. Total climate impact
The total climate impact from inbound non-resident travellers to Sweden can be seen in . Between 2014 and 2018, the total climate impact from inbound non-residents went from 4.6 Mt CO2-eq in 2014 to 6.05 Mt CO2-eq in 2018, an increase of 31%. This was an increase of about 7.1% per year. The climate impact from outbound trips has been more stable and reached almost the same level in 2018 as it was in 2014, with a total growth of 2.6% or an average growth of 0.5% per year. This difference in growth rates between the climate impact of inbound and outbound air travel is considerable. Globally, the growth rate of aviation’s climate impact between 2013 and 2018 has been estimated to be about 5% per year (Lee et al., Citation2021), which means the climate impact from inbound air travel to Sweden has been growing at a faster rate than worldwide aviation emissions growth, according to the results.
Figure 4. Calculated total climate impact in Mt CO2eq from inbound trips by non-residents, compared with outbound international trips by Swedish residents (data based on Kamb and Larsson (Citation2019)).
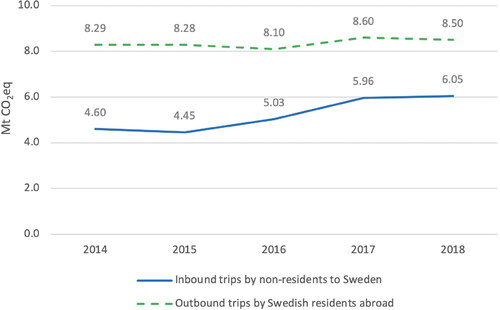
The main source of growth in the climate impact of inbound non-resident trips is the growing number of inbound passengers, since the average distance has only increased marginally (see and ). If this trend were to continue, the climate impact from inbound air travel would surpass the climate impact from outbound travel before 2030, in fact in around 2025 at the rate of growth in these results.
3.5. Uncertainty analysis
The main uncertainty in the quantification of the climate impact in this article concerns the calculations of the average distance using the UNWTO dataset. shows an estimate of how many trips are unaccounted for in the UNWTO data in relation to the number of trips calculated in Section 3.1. As can be seen, between 18 and 30% are missing. Some tourists could also be duplicates, which would happen if they changed accommodation, and the difference could thus be higher. These unaccounted for trips are most likely travellers staying with family and friends or subletting through platforms such as Airbnb. The UNWTO dataset was also partly incomplete, with 16% of the total arrivals in 2014 and up to 24% of the total arrivals in 2018 marked as “other countries of the world.” These were omitted from the calculation of average distance as no more information than this was provided. As almost all European countries were specified in the dataset from UNWTO, it suggests that these other countries are further away. The average distance travelled to Sweden may thus have increased more than the results imply.
Table 2. UNWTO data of total arrivals from air travel at establishments, and calculated total arrivals.
Moreover, the UNWTO data only provides country-level origin data, not specific airports. The average distance could thus also be skewed due to the distance being calculated between the geographical mid-points in the tourist’s country of residence and in Sweden, and not between specific airports. Also, although distances were calculated from the true origin, any extra detours arising from transits were not included. However, the method still provides a better estimate than only looking at the last leg of an inbound trip. This can be seen in , where our results are compared to Swedavia data based on flights landing in Sweden – a 21–27% shorter distance.
Table 3. Average one-way distance calculated from UNWTO arrival data (origin of tourists, UNWTO 2019) at establishments compared to only using the direct arrival countries without transit data from Swedavia (Swedavia, Citation2020).
4 Discussion
The aim of this article was to see whether quantifying the climate impacts of inbound air travel and present it together with the climate impact of outbound air travel can provide new insights for tourism’s decision-makers. Looking at the case of Sweden, the quantification shows that the climate impact from inbound air travel has increased 7.1% annually in the period 2014–2018, while the climate impact of outbound air travel has remained stable. The annual growth of the climate impact from inbound air travel to Sweden has grown at a faster rate than the global average of 5% for aviation’s climate impact (Lee et al., Citation2021). This growth in the climate impact cannot be seen as to be in line with Sweden’s ambitions to proactively work towards reaching net-zero emissions. In this section, the methodology and results will be discussed, along with the insights for tourism’s decision-makers.
4.1. Methodology Discussion
The method utilised in this article is a recognised method for calculating climate impact, and enables quantification using available data. Using more sophisticated data, such as differentiating the climate impact at passenger levels and using specific traveller data would be a more accurate approach. But as such data is not easy to obtain, and sometimes nonexistent, the method in this article calculated the impact in a way that decision-makers could action, so that it could be advisory for national, regional or local aviation and tourism policies. While the simplicity of the method used in this article could be questioned in terms of its accuracy, its simplicity is also one of its strengths if it were used for continuous monitoring, since more complex methods might be too demanding and thus not used at all (Ekvall, Citation2019). Other inbound air travel calculations would result in more indicators (e.g. Becken & Shuker, Citation2019),or more detailed information about the impact from inbound tourists, but would need more input data. These kinds of calculations can be an additional step if the data is available and more insights are needed, while the method used here gives a robust general overview of the impact with the option of comparing the impact from inbound and outbound air travel.
The uncertainties in the UNWTO data that were used to calculate the average distance, along with a lack of supplementary data, suggest a deficiency in the accessible tourism data for Sweden, since the official data available (from Statistics Sweden & Swedish Agency for Economic & Regional Growth Citation2019) are limited to guest nights at accommodation establishments. Detailed data on the origins and destinations of travellers have been used in other studies (e.g. Christensen, Citation2016; Kamb & Larsson, Citation2019), but it is not accessible to the general public. This is probably a common issue for many countries, and are data that should be collected and made available in order to enable accurate estimations. If this study is replicated, in order to reduce uncertainty, the best data available should be used, preferably including the origin and destination airports and all transits for all arriving air passengers. All in all, however, the usage of the UNWTO data was deemed sufficient for the scope and aim of this study.
4.2. Tourism’s allocation
When looking at the climate impact from air travel, using an allocation approach that reflects the profits derived from that sector can be useful. Other allocation approaches, such as the use of bunker fuel, can be added to National Determined Commitments (NDCs) under the Paris Agreement as has been done by the UK government and proposed by Murphy (Citation2020) for example. The allocation of climate impact to inbound air travellers does not omit this proposal, however if not all NDCs are equal, and are included in Sweden but not in the sourcing market, the risk of carbon leakage is great. Some countries can also look good on article, while tourism-driven consumption patterns are missed. Deciding on the inclusion of international aviation’s climate impact in the NDCs for all countries could be good option, however such agreements often take time and in the short term, looking at other allocation approaches can help to advise policymakers when developing policy that makes a difference now, which is much needed for the world to keep within the 1.5 °C target.
The quantified impact from inbound and outbound air travel should be used in a broader determination of the climate impact of a nation’s tourism-driven air travel and advise policy action. Outbound air travel from one country is inbound air travel to another country, and adding the climate impact from both would mean duplicating the climate impact. Yet for decision-makers handling both inbound and outbound tourism, both perspectives can be useful to consider for identifying the best measures to de-carbonise the tourism sector. This means taking action that would allow the whole sector to decarbonise in a way that is fair and consistent to both inbound and outbound tourism, without imposing taxes or policies on residents or non-residents specifically. The allocation option for outbound air travel has already been argued for as valid (Larsson et al., Citation2018); however, the inbound air travel perspective is not often specifically discussed. Considering that tourism brings benefits and that marketing by many countries pulls more tourists, the climate impact that their transport implies cannot be ignored from a system perspective. It can also be argued that since there are active efforts to increase demand for a destination, instructed by strategic growth incentives from the governmental level in Sweden for example (Government Offices of Sweden, Citation2015), the responsibility for these emissions also falls to the destination (inbound tourism) and is not solely the responsibility of the source market nation (outbound tourism).
4.3. Insights for decision-making
Calculating the climate impact from inbound air travel and seeing it in relation to outbound air travel’s climate impact is important for tourism’s decision-makers in assessing whether their tourism strategy is on a sustainable path. Together with the climate ambition of the nation, destination or even municipality, this provides a perspective that can advise policy and which might otherwise be missed. Without quantification, it is difficult to understand the magnitude of the climate impact of international tourism and to develop efficient strategies and policies.
Decision-makers at destinations or in nations must balance their climate policies against the socioeconomic and economic impacts of tourism. In addition, their approaches to outbound and inbound air travel must be balanced and consistent, and take into account the justice perspective. Inbound tourism might have socioeconomic benefits, such as increased GDP, which to some extent could be seen as legitimising its climate impact. But limiting residents’ travel by means of various policies which aim to reduce their climate impact while encouraging inbound tourism, which has a climate impact through the emissions from inbound aviation, could be seen as applying a double standard. Although adding the inbound perspective might make things more complex for a country’s decision-makers, it could also help to balance the socioeconomic benefits of tourism against its costs in terms of climate impact when they are designing policies. And if a destination markets itself to countries that are far away, and wants more tourists to increase its tourism revenue, it is only fair that it also takes at least some responsibility for the resulting increase in emissions from the flights required to bring these inbound tourists. Allocating this climate impact to inbound tourism allows the quantification of this responsibility, which can advise further measures.
The purpose of the quantification was also to provide new policy insights that can be useful in advising tourism decisionmakers. The results from the quantification in Sweden show that the increased climate impact of inbound air travel to Sweden was driven by the growth in passengers (38.5% in the period 2014–2018). The other variables did not grow, GHG emissions per pkm decreased, and the average distance remained stable during this period. If the latter two variables continue along the same path in the future, GHG emissions from inbound tourism should decrease so long as passenger volumes do not increase.
Emissions could be reduced further if the tourist market mix consisted of countries closer to each other, reducing the GHG emissions for each inbound tourist, and thus increasing the eco-efficiency per tourist. One option to achieve this could be demand control through demarketing in faraway markets and refocusing marketing on short-haul origins. This could include a goal to increase domestic tourism instead of international, which would decrease emissions from both inbound and outbound aviation, consequently transferring the emissions to national budgets and already defined national goals. Demarketing could minimise the climate impact from transport by changing the composition of the inbound tourism market, where a country only markets tourism to its nearby countries or domestically. Furthermore, this ensures that marketing strategies do not aim to pull more tourists from faraway markets. Several studies looking at inbound tourism’s environmental impact identify demarketing as an economically beneficial and effective measure for mitigating the climate impact of air travel (Becken & Shuker, Citation2019; Gössling et al., Citation2015; Peeters & Schouten, Citation2006; Sun et al., Citation2020). In recent years, demarketing has been tried in some places, but without rigorous studies on its actual effect on reducing climate impact (Hall et al., Citation2021). For a country like Sweden, marketing to closer markets could mean a slower growth in tourism numbers, as many closer markets are more mature and outbound tourism growth is not as great as in China for example. China is the one of fastest growing tourism source markets in the world (UNWTO, Citation2019a).
However, slowing down growth does not need to be an inherently bad thing. Destinations could focus on optimising the demand mix to achieve a lower carbon intensity as discussed by Sun et al. (Citation2020) for example, while optimising for highvalue rather than high-volume tourism growth. This means focusing on eco-efficiency in the tourism sector and changing the focus of traditional destination management to achieve a lower carbon impact (Gössling & Higham, Citation2020). This could also help destinations avoid overtourism, which has been linked to tourism strategies that focus solely on increasing visitor numbers (Séraphin et al., Citation2019). A slower growth in inbound travellers could thus be beneficial from both an ecological and a social perspective.
Multiple studies have pointed out that counting on voluntary behaviour alone to reduce aviation emissions is insufficient; and must be supplemented by government measures and decisive policy instruments (Higham et al., Citation2016, Citation2019; McKercher et al., Citation2010). Some measures for destination-based carbon management, such as demarketing, do not have a pricing mechanism per se, hence it is not certain that they will have mitigating effects. Therefore, it can also be important to include supplementary measures. These could include policies mandating the use of Sustainable Aviation Fuels or implementing passenger taxes. Sweden has decided to implement its reduction obligation, which aims to reduce CO2 emissions by 27% per litre of fuel by 2030, by for example blending in bio-jet fuels (Government Offices of Sweden, Citation2020). Short-term policies enable the diffusion of long-term innovative policy solutions to achieve the ultimate goal for aviation of having net-zero climate impact, in line with international goals (Larsson et al., Citation2019).
Due to the impacts from COVID-19 on tourism in 2020, CO2 emissions from the aviation sector are currently historically low. Some argue the current disruption provides an opportunity to regrow a more sustainable tourism sector (Gössling et al., Citation2021). Considering that there is public support for more stringent aviation climate policies – provided that they are fair, effective and target the aviation industry rather than individuals (Kantenbacher et al., Citation2018; Larsson et al., Citation2020) – decision-makers could thus grasp this regrowth opportunity to introduce such policies now.
5 Conclusion
The climate impact from inbound air travel in Sweden increased by 31% in the period 2014–2018 and has exhibited a higher annual growth rate than the global average for aviation. The climate impact from outbound air travel is also growing in Sweden, but not at the same rate. Thus, Sweden’s tourism sector cannot be seen as aligned with the trajectory needed to achieve the Paris Agreement’s 1.5 °C goal. Hence, its climate impact needs to be reduced. Tourism strategies and policies ought to shift to promote low-carbon tourism, increasing the eco-efficiency of the tourism demand mix. They should aim to retain the positive effects from tourism, while limiting its negative impacts, especially the climate impact from air travel. While waiting for international policies to take shape, national policies should be used. To start with, destination-based carbon management through demarketing in faraway markets could provide such an opportunity, redirecting the resources to increase tourism from nearby or domestic markets. Supplemented by other policies, such as policies to mandate the use of Sustainable Aviation Fuels, it would provide a comprehensive policy package to reduce the climate impact of inbound and outbound air travel in a harmonised way.
The approach of allocating air travel’s climate impact to inbound travellers as well as outbound travellers provides an indication of whether a country’s tourism sector is on a sustainable path, or if the country needs to act to better align the sector with the Paris Agreement’s 1.5 °C goal. In nations where both tourism growth and ambitious climate goals exist, this quantification can be useful in providing a broader perspective on the tourism sector’s climate impact. It is an easily accessible method, uses available statistics, and can be useful for getting a full picture of international tourism’s climate impact as input when designing tourism policies. To conclude, the allocation approach is a useful measure to consider for achieving ambitious climate goals and designing relevant policies to create a sustainable tourism and aviation sector for the future.
5.1. Future research
That the goal conflict and policy situation identified in Sweden in our case study is unique to Sweden is unlikely. However, more studies would be needed to confirm if similar destinations that aim to grow tourism while having ambitious climate goals are experiencing similar growth patterns. It would also be interesting to look at similar data for small developing island states, which would likely show a much greater difference between inbound and outbound tourism; or countries more accessible by other means of transport than aviation, such as a country in the middle of the European continent. To understand the broader implications, it would also be interesting to study the effect on domestic tourism and air travel from demarketing.
To validate the distance results of this study, a study using more accurate travel data would be helpful, for example with airport origin and destination data.
Lastly, testing this method in practice within a destination marketing organisation to see whether its insights could in fact change marketing priorities would be highly interesting. This would be preferably followed by a longer study looking at the real effects on the climate impact of air travel of marketing to closer destinations, and looking at sustainability more broadly, such as the effects on overtourism and socioeconomic effects.
Acknowledgments
We want to thank Katherine Stuart for proof-reading the article.
Disclosure statement
No potential conflicts of interest were reported by the authors.
Additional information
Funding
Notes on contributors
Maija Happonen
Maija Happonen have a MSc in Industrial ecology and have researched aviation's climate impact in master thesis settings. Part of research cluster for sustainable long-distance tourism travel.
Lisa Rasmusson
Lisa Rasmusson have a MSc in Industrial ecology and have researched aviation's climate impact in master thesis settings. Part of research cluster for sustainable long-distance tourism travel.
Anna Elofsson
Anna Elofsson have a licentiate degree in climate policy instruments for aviation. Participates in the research cluster “Mistra Sustainable Consumption” and in projects on sustainable long-distance travel. Has previously worked as an investigative secretary in the investigation of biofuels for aviation and five years for the city of Zurich as program manager strategic innovation projects to achieve the city's energy and climate goals. Currently also a senior analyst at Swedish Climate Policy Council.
Anneli Kamb
Anneli Kamb is a PhD student with research focused on making long-distance travel sustainable, with particular emphasis on lowering greenhouse gas emissions from air travel. Have prior years of research in the area and publications around the climate impact from outbound air travel from the Swedish population. Part of research cluster for sustainable long- distance tourism travel.
Notes
1 greatcircledistance = Rarccos[sin(lat1)sin(lat2) + cos(lat1)cos(lat2)cos(lon1 − lon2), finding the distance between (lat1, lon1) and (lat2, lon2), where R = 6371,01 km, the mean radius of Earth
References
- Aamaas, B., Borken-Kleefeld, J., & Peters, G. P. (2013). The climate impact of travel behavior: A German case study with illustrative mitigation options. Environmental Science & Policy, 33, 273–282. https://doi.org/10.1016/j.envsci.2013.06.009
- Aamaas, B., & Peters, G. P. (2017). The climate impact of Norwegians’ travel behavior. Travel Behaviour and Society, 6, 10–18. https://doi.org/10.1016/j.tbs.2016.04.001
- Åkerman, J., Larsson, J., & Elofsson, A. (2016). Svenska handlingsalternativ för att minska flygets klimatpåverkan (Report). Retrieved from https://research.chalmers.se/en/publication/246057
- Åkerman, J., Kamb, A., Larsson, J., & Nässén, J. (2021). Low-carbon scenarios for long-distance travel 2060. Transportation Research Part D: Transport and Environment, 99, 103010. https://doi.org/10.1016/j.trd.2021.103010
- Andrew, R. M., Canadell, J. G., Fuss, S., Jackson, R. B., Korsbakken, J. I., Le Quéré, C., & Nakicenovic, N. (2017). Key indicators to track current progress and future ambition of the Paris Agreement. Nature Climate Change, 7, 118–122.
- Azar, C., & Johansson, D. J. (2012). Valuing the non-CO2 climate impacts of aviation. Climatic Change, 111(3–4), 559–579. https://doi.org/10.1007/s10584-011-0168-8
- Becken, S., & Shuker, J. (2019). A framework to help destinations manage carbon risk from aviation emissions. Tourism Management, 71, 294–304. https://doi.org/10.1016/j.tourman.2018.10.023
- Beeton, S., & Benfield, R. (2002). Demand control: The case for demarketing as a visitor and environmental management tool. Journal of Sustainable Tourism, 10(6), 497–513. Retrieved from https://doi.org/10.1080/09669580208667184
- Boucher, O., Randall, D., Artaxo, P., Bretherton, C., Feingold, G., Forster, P., … Midgley, P. (2013). Clouds and aerosols. In: Climate Change 2013: The Physical Science Basis. Contribution of Working Group I to the Fifth Assessment Report of the Intergovernmental Panel on Climate Change Coordinating (Assessment Report). Retrieved from https://www.ipcc.ch/site/assets/uploads/2018/02/WG1AR5{_}Chapter07{_}FINAL-1.pdf
- Cames, M., Graichen, J., Siemons, A., & Cook, V. (2015). Emission reduction targets for international aviation and shipping (Study for the ENVI Committee). European Parliament – Policy Department A: Economic and Scientific Policy. Retrieved from https://www.europarl.europa.eu/RegData/etudes/STUD/2015/569964/IPOL_STU(2015)569964_EN.pdf
- Christensen, L. (2016). Environmental impact of long distance travel. Transportation Research Procedia, 14, 850–859. https://doi.org/10.1016/j.trpro.2016.05.033
- Dann, G. M. (1977). Anomie, ego-enhancement and tourism. Annals of Tourism Research, 4(4), 184–194. https://doi.org/10.1016/0160-7383(77)90037-8
- Ekvall, T. (2019). Attributional and consequential life cycle assessment. In Sustainability assessment at the 21st century. IntechOpen. https://doi.org/10.5772/intechopen.89202
- Elofsson, A., Smedby, N., Larsson, J., & Nässén, J. (2018). Local governance of greenhouse gas emissions from air travel. Retrieved from https://doi.org/10.1080/1523908X.2018.1473152
- Environmental Protection Agency. (2019). Utsläpp av växthusgaser från utrikes sjöfart och flyg -Naturvårdsverket. Retrieved 2020, April 7, from http://www.naturvardsverket.se/Sa-mar-miljon/Statistik-A-O/Vaxthusgaser-utslapp-fran-utrikes-sjofart-och-flyg/
- Eurocontrol. (2021). Data Snapshot 11 on regulatoin and focused logistics unlocking the availability of sustainable aviation fuels (SAF). Retrieved 2022 February 14, from https://www.eurocontrol.int/publication/eurocontrol-data-snapshot-11-saf-airports
- European Environmental Agency, European Union Aviation Safety Agency, & Eurocontrol. (2019). European Aviation Environment Report 2019 (Environmental Report). https://doi.org/10.2822/309946
- Fuglestvedt, J. S., Shine, K. P., Berntsen, T., Cook, J., Lee, D. S., Stenke, A., Skeie, R. B., Velders, G. J. M., & Waitz, I. A. (2010). Transport impacts on atmosphere and climate: Metrics. Atmospheric Environment, 44(37), 4648–4677. Retrieved from www.unfccc.int https://doi.org/10.1016/j.atmosenv.2009.04.044
- Gössling, S., & Higham, J. (2020). The low-carbon imperative: Destination management under urgent climate change. Journal of Travel Research, 60, 004728752093367. https://doi.org/10.1177/0047287520933679
- Gössling, S., & Humpe, A. (2020). The global scale, distribution and growth of aviation: Implications for climate change. Global Environmental Change, 65, 102194. https://doi.org/10.1016/j.gloenvcha.2020.102194
- Gössling, S., Humpe, A., & Bausch, T. (2020). Does ‘flight shame’ affect social norms? Changing perspectives on the desirability of air travel in Germany. Journal of Cleaner Production, 266, 122015. https://doi.org/10.1016/j.jclepro.2020.122015
- Gössling, S., Scott, D., & Hall, C. M. (2015). Inter-market variability in CO2 emission-intensities in tourism: Implications for destination marketing and carbon management. Tourism Management, 46, 203–212. https://doi.org/10.1016/j.tourman.2014.06.021
- Gössling, S., Scott, D., & Hall, C. M. (2021). Pandemics, tourism and global change: A rapid assessment of COVID-19. Journal of Sustainable Tourism, 29(1), 1–20. Retrieved from https://doi.org/10.1080/09669582.2020.1758708
- Government Offices of Sweden. (2015). Regeringens exportstrategi (Strategy Document). Retrieved from https://www.regeringen.se/informationsmaterial/2015/09/ sveriges-exportstrategi/
- Government Offices of Sweden. (2020). Bränslebytet förstärks med högre inblandning av förnybart I drivmedel (Press release). Retrieved from https://www.regeringen.se/pressmeddelanden/2020/09/branslebytet-forstarks-med-hogre-inblandning-av-fornybart-i-drivmedel/
- Government Offices of Sweden. (2019). Sveriges export-och investeringsstrategi (Strategy Document). Retrieved from https://www.regeringen.se/4af119/contentassets/767f609718b44d9c9415cf4b82f44a09/final_exportstrategi_191209.pdf
- Graver, B. (2020). COVID-19’s big impact on ICAO’s CORSIA baseline. ICCT. Retrieved from https://theicct.org/blog/staff/covid-19-impact-icao-corsia-baseline
- Graver, B., Rutherford, D., & Zheng, S. (2020, October). CO2 Emissions from Commercial Aviation 2013, 2018, and 2019 (Publication). The International Council on Clean Transportation. Retrieved from https://theicct.org/sites/default/files/publications/CO2-commercial-aviation-oct2020.pdf
- Hall, C. M., Scott, D., & Gössling, S. (2020). Pandemics, transformations and tourism: Be careful what you wish for. Tourism Geographies, 22(3), 577–522. Retrieved from https://doi.org/10.1080/14616688.2020.1759131
- Hall, C. M., Wood, K. J., Cheer, J. M., Graci, S., & Dolezal, C. (2021). Demarketing tourism for sustainability: degrowing tourism or moving the deckchairs on the Titanic? Sustainability, 13(3), 1585. Retrieved from https://www.mdpi.com/2071-1050/13/3/1585/htm https://www.mdpi.com/2071-1050/13/3/1585 https://doi.org/10.3390/su13031585
- Halpern, N. (2008). Lapland’s airports: Facilitating the development of international tourism in a peripheral region. Scandinavian Journal of Hospitality and Tourism, 8(1), 25–47. https://doi.org/10.1080/15022250801987762
- Higham, J., Cohen, S. A., Cavaliere, C. T., Reis, A., & Finkler, W. (2016). Climate change, tourist air travel and radical emissions reduction. Journal of Cleaner Production, 111, 336–347. https://doi.org/10.1016/j.jclepro.2014.10.100
- Higham, J., Ellis, E., & Maclaurin, J. (2019). Tourist aviation emissions: A problem of collective action. Journal of Travel Research, 58(4), 535–548. Retrieved from https://doi.org/10.1177/0047287518769764
- IATA. (2016, October). IATA forecasts passenger demand to double over 20 years. Retrieved 2020 August 18, from https://www.iata.org/en/pressroom/pr/2016-10-18-02/
- IATA. (2021). Air traffic movement outlook – Europe. Author. Retrieved from https://www.iata.org/en/iata-repository/publications/economic-reports/air-traffic-movement-outlook-europe–-august-2021/
- ICAO. (2009). Reporting instructions filing requirements. Retrieved from http://www.icao.int/staforms
- ICAO. (2019a). 2019 Environmental report – Aviation and environment (Environmental Report). Montreal. Retrieved from https://www.icao.int/environmental-protection/Documents/ICAO-ENV-Report2019-F1-WEB(1).pdf
- ICAO. (2019b). Presentation 2018 air transport statistical results (Statistics Presentation). Retrieved from https://www.icao.int/annual-report-2018/Documents/Annual.Report.2018{_}AirTransportStatistics.pdf
- ICAO. (2019c). Sustainable aviation fuels (SAF). Retrieved 2020, April 24, from https://www.icao.int/environmental-protection/pages/SAF.aspx
- ICAO. (2020, October 28). Effects of novel coronavirus (COVID-19) on civil aviation: Economic impact analysis. Montréal, Canada. Retrieved from https://www.icao.int/sustainability/Pages/Economic-Impacts-of-COVID-19.aspx
- ICF Consulting, Air Transportation Analytics, Econometrics, HFW, & Sven Starckx. (2020). Assessment of ICAO’s global market-based measure (CORSIA) pursuant to Article 28b and for studying cost pass- through pursuant to Article 3d of the EU ETS Directive. Retrieved from https://www.transportenvironment.org/publications/eus-assessment-corsia-airline-co2-deal
- ICSA. (2019). Envisioning a “Zero Climate Impact” International Aviation Pathway Towards 2050: How governments and the aviation industry can step-up amidst the climate emergency for a Sustainable Aviation Future [Working paper].
- IEA. (2020). Aviation. Paris. Retrieved from https://www.iea.org/reports/aviation
- IEA. (n.d.). Data tables – Data & statistics – IEA. Retrieved 2020 April 01, from https://www.iea.org/data-and-statistics/data-tables?country=WORLD{&}energy=Oil{&}year=
- IPCC. (1999). Institutional framework. In J.E. Penner, D.H. Lister, D.J. Griggs, D.J. Dokken, & M. McFarland (Eds.), Aviation and the global atmosphere (chap. 10). Cambrige University Press. Retrieved from https://www.ipcc.ch/report/aviation-and-the-global-atmosphere-2/
- IPCC. (2006). Volume 2: Energy. In 2006 IPCC guidelines for national greenhouse gas inventories (chap. 1). Retrieved from https://www.ipcc-nggip.iges.or.jp/public/2006gl/pdf/2{_}Volume2/V2{_}1{_}Ch1{_}Introduction.pdf
- IPCC. (2018). Summary for policymakers. In: Global Warming of 1.5 °C. An Special Report on the impacts of global warming of 1.5 °C above pre-industrial levels and related global greenhouse gas emission pathways, in the context of strengthening the global response to the threat of climate change, sustainable development, and efforts to eradicate poverty.
- IRTS. (2008). International recommendations for tourism statistics 2008. United Nations Publications. Retrieved from https://unstats.un.org/unsd/publication/Seriesm/SeriesM{_}83rev1e.pdf
- Kamb, A., & Larsson, J. (2019). Climate footprint from Swedish residents’ air travel (Report). Gothenburg. Retrieved from https://research.chalmers.se/en/publication/508693
- Kantenbacher, J., Hanna, P., Cohen, S., Miller, G., & Scarles, C. (2018). Public attitudes about climate policy options for aviation. Environmental Science & Policy, 81, 46–53. https://doi.org/10.1016/j.envsci.2017.12.012
- Larsson, J., Elofsson, A., Sterner, T., & Åkerman, J. (2019). International and national climate policies for aviation: A review. Climate Policy, 19(6), 787–799. Retrieved from https://doi.org/10.1080/14693062.2018.1562871
- Larsson, J., Kamb, A., Nässén, J., & Åkerman, J. (2018). Measuring greenhouse gas emissions from international air travel of a country’s residents methodological development and application for Sweden. Environmental Impact Assessment Review, 72, 137–144. Retrieved from https://doi.org/10.1016/j.eiar.2018.05.013
- Larsson, J., Matti, S., & Nässén, J. (2020). Public support for aviation policy measures in Sweden. Climate Policy, 20(10), 1305–1321. Retrieved from https://doi.org/10.1080/14693062.2020.1759499
- Lee, D. S., Fahey, D. W., Skowron, A., Allen, M. R., Burkhardt, U., Chen, Q., Doherty, S. J., Freeman, S., Forster, P. M., Fuglestvedt, J., Gettelman, A., De León, R. R., Lim, L. L., Lund, M. T., Millar, R. J., Owen, B., Penner, J. E., Pitari, G., Prather, M. J., Sausen, R., & Wilcox, L. J. (2021). The contribution of global aviation to anthropogenic climate forcing for 2000 to 2018. Atmospheric Environment (Oxford, England : 1994), 244, 117834. https://doi.org/10.1016/j.atmosenv.2020.117834
- Lee, D. S., Pitari, G., Grewe, V., Gierens, K., Penner, J. E., Petzold, A., Prather, M. J., Schumann, U., Bais, A., Berntsen, T., Iachetti, D., Lim, L. L., & Sausen, R. (2010). Transport impacts on atmosphere and climate: Aviation. Atmospheric Environment (Oxford, England : 1994), 44(37), 4678–4734. Retrieved from https://www.sciencedirect.com/science/article/pii/S1352231009004956{#}tbl13 doi: 10.1016/j.atmosenv.2009.06.005
- Lenzen, M., Sun, Y. Y., Faturay, F., Ting, Y. P., Geschke, A., & Malik, A. (2018). The carbon footprint of global tourism. Nature Climate Change, 8(6), 522–528. Retrieved from jun https://doi.org/10.1038/s41558-018-0141-x
- McKercher, B., Prideaux, B., Cheung, C., & Law, R. (2010). Achieving voluntary reductions in the carbon footprint of tourism and climate change. Journal of Sustainable Tourism, 18(3), 297–317. Retrieved from https://doi.org/10.1080/09669580903395022
- Medway, D., Warnaby, G., & Dharni, S. (2010). Demarketing places: Rationales and strategies. Journal of Marketing Management, 27(1-2), 124–142. Retrieved from dec https://doi.org/10.1080/02672571003719096
- Ministry of Enterprise, Energy and Communications. (2019). Riktlinjer för budgetåret 2020 avseende viss verksamhet vis VisitSweden AB inom utgiftsområde 24 Näringsliv N2019/01221/FF (Government decision).
- Murphy, A. (2020). Inclusion of international aviation emissions under the Paris Agreement’s Nationally Determined Contributions (NDCs). In F. Fichert, P. Forsyth, & H.-M. Niemeier (Eds.), Aviation and Climate Change (1st Edition, pp. 221–228). Routledge. https://doi.org/10.4324/9781315572406-12
- Naess-Schmidt, S., Dahlberg, E., & Hansen, M. M. (2019). Flygets roll för besöksnäring och miljö i Sverige (Report). Retrieved from https://tillvaxtverket.se/vara-tjanster/publikationer/publikationer-2019/2019-11-28-flygets-roll-for-besoksnaring-och-miljo-i-sverige.html
- Peeters, P., & Schouten, F. (2006). Reducing the ecological footprint of inbound tourism and transport to Amsterdam. Journal of Sustainable Tourism, 14(2), 157–171. Retrieved from https://doi.org/10.1080/09669580508669050
- Pike, S., & Mason, R. (2011). Destination competitiveness through the lens of brand positioning: The case of Australia’s Sunshine Coast. Current Issues in Tourism, 14(2), 169–182. https://doi.org/10.1080/13683501003797523
- Retrieved from https://doi.org/10.1016/j.tourman.2014.06.021
- Rondinelli, S., Sabatini, R., & Gardi, A. (2014). Challenges and benefits offered by liquid hydrogen fuels in commercial aviation. In Practical responses to climate change. engineers australia convention 2014 (prcc 2014). https://doi.org/10.13140/2.1.2658.9764
- Schäfer, A. W., Barrett, S. R. H., Doyme, K., Dray, L. M., Gnadt, A. R., Self, R., O’Sullivan, A., Synodinos, A. P., & Torija, A. J. (2019). Technological, economic and environmental prospects of all-electric aircraft. Nature Energy, 4(2), 160–166. Retrieved from https://www.nature.com/articles/s41560-018-0294-x{#}Sec6 https://doi.org/10.1038/s41560-018-0294-x
- Schipper, L. J., & Fulton, L. (2003). Carbon dioxide emissions from transportation: Trends, driving factors, and forces for change. In D. Hensher & K. Button (Eds.), Handbook of transport and the environment (Vol. 4, pp. 203–225) Emerald Group Publishing Limited. https://doi.org/10.1108/9781786359513-011
- Séraphin, H., Zaman, M., Olver, S., Bourliataux-Lajoinie, S., & Dosquet, F. (2019). Destination branding and overtourism. Journal of Hospitality and Tourism Management, 38, 1–4. https://doi.org/10.1016/j.jhtm.2018.11.003
- Sharp, H., Grundius, J., & Heinonen, J. (2016). Carbon footprint of inbound tourism to Iceland: A consumption-based life-cycle assessment including direct and indirect emissions. Sustainability, 8(11), 1147. Retrieved from http://www.mdpi.com/2071-1050/8/11/1147 https://doi.org/10.3390/su8111147
- Statistics Sweden and Swedish Agency for Economic and Regional Growth. (2019). Inkvarteringsstatistik – Län/region. Retrieved from https://www.vastsverige.com/turistradet-vastsverige/inkvartering-lan/
- Sun, Y. Y., Lin, P. C., & Higham, J. (2020). Managing tourism emissions through optimizing the tourism demand mix: Concept and analysis. Tourism Management, 81, 104161. doi: 10.1016/j.tourman.2020.104161
- Swedavia. (2020). Statistik | Om Swedavia. Retrieved 2020-03-02, from https://www.swedavia.se/om-swedavia/statistik/
- Sweden’s Ministry of Finance. (2019). Sverige ska bli ett fossilfritt föregångsland. Retrieved from https://www.regeringen.se/artiklar/2019/10/sverige-ska-bli-ett-fossilfritt-foregangsland/
- Swedish Agency for Economic and Regional Growth. (2019). Fakta om svensk turism 2018 [Statistics Report]. Tillväxtverket.
- Swedish Environmental Protection Agency. (2019). Sveriges klimatmål och klimatpolitiska ramverk. Retrieved 2020 March 23, from https://www.naturvardsverket.se/Miljoarbete-i-samhallet/Miljoarbete-i-Sverige/Uppdelat-efter-omrade/Klimat/Sveriges-klimatlag-och-klimatpolitiska-ramverk/{#}
- Swedish Environmental Protection Agency. (2021). Flygets klimatpåverkan. Retrieved 2021 October 23, from https://www.naturvardsverket.se/amnesomraden/klimatomstallningen/omraden/klimatet-och-konsumtionen/flygets-klimatpaverkan
- Swedish Tourism Industry Association. (n.d.). Strategiarbete | Svensk Turism. Retrieved 2020, August 17, from https://www.svenskturism.se/strategiarbete
- Transport Analysis. (2020). Luftfart 2019 (Statistics Report). Retrieved from https://www.trafa.se/en/civil-aviation/
- Transport Analysis. (n.d.). Civil Aviation. Retrieved 2020 March 27, from https://www.trafa.se/en/civil-aviation/
- UNFCCC. (2020). Emissions from fuels used for international aviation and maritime transport. Retrieved from https://unfccc.int/topics/mitigation/workstreams/emissions-from-international-transport-bunker-fuels#eq-2
- UNWTO. (2019a). Guidelines for success in the chinese outbound tourism market. Madrid. Retrieved from https://doi.org/10.18111/9789284421138
- UNWTO. (2019b). Sweden: Country-specific: Arrivals of non-resident tourists in all types of accommodation establishments, by country of residence 2014–2018 (11.2019): Tourism Statistics: Vol, No 1. In Unwto tourism statistics. United Nations World Tourism Organisation. Retrieved from https://doi.org/10.5555/unwtotfb0752191220142018201911
- UNWTO. (2020a). Global and regional tourism performance. Retrieved from https://www.unwto.org/global-and-regional-tourism-performance
- UNWTO. (2020b). World Tourism Barometer. Retrieved from https://www.unwto.org/world-tourism-barometer-n18-january-2020
- UNWTO & ITF. (2019). Transport-related CO2 emissions of the tourism sector: modelling results. UNWTO. Retrieved from https://doi.org/10.18111/9789284416660
- Wise, M., Muratori, M., & Kyle, P. (2017). Biojet fuels and emissions mitigation in aviation: An integrated assessment modeling analysis. Transportation Research Part D: Transport and Environment, 52, 244–253. https://doi.org/10.1016/j.trd.2017.03.006
- WTTC. (2020, June). Travel and tourism – Global economic impact & trends 2020 (Report). World Travel & Tourism Council. Retrieved from https://wttc.org/Research/Economic-Impact