
Abstract
Strong leadership by destination management organizations (DMOs) is urgently needed to foster significant emissions reductions at the macro-level. With an increasing number of DMOs pledging to the Tourism Declares initiative and the Glasgow Declaration, achieving net-zero becomes a responsibility. This study (1) proposes nine macro-level decarbonization factors as a framework for DMOs to strategize their climate actions, and (2) examines whether DMOs’ pledges and plans address critical decarbonization factors. It is found that most DMOs do not fully utilize all effective factors in their climate strategies. More than half of the DMOs focus on improving the energy intensity of tourism businesses and inspiring tourists toward green service, factors that, alone, are insufficient. We identify two key initiatives on which DMOs can have the most influence, yet they are rarely considered: optimizing the marketing mix for low-emission groups and setting a growth threshold. We conclude with recommendations on how they might improve their commitments for real progress toward the net-zero transition.
Introduction
The tourism sector strives to align with individual country pathways to limit global warming to within 1.5 °C. Based on the IPCC guideline (Citation2018), this will require the sector to reduce its emissions by 45% from 2010 levels by 2030 and to achieve net-zero emissions around 2050. This is a daunting task given the sector’s emissions grew, persistently, at an annual rate of 3% pre-COVID (Lenzen et al., Citation2018). Urgent and comprehensive measures are imperative to mitigate the environmental impact of the tourism industry.
Reducing tourism’s carbon footprint requires leadership from all stakeholders. At the local level, destination management organizations (DMOs) are critical players in leading and coordinating activities under a coherent strategy to pursue decarbonization (UN World Tourism Organization [UNWTO], Citation2019). Recently, ambition in DMOs’ climate management has been seen through pledges by joining two important tourism responses to climate change: Tourism Declares (Citation2022) and the Glasgow Declaration on Climate Action for Tourism (One Planet Network, Citation2021). Across both initiatives, over 900 tourism organizations, including 29 DMOs, had signed up to one or the other by the early 2023. Both initiatives require DMOs to pledge to publicly support and commit to the net-zero pathway.
Even though the DMOs are trusted with delivering ambitious decarbonization goals, there have been limited discussions on either how the DMOs can contribute to the decarbonization progress of their destinations, or what exactly is their responsibility over the outcome for which they are accountable. This challenge is reflected in the limited evidence of climate governance in tourism contexts based on comprehensive reviews of national and regional tourism policies (Becken et al., Citation2020; Conefrey & Hanrahan, Citation2022). In addition, most DMO studies have focused on their marketing activities and destination attributes without explicitly addressing their roles and responsibilities in leading decarbonization (Triandafil et al., Citation2022). Bhandari et al. (Citation2016) found some DMOs struggle to come up with an effective approach in guiding climate actions: “As a tourism destination, we haven’t got a strategy to deal with climate change” (p. 65).
To advance decarbonization efforts, it is essential to understand the factors that increase or decrease carbon emissions, given the range of carbon management actions available. Current decarbonization initiatives primarily focus on individual tourism firms with recommendations such as adapting high-efficiency appliances or introducing waste management systems (See detailed recommendation in World Travel and Tourism Council [2021]). While these are important adaptations for individual businesses, knowledge about macro-level drivers of carbon emissions at the destination level remains limited. Consequently, there remains a significant knowledge gap about whether the DMOs climate-related policies and strategies are adequately targeting, collectively, the key drivers of tourism emissions.
The other challenge for DMOs to lead decarbonization rests on the level of influence they can exert on tourism climate governance. Tourism is a complex system. Destination governance cannot follow the top-down management of companies; instead, it builds on influencing cooperation between a variety of stakeholders toward joint goals and actions (Volgger & Pechlaner, 2014). DMOs are expected to achieve better emissions mitigation progress if they invest in areas where they have the most influence. This means that DMOs have greater availability of resources and managerial control over processes (Sainaghi, Citation2006).
To reflect the status of DMOs carbon management policy, this paper examines DMOs’ net zero pledges and plans and answer: (1) whether current strategies that DMOs propose address critical decarbonization factors, and (2) the levels of organization control that the DMOs have on those factors. First, we systematically review longitudinal national and subnational tourism carbon emissions studies to identify macro-level factors that elevate or inhibit emissions at destinations. These factors are important drivers of emission changes and, hence, a key priority area to focus on with respect to the DMOs net-zero intentions. Second, to map out the DMOs’ proposed actions, we review their public commitments put forward in the Tourism Declares and the Glasgow Declaration pledges and plans. By cross-linking mitigation drivers and the DMOs’ climate actions disclosed, we discuss their current role in carbon management and their influence on the decarbonization factors. In so doing, we share new knowledge by identifying, first, factors where DMOs may have the most influence on emissions mitigation, and second, the (in)adequacy of their existing approaches.
Methodology
The study adopts a three-stage approach to assess DMOs’ net zero pledges and plans. We begin with a targeted literature review to summarize macro-level decarbonization factors, followed by a qualitative assessment of the level of influence DMOs may exert on each factor. Based on this knowledge, we then evaluate the climate policies and strategies put forward by DMOs on Tourism Declares and the Glasgow Declaration to determine whether DMOs have targeted the key drivers with the high level of control they might exert.
Identifying macro decarbonisation factors
Longitudinal studies present emissions over time and are an important resource for identifying key drivers of emissions changes for tourism. We reviewed national and subnational (region, city) longitudinal studies published before 2023 in Google Scholar employing the keywords “environmental input-output analysis, tourism carbon emission, measure, CO2 emission, greenhouse gas emissions, carbon footprint.” We selected studies that specifically included longitudinal measurements, which allowed us to observe emission trends and identify contributing factors. We identified additional studies through a snowballing approach based on the references. The search included academic cases at the national and subnational (regional and city) levels for a comprehensive evaluation of all possible factors; to maintain a scholarly and research-oriented scope, we excluded technical reports and consulting reports.
Evaluating the level of influence DMOs may exert on each decarbonisation factor
Differences in the DMOs’ organizational structure, scale of operation, level of decentralization, and capacity for action can translate into different degrees of influence on the macro-level decarbonization factors (UNWTO, Citation2019, Citation2023). To assess their level of influence, Sainaghi (Citation2006) proposed a framework for DMOs by considering the availability of, and DMOs’ managerial responsibility for, resources and processes. In the Sainaghi framework, resources refer to the ownership and control of available stocks, with the stocks categorized as material, immaterial or human resources (Grant, Citation2021). Material resources include financial and physical resources; immaterial resources include technology, image, and culture; while human resources comprise personal competencies, knowledge, motivation, relational and communication skills. Processes involve actions that change the quantity and qualitative traits of the stock, such as constructing a new airport (material resource), developing a sustainable destination brand (immaterial resource), or launching a carbon literacy training course for staff (human resource).
Sainaghi (Citation2006) suggested that DMOs have: maximum influence if they control the resources and hold managerial responsibility for the processes; medium influence if they control resources but the local government or tourism firms oversee the processes; or minimum/no influence if both factors are in the hands of others.
We adopt this framework as a lens to explore DMOs’ managerial responsibilities for the resources and processes necessary to decarbonize the destinations. The lead author initiated the analysis; then, through multiple rounds of discussion and consultation with the literature to reconcile any differing interpretations, the authors jointly arrived at a consensual interpretation, similar to the approach adopted by prior interpretative research (Guix & Petry, Citation2023).
Evaluating DMOs net-zero pledges and plans
We focused on the DMOs that had made pledges under the Tourism Declares initiative and the Glasgow Declaration. Tourism Declares, launched in January 2020, rallied organisations to commit to developing Climate Action Plans. Subsequently, at the UN COP26 in November 2021, the UNWTO launched the Glasgow Declaration on Climate Action in Tourism. As of 31 March 2023, 28 DMOs with different levels of decentralization had published declarations (4 national, 15 regional and 9 city) and, of those, 5 had disclosed their plans. Given that organisations commit to publish a climate action plan after 12 months of signing the Glasgow Declaration we reviewed the One Planet Database by 31 March 2024 and identified ten additional organisations had published a plan (Appendix 1). We retrieved the publicly available 28 pledges and the 15 decarbonization plans from the official websites of the two initiatives and the DMOs.
In the case of these two initiatives, each DMO pledged: (i) their commitment to recognize climate change and a willingness to address it; (ii) their alignment with international goals (e.g. the Paris Agreement); (iii) their direction and intent for future strategies; and (iv) that their organization was taking proactive steps towards climate action in collaboration with their destination’s stakeholders. This information allows us to map out the current status of DMOs direction and approaches in net zero transition.
In the next, we discuss the results in the following two sections. Section 3 elaborates on nine macro-level decarbonization factors, followed by Section 4, which explains the level of DMOs’ influence on each factor and their current decarbonization plans.
Nine macro-level decarbonization factors
Our review covered 28 longitudinal carbon emissions studies across six countries and 20 of which focused on China. All the studies observed continual growth in tourism emissions over time, with compound annual growth rates ranging from 1.0% to 20.9% (). Across these studies, we summarized nine factors that contributed to tourism emissions changes. The factors were classified as either: (1) demand factors, (2) supply factors, or (3) destination management attributes (interaction between supply and demand).Footnote1
Table 1. Empirical studies on destination (national, regional, city) tourism carbon emission calculations and factors of CO2 emission changes.
Demand factors
Across all the studies reviewed, we find that tourism demand is the main driving force for the growth in destination emissions. Tourism demand is characterized by: (1) scale growth (the number of tourists), (2) expenditure size (the average expenditure per tourist), and (3) changes in the tourists’ consumption structures (changes in the products/services consumed).
Scale growth
Rapid growth in visitor numbers is the primary cause of tourism carbon emissions. Increases in the total number of visitors, holding everything else constant, lead to higher demand for goods and services and greater energy consumption. All cases observed here reported a strong tourism demand. For example, in China, more than a 10-fold increase in visitor numbers over a 22-year period led to an 1149% increase in emissions from tourism activities (Tang et al., Citation2014). At the regional level, drastic tourism growth is also often reported. In Chengdu province, China, growth in the number of tourists accounted for 113.4% of the total emission increase (Liu et al., Citation2011).
Expenditure size
The average amount spent by visitors (the average spending per person trip) is the second factor that drives emissions growth. Empirical studies find that people spend more per trip over time, consuming more goods and services (e.g. Tang et al., Citation2017). In Taiwan, a 43% rise in expenditure in a decade was accompanied by a 33% increase in direct tourism carbon emissions (Sun, Citation2016). In Norway, an increase in total tourism spending by 22% increased tourism emissions by 160%. In the Yangtze River Delta (China), a rise in tourist expenditure, with an average annual growth rate of 2.5%, correspondingly increased carbon emissions by approximately 31% (Chen et al., Citation2018).
Consumption structure
Changes in the consumption structures (tourists’ spending profiles) often lead to increased carbon emissions. One significant travel trend is the preference to travel farther and with greater reliance on aviation (Larsson et al., Citation2018; Peeters & Landré, Citation2011). Between 2011 and 2019, total aviation passenger kilometres increased by 7.9% annually, outpacing the 3.9% per year growth in tourism demand over the same period (ICAO, Citation2018; World Travel & Tourism Council [WTTC], Citation2019a). Air travel, as a carbon-intensive product, is a strong contributor to carbon emissions growth for many destinations, including Taiwan, Norway, New Zealand, and China (Sun et al., Citation2022; Sun & Higham, Citation2021; Yu et al., Citation2019), a pattern also shown by Dutch holidaymakers in their outbound travel (Eijgelaar et al., Citation2017).
Changes in consumption of non-transport items also influence trip emissions but the change can be experienced in both directions. For example, in Norway, as preferences toward recreational activities increased over time, average trip emissions reduced; likewise, in Taiwan, visitors’ preferences toward locally produced items over imports reduced tourism emissions. In contrast, increased consumption of emission-intensive dairy products and souvenirs in New Zealand contributed to rising carbon emissions. While opportunities exist to alter consumption patterns toward green travel, most of the studies we reviewed find that the average consumption structure of tourists remains relatively stable over time. Across studies, consumption structure has a minimal effect (< 2%) in mitigating the overall tourism footprint.
Supply factors
Three supply factors provide the primary mechanisms to mitigate carbon emissions. These are: energy intensity (a proxy for energy use per dollar of tourism revenue), energy structure (the energy mix), and the supply chain (indirect emissions from the suppliers).
Energy intensity
Improving energy intensity through technological and operational advancements is perceived as a primary solution toward fighting climate change. A variety of strategies have been proposed for and implemented by tourism firms, for example, adopting new transport fleets, implementing energy efficient appliances, and installing heat insulation. All studies in our review identified progress on reducing energy intensity in tourism; however, the rate of improvement varied across subsectors, with accommodation and restaurant service providers showing continuous improvement but air transport companies failing to do so (Cadarso et al., Citation2015; Filimonau et al., Citation2011).
While energy efficiency has progressed, efficiency improvements are lesser among tourism firms than shown by their suppliers (Chen et al., Citation2018; Sun, Citation2016). Several reasons are observed: the high implementation costs of low-carbon technologies (especially in regional destinations); a lack of government leadership; poor customer acceptance; and uncertainty regarding return on investment for large projects (Chan et al., Citation2020; Dhirasasna et al., Citation2020). Enhanced energy intensity, however, remains a promising avenue for emissions mitigation (Yang et al., Citation2019). Overall, energy efficiency improvements are found to offset approximately 50% of the additional energy required to satisfy the net increase in tourism demand.
Energy structure
Changing the energy structure by replacing fossil fuels with low-carbon energy sources, such as renewables, is also effective in reducing carbon emissions. However, limited progress is reported in energy transformation, with most destinations still highly reliant on fossil fuels. Examples include: in Spain, the high dependence on gasoline; in Portugal, the shift from low-carbon energy sources (e.g. gas) to higher emitting fuels (e.g. coal or oil) for electricity production; and in Australia, the use of raw coal for electricity generation. The slow progress on energy transformation highlights significant social, economic and political barriers in adopting renewables (Cadarso et al., Citation2016; Moutinho et al., Citation2015; Yu et al., Citation2019).
The supply chain
The tourism supply chain refers to the amount and type of inputs used by firms. The impacts of the supply chains on overall emissions are found to be mixed across destinations (). Several cases reported that indirect emissions grew faster than direct emissions. This may have been due to, for example, China’s use of carbon intense intermediate products, such as food and metals (Meng et al., Citation2016; Xia et al., Citation2022; Zha et al., Citation2021); whereas in Spain, reliance on foreign producers led to an increase in emissions due to transportation to accommodate the higher domestic demand for their products (Cadarso et al., Citation2015). In contrast, New Zealand and Norway both reduced their emissions by substituting imported goods with locally made materials (Sun et al., Citation2022; Sun & Higham, Citation2021). With today’s rising globalization and international trade, firms can make positive changes in this area; there are more diverse choices accessible to them than were previously available, such as collaboration with other suppliers to locate products and services with a lower intensity of environmental pollution (Sun, Citation2019).
Destination management attributes
Tourism carbon emissions are also influenced by unique destination management attributes, reflecting dynamic interactions between the supply and demand forces. Destination factors may include: (1) location and spatial structure; (2) capital investment in infrastructure; and (3) market mix.
Location and spatial structure
Destinations’ locations and spatial structures directly influence their tourists’ possible choices of transport, especially regarding aviation. Island destinations have a high reliance on air travel, with flight emissions accounting for a significant percentage of their total emissions, reported as: 38% in Taiwan (Sun, Citation2016), 53% in New Zealand (Sun & Higham, Citation2021), 54% in the Canary Islands (Antequera et al., Citation2021), and 50 − 82% in Iceland (depending on the flight distance) (Sharp et al., Citation2016). While these examples may not be directly comparable due to variations in factors like geographic size, population density and inclusion of domestic tourism in emission calculations,Footnote2 they collectively indicate the magnitude of air travel related transport emissions in island destinations.
Sub-national tourism destinations, such as remote locations, also rely heavily on aviation due to their distance from urban centres and transport hubs (e.g. Tang & Huang, Citation2021). For example, emissions per tourist in Hainan, an island province of China, were higher than those for major cities (such as Beijing, Shandong, Zhejiang, and Hubei), mainly due to tourists being required to travel by air (Wu et al., Citation2015). Similarly, the locations of far-apart domestic destinations across Australia lead to significant emissions from domestic air transport and self-drive activities (Pham et al., Citation2022). Spatial structure, which is a proxy for the proportion of sub-regional tourism revenue to the total tourism revenue, highlights the high carbon risk for remote destinations (Chen et al., Citation2018; Pham et al., Citation2022). However, most locations and spatial attributes are difficult to alter.
Capital investment in infrastructure
While people cannot change location and physical characteristics, destinations often leverage capital investment in infrastructures to transform their images and accessibility. Through capital investment, the composition of tourism subsectors and the type of available infrastructures, facilities, and attraction types are modified. These supply components subsequently influence: (1) the markets, as defined by distance and transport mode; (2) the individual tourists’ consumption choices during their holidays; and (3) the number of tourists the destination attracts—all are key factors in determining the destination’s total emissions.
Studies have observed that the total emissions per person increase if a region obtains big investments in energy-intensive infrastructures, such as high-end hotels, tourism complexes, and amusement parks with motorized recreational services (Tsai et al., Citation2014; Wu et al., Citation2015; Zha et al., Citation2019). On the contrary, investment in electrification of land transport, such as high-speed rail, instead of new regional airports, provides a feasible substitute for flights and, consequently, reduces emissions per capita (Filimonau et al., Citation2014).
Infrastructure, especially transport, is a critical factor that influences total visitor numbers. Investments in high-speed rail, regional airports, and low-cost carriers are found to stimulate new waves of tourism demand (Chen & Haynes, Citation2015; Pagliara et al., Citation2015; Zha et al., Citation2020, Citation2021). This has been especially evident in China, where the rapid development of transportation (high-speed rail, roads and airports) and investment in entertainment facilities are the main reasons for total tourism emission increases (Ma et al., Citation2021).
Overall, capital investment can serve as a positive or negative force for tourism emissions, depending on its magnitude and how the capital is invested. We find that capital investments contributed to increased emissions in six case studies but helped to mitigate emissions in the other seven.
Market mix
The last factor, market mix, relates to how the composition of individual visitor segments can influence carbon emissions. Each visitor segment has a unique emissions profile due to variation in length of stay, transportation mode, visitor activities, and the level of luxury involved (Sun et al., Citation2020). Optimizing the demand mix of markets to prioritize low-carbon markets provides the potential to stabilize and reduce tourism carbon emissions without jeopardizing tourism economic yields. Gössling et al. (Citation2015) showed that substituting 5% of inbound UK tourists with Chinese tourists would reduce associated emissions for New Zealand by 6%. Sun et al. (Citation2020) demonstrated that by developing nearby destinations and discouraging certain long-haul segments, a 5% reduction in emissions and a 2% gain in emissions intensity per visitor (lower emissions per visitor) was achievable for Taiwan. Conversely, a lack of proactive intervention in the market mix can lead to a disproportional increase in high-carbon segments, as seen with business travel in Norway, inbound tourists in Beijing, and international visitors to Australia.
Overall effect
gives the annual percent of emission change (with + indicating emissions growth and—indicating emissions mitigation) for each factor based on studies that employed the decomposition analysis. Assuming all other factors are held constant, the numbers in indicate how much emissions will be changed per year by modifying one factor.
Table 2. Percent of emissions increase/reduction for each factor per year.
We see that scale growth and expenditure size have a significantly greater impact on emissions growth than the combined influence of supply factors and destination factors, and, thus, the overall result is a continuing growth in emissions. Technology factors (energy intensity, energy structure, and supply chain) remain the primary mechanism for emissions mitigation, with an emission saving rate of 1–6% per annum. Destination factors are frequently omitted in analyses, and their effects remain unknown, even though great mitigation potential exists. Overall, the empirical findings shown in highlight the incompatibility of excessive growth in tourism demand and decarbonization in this sector (Becken, Citation2019; Loehr & Becken, Citation2021; Scott & Gössling, Citation2021).
Mapping of the DMOs’ influence against the decarbonization factors
DMOs are confronted with various levels of resources and processes in the lead-up to low carbon transitions, and this determines their level of influence on each of the macro-level decarbonization factors. In the next, we first classify their level of influence into high, medium and low/limited categories, and then discuss the current DMOs decarbonization plan and strategies.
DMOs’ influence
High influence
Under the maximum influence, DMOs have direct control and managerial responsibility for resources and processes in forging effective decarbonization progress. This context applies to their commitment to “optimizing market mix” ().
Table 3. DMOs’ potential influence over decarbonization factors.
To optimize the market mix, DMOs have the full capacity to pull resources together to carry out the image-making, branding, communication, marketing and demarketing initiatives required to reconfigure the market mix (Crouch & Ritchie, Citation1999; Gössling et al., Citation2015). Armed with a tourism carbon emission inventory and economic metrics ($/CO2), DMOs have critical knowledge for each visitor segment on their carbon emissions profiles and expenditure. This knowledge assists them to develop an optimum market mix that targets “high-yield, low emissions” segments and offer low disruptive mitigation strategies for the community and businesses (Gössling & Higham, Citation2021).
Moderate influence
Among the nine factors, DMOs may exercise moderate influence when they play a direct role in resources but are not the main stakeholders implementing the processes. This is the context for energy intensity (supply factor), capital investment (destination factor), consumption structure, scale growth and expenditure size (demand factors).
To reduce energy consumption from tourism production, DMOs gear their decarbonization priorities by providing information, guidelines, consultations, calculators and funding to tourism firms to help them improve their energy efficiency. In addition, DMOs may also have moderate influence on capital investment in infrastructure development by advising the process. DMOs can influence decisions on major transport and connectivity projects by bringing relevant stakeholders together and collaborating with governments (Carter et al., Citation2023; WTTC, Citation2019b). Depending on the local governance structure, DMOs may advise an authority, such as a Ministry of Transport, on regional, multimodal transport needs or on reconsidering airline routes. They can also exert influences through responsible lobbying, whereby an organization’s lobbying efforts are in congruence with their responsibilities towards society, e.g. the shifting away from the continued expansion of airports (Bauer, Citation2014; Tourism Panel on Climate Change [TPPC], 2023).
From the demand side, DMOs have a moderate influence on driving visitor consumption changes toward low-carbon services/goods and engaging with a degrowth strategy to limit excessive visitor expansion. Both can be achieved either directly, through marketing tactics and visitor information, such as nudging, communication, and carbon labelling, or indirectly, through influencing the long-term development of quality accommodation, services and activities on offer, and the markets being attracted (Gössling & Higham, Citation2021).
Several DMOs have proactive strategies in place to control visitor numbers: Palau identifies visitor-to-resident ratio thresholds, beyond which tourism may no longer be sustainable (Becken et al., Citation2020); France is capping tourism numbers at popular locations, and Polynesia, Bali, Barcelona, Amsterdam and South Tyrol are considering the same; other destinations, such as the Balearic Islands, have capped the number of hotel beds and Airbnb properties (TPPC, Citation2023). These examples show that DMOs are well positioned to determine a sustainable growth rate by setting thresholds for tourism growth in carbon-intensive markets (e.g. long-haul destinations), promoting low-carbon markets (e.g. domestic tourism), developing strategies for low-volume, high-spending tourists, or pressuring policymakers to adopt market-based measures such as a departure tax (Becken et al., Citation2020).
Minimal to no influence
We consider that DMOs have minimal to no influence over three factors: the energy structure, the supply chain, and the location and spatial structure. These factors are largely determined by non-tourism stakeholders and influenced by the context. It is arguable that no single DMO can effectively address these areas alone due to a lack of resources and their limited managerial role in the process of determining these high-level factors. In the example of managing supply chain emissions, businesses are confronted with challenges in calculating and mapping the largest emission sources (Blanco et al., Citation2016). Additionally, the availability of low-carbon input products for firms is largely determined by macroeconomic factors, such as the local energy mix, international trade, and border tax policies (Sun, Citation2019; Wood, 2008). A similar challenge exists for DMOs to mobilize large-scale changes in energy structure. Such changes would require an economy-wide transition from a coal-reliant to a renewable-dominant society.
Overall, DMOs’ control on the nine decarbonization factors remains moderate (). Many aspects of destination decarbonization lie outside the direct control of DMOs. These actions rely on private stakeholders, public authorities, or consumers. Thus, DMOs are constrained by having limited control over the resources or having only an indirect influence on the processes required for decarbonization.
Table 4. DMOs’ decarbonization actions.
DMOs decarbonization strategies
Pledges and plans differ in scope. Pledges outline the general direction for a net zero transition, while plans provide a detailed, comprehensive, and workable list of actions to implement. This distinction is evident as 64% of pledges do not address any decarbonization factors, with only a few covering energy intensity or consumption structure (see ). In contrast, most DMOs’ climate action plans are much more detailed. They encompass at least one demand factor (60%, mostly relating to consumption structure), two supply factors (66%, primarily energy intensity and supply chain), and a few focus on destination management attributes (27%).
Both pledges and plans include various supporting actions for decarbonization via strategic destination planning, monitoring and evaluation. Most DMOs echo aspirational values on a “just transition” and “systemic change” (n = 15 of the 28 DMOs), share information, best practices and resources (n = 17), provide capacity building (n = 9), or facilitate financing (n = 9). They “advocate for decarbonizing tourism.” These supporting actions do not directly affect carbon emissions, but they create the necessary conditions to enable a transition to a net-zero tourism sector (UNWTO, Citation2024). Arguably, becoming signatories to industry declarations strengthens the leadership role of DMOs in the carbon transition, as has been shown to be the case in other fields (Koessler, Citation2022).
Within the Glasgow Declaration, there are five foundational pathways that signatories agree to. One of those is “measure.” Regarding climate action plans, six DMOs have measured their destinations’ tourism carbon footprint baselinesFootnote3 and three commit to calculating it in the future. Six had planned to provide a carbon calculator for tourism businesses. Results indicate limited emissions measurement (21%), reflecting that destinations struggle more than individual companies with this task (TPPC, Citation2023). Yet, without emission measurements, tracking decarbonization goals becomes impossible, leading to concerns about the credibility of decarbonization claims (Gössling & Lyle, Citation2021) and increasing the risk of greenwashing.
Out of the 15 plans, all DMOs’ focus on at least one supply factor, with a strong emphasis on improving firms’ energy intensity (n = 14) and focusing on the supply chain (n = 13) as an important mechanism for reducing emissions (). In this direction, DMOs place their priorities by providing information, guidelines, consultations, calculators and funding (less often) to tourism firms to help them improve their energy intensity (n = 11). These actions reflect advocacy and industry communication as an enabling function of DMOs (Carter et al., Citation2023). For instance, Promotur Turismo Canarias provides each tourism subsector with a comprehensive catalogue of decarbonization measures and estimated emissions savings. A small set of DMOs (n = 3), choose to leverage financial mechanisms to motivate firms to take climate actions, for example, including carbon criteria in their funding schemes (Promotur Turismo Canarias).
Similar to the enthusiasm for promoting energy efficiency, DMOs proactively address emissions from the supply chain (n = 13). Greening the supply chain often focuses on a firm’s adoption of circular economy practices (e.g. Tourism Vancouver), developing net zero products and itineraries (e.g. Stichting Merk Fryslân), or establishing an event policy for their own DMO with carbon criteria (e.g. Glasgow Convention Bureau). In contrast, efforts to green the destination’s energy structure are limited (n = 2).
Targeting demand-side initiatives in decarbonization through initiatives to change the consumption structure is also common (n = 14). DMOs commit to promotional campaigns that encourage green consumption, including preferential promotion of public transport (Visit Gloucestershire), consumption of local products (Visit Scotland), understanding consumption habits and carbon costs (West Sweden Tourist Board) and stimulating low-carbon behaviour change (low-carbon as standard choice—Netherlands Board of Tourism and Conventions or visitor pledges—Thompson Okanagan). Around a quarter of the DMOs have plans to accelerate improvements in tourism expenditure size (increase length of stay—Visit Porvoo) and none of the DMOs consider a sustainable growth rate in their decarbonization strategies.
Regarding destination management attributes, efforts focus on greening the tourism infrastructure (n = 10) by partnering for green transport (pilot low carbon transport options—Visit Valencia, or support development of electric vehicle car rentals—Oregon Coast Visitor Association), promoting infrastructure renovations and including providing subsidies for low-carbon infrastructure transformation (Netherlands Board of Tourism and Conventions). Less often DMO have plans to change the market mix (n = 5), by targeting visitor segments based on their carbon emissions profiles and developing an emissions-sensitive marketing strategy for domestic and neighbouring markets.
The overall mapping of climate action plans
Combining the influence of the decarbonization factors () with the current DMOs’ climate action plans () allows us to identify the areas where DMOs focus most and their levels of influence. We found that most DMOs have not fully utilized the full spectrum of climate strategies, even for factors over which they have the most control (). Most DMOs centered their climate actions on reducing energy use among tourism firms (n = 14) and within the tourism supply chain (n = 13). Another focus area is inspiring tourists to switch to green products and services (n = 14). However, these policies are outside the DMOs’ control and depend largely on the actions of tourism firms and travelers.
Figure 1. Number of DMOs with strategies on each mitigation factor in their climate action plans.
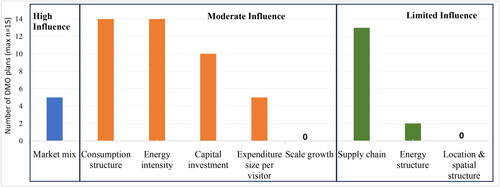
In contrast, 33% of DMOs (n = 5) have considered leveraging their marketing, promotions, positioning, and branding resources to identify optimum market mixes in their decarbonization strategies. Several DMOs attempt to encourage the extended length of stay to adjust the spending per day but, arguably, this provides little effect to reduce the overall trip emissions. In terms of addressing the growth in tourism numbers, none of the DMOs consider a sustainable growth rate in their decarbonization strategies, despite the fact that tourism growth is the direct cause of a rising trend of tourism emissions.
Conclusion
To date, destinations have difficulties decreasing their tourism carbon emissions. This fact raises significant concern about the tourism sector’s ability to decarbonize and the feasibility of existing pledges and plans. Our study contributes to the literature by systematically identifying nine macro level decarbonization factors, offering a framework for DMOs to strategize their climate action initiatives. We then reveal the current progress of DMOs commitment to the net-zero transitions by showing the proportion of DMOs that commit and their decarbonization plans put forward, against these nine factors.
We found public commitments remain rare among existing DMOs given that less than 2% of the global 2400 DMOs are committed to net-zero pledges in the Tourism Declares initiative and the Glasgow Declaration (dmcfinder, Citation2024). Among those who have committed, our analysis shows that both DMOs’ pledges and plans provide limited evidence of altering the growth trajectory of the tourism sector’s emissions, given the restrictive scope of the carbon actions put forward.
Energy efficiency and supply chains are the primary focus of the DMOs’ climate agendas. However, relying on technology to achieve the net-zero pathway is insufficient as this factor, at best, can only offset half of the additional emissions arising from the growth in tourism demand (Sun et al., Citation2022; Sun & Higham, Citation2021). Without the authority to issue fiscal and regulatory measures, DMOs may only have medium control over the collective energy efficiency improvement at a destination and, thus, it is risky to be overdependent on it. Similarly, focusing efforts solely on advising travellers about low-carbon products and services is risky, given that the macro-level consumption structure remains largely stable, and this approach has a minimal effect (less than 2%) in mitigating the overall tourism footprint (see ). Therefore, using these three factors alone is insufficient to drive change at the levels required by the pledges (7.6% emissions reduction per annum) to reach net-zero goals (UNEP, Citation2019).
Our mapping also shows untapped opportunities around market mix and scale growth in the current DMOs’ action plans. Only one third of DMOs have considered leveraging their marketing resources to identify optimum market mixes. Clear evidence exists that a destination can shift toward a low-carbon status by developing their domestic markets (Becken et al., Citation2020) or geographically close markets (Gössling et al., Citation2015, Citation2024), favouring revenue optimization over growth in arrivals (Oklevik et al., Citation2019), and demarketing long-haul, high-carbon markets (Gössling & Higham, Citation2021).
Additionally, no DMOs have considered engaging with a volume-control strategy for carbon management. They overlook the potential of a sustainable growth rate (Keyßer & Lenzen, Citation2021). Essentially, managing tourism growth equates to managing carbon emissions. Without commitments to control excessive growth, it is unlikely that DMOs can successfully lead the net-zero transition because strong demand alone can outpace all energy savings from the rest of the decarbonization factors. The hesitation to adopt a volume control strategy may suggest that DMOs perceive conflicts between their existing missions of maintaining economic prosperity and sustainability, as well as viewing carbon footprints as a threat (Torres-Delgado et al., Citation2024).
The other dimension that DMOs exert leadership is through public-public and public-private collaboration in influencing changes in capital investment, which will have trickle-down effects on the long-term expenditure size, consumption structure, and market mix. DMOs, as central actors in the network of stakeholders in destinations (Volgger & Pechlaner, 2014), can have a leading role in leveraging their advocacy and lobbying powers for climate governance.
Pledging to a net-zero goal is a commitment and a responsibility. The accountability of DMOs in achieving this goal remains largely insufficient based on two patterns observed. First, most declared DMOs (80%) lack a carbon footprint inventory from which to measure and monitor changes in emissions over time, echoing the problem with the Glasgow Declaration’s pledges earlier raised by Scott and Gössling (Citation2021). Without such a baseline, it is impossible to track and determine the effectiveness of an organisation’s response to climate change. Second, while a pledged DMO must publish a climate action plan within a year of pledging, this process is only honoured by half of the DMOs (54%). This implies some agencies struggle or hesitate to lay out a transparent, actionable, and measurable decarbonization plan and thus cast doubts on their credibility of commitments.
“To reduce emissions, it is necessary to assign responsibilities” (Gössling et al., Citation2023, p. 8). We agree and suggest that a set of boundaries of responsibility for DMOs in climate mitigation is necessary. We propose that DMOs can assume four broad decarbonization responsibilities in the net-zero transitions, including
Decarbonizing as an organization;
Strategizing and policymaking for the net-zero transition (scale growth), supporting tourism firms in reducing their carbon footprints (energy efficiency, supply chain);
Coordinating with and lobbying national and regional government and private industry for large-scale policy changes (energy structure, capital investment, spatial structure); and
Marketing, informing and advocating for consumers to lower emissions, and developing low-carbon products and experiences (expenditure size, consumption structure, market mix).
By exerting their leadership and claiming responsibilities across these four dimensions, it offers a starting point to achieve and maintain carbon neutrality for the destination.
Mireia Guix is a lecturer in tourism at the UQ Business School, The University of Queensland. She has consulted on projects for United Nations Environmental Programme, the Inter-American Development Bank, the European Commission, and national tourism government agencies. Her research focuses on sustainability accounting and corporate social responsibility for the tourism industry.
Nazila Babakhani is a Postdoctoral Research Fellow at The University of Queensland. Nazila holds a Bachelor’s degree in Mining Engineering and a Master’s degree in Business Administration (Marketing). Nazila’s research interests are sustainable tourism and tourism marketing.
Ya-Yen Sun is an Associate Professor at the University of Queensland, Australia. Her interest is to understand tourism economic impacts and tourism environmental impacts at the macro level.
Disclosure statement
No potential conflict of interest was reported by the author(s).
Notes
1 No market can isolate the interaction between demand and supply. Every change in demand (e.g. a preference for luxury hotels) leads to responses from businesses (e.g. more luxury hotels being built), and vice versa. Thus, any decarbonization strategy that focuses solely on either demand or supply will have a ripple effect on the other.
2 For example, in Taiwan and New Zealand, air transport emissions include those produced by airlines registered in the country for operating both domestic and international routes. For the Canary Islands and Iceland, air transport emissions only include emissions produced from international routes.
3 Visit Scotland, Visit Porvoo, Tourism Vancouver, Promotour Turismo Canarias, Netherlands Board of Tourism and Conventions, Visit Valencia.
References
- Antequera, P. D., Pacheco, J. D., Díez, A. L., & Herrera, C. B. (2021). Tourism, transport and climate change: The carbon footprint of international air traffic on Islands. Sustainability, 13(4), 1795.
- Bauer, T. (2014). Responsible lobbying: A multidimensional model. Journal of Corporate Citizenship, 2014(53), 61–76. https://doi.org/10.9774/GLEAF.4700.2014.ma.00006
- Becken, S. (2019). Decarbonising tourism: Mission impossible? Tourism Recreation Research, 44(4), 419–433. https://doi.org/10.1080/02508281.2019.1598042
- Becken, S., Whittlesea, E., Loehr, J., & Scott, D. (2020). Tourism and climate change: Evaluating the extent of policy integration. Journal of Sustainable Tourism, 28(10), 1603–1624. https://doi.org/10.1080/09669582.2020.1745217
- Bhandari, K., Cooper, C., & Ruhanen, L. (2016). Climate change knowledge and organizational adaptation: A destination management organization case study. Tourism Recreation Research, 41(1), 60–68. https://doi.org/10.1080/02508281.2016.1119972
- Blanco, C., Caro, F., & Corbett, C. J. (2016). The state of supply chain carbon footprinting: analysis of CDP disclosures by US firms. Journal of Cleaner Production, 135(C), 1189–1197.
- Cadarso, M.-Á., Gómez, N., López, L.-A., Tobarra, M.-Á., & Zafrilla, J.-E. (2015). Quantifying Spanish tourism’s carbon footprint: The contributions of residents and visitors: A longitudinal study. Journal of Sustainable Tourism, 23(6), 922–946. https://doi.org/10.1080/09669582.2015.1008497
- Cadarso, M. Á., Gómez, N., López, L. A., & Tobarra, M. Á. (2016). Calculating tourism’s carbon footprint: Measuring the impact of investments. Journal of Cleaner Production, 111(B), 529–537. https://doi.org/10.1016/j.jclepro.2014.09.019
- Carter, M. R., Nevill, H. L. T., Ward-Perkins, D., & Connolly, G. (2023).). Destination Management Handbook: A Guide to the Planning and Implementation of Destination Management.
- Chan, E. S., Okumus, F., & Chan, W. (2020). What hinders hotels’ adoption of environmental technologies: A quantitative study. International Journal of Hospitality Management, 84, 102324. https://doi.org/10.1016/j.ijhm.2019.102324
- Chen, L., Thapa, B., & Yan, W. (2018). The relationship between tourism, carbon dioxide emissions, and economic growth in the Yangtze River Delta, China. Sustainability, 10(7), 2118. https://doi.org/10.3390/su10072118
- Chen, Z., & Haynes, K. E. (2015). Impact of high-speed rail on international tourism demand in China. Applied Economics Letters, 22(1), 57–60. https://doi.org/10.1080/13504851.2014.925043
- Conefrey, A., & Hanrahan, J. (2022). Comparative analysis of national tourism decarbonisation plans. European Journal of Tourism Research, 31, 3105–3105. https://doi.org/10.54055/ejtr.v31i.1979
- Crouch, G. I., & Ritchie, J. B. (1999). Tourism, competitiveness, and societal prosperity. Journal of Business Research, 44(3), 137–152. https://doi.org/10.1016/S0148-2963(97)00196-3
- Dhirasasna, N., Becken, S., & Sahin, O. (2020). A systems approach to examining the drivers and barriers of renewable energy technology adoption in the hotel sector in Queensland, Australia. Journal of Hospitality and Tourism Management, 42, 153–172. https://doi.org/10.1016/j.jhtm.2020.01.001
- dmcfinder. (2024). How Many DMOs Are There. DMC Finder. Retrieved April 30, 2024 from https://www.dmcfinder.com/how-many-dmos-are-there/
- Eijgelaar, E., Peeters, P., de Bruijn, K., & Dirven, R. (2017). Travelling Large in 2016: The Carbon Footprint of Dutch Holidaymakers in 2016 and the Development since 2002.
- Filimonau, V., Dickinson, J., & Robbins, D. (2014). The carbon impact of short-haul tourism: A case study of UK travel to Southern France using life cycle analysis. Journal of Cleaner Production, 64, 628–638. https://doi.org/10.1016/j.jclepro.2013.07.052
- Filimonau, V., Dickinson, J., Robbins, D., & Huijbregts, M. A. (2011). Reviewing the carbon footprint analysis of hotels: Life Cycle Energy Analysis (LCEA) as a holistic method for carbon impact appraisal of tourist accommodation. Journal of Cleaner Production, 19(17-18), 1917–1930. https://doi.org/10.1016/j.jclepro.2011.07.002
- Gössling, S., Balas, M., Mayer, M., & Sun, Y.-Y. (2023). A review of tourism and climate change mitigation: The scales, scopes, stakeholders and strategies of carbon management. Tourism Management, 95, 104681. https://doi.org/10.1016/j.tourman.2022.104681
- Gössling, S., & Higham, J. (2021). The low-carbon imperative: Destination management under urgent climate change. Journal of Travel Research, 60(6), 1167–1179. https://doi.org/10.1177/0047287520933679
- Gössling, S., & Lyle, C. (2021). Transition policies for climatically sustainable aviation. Transport Reviews, 41(5), 643–658. https://doi.org/10.1080/01441647.2021.1938284
- Gössling, S., Scott, D., & Hall, C. M. (2015). Inter-market variability in CO2 emission-intensities in tourism: Implications for destination marketing and carbon management. Tourism Management, 46, 203–212. https://doi.org/10.1016/j.tourman.2014.06.021
- Gössling, S., Vogler, R., Humpe, A., & Chen, N. (. (2024). National tourism organizations and climate change. Tourism Geographies, 1–22. https://doi.org/10.1080/14616688.2024.2332368
- Grant, R. M. (2021). Contemporary strategy analysis. John Wiley & Sons.
- Guix, M., & Petry, T. (2023). CSR managers as hybrid professionals: Managing at the intersection of coexisting logics. Journal of Sustainable Tourism, 1–23. https://doi.org/10.1080/09669582.2023.2246702
- Huang, T., & Tang, Z. (2021). Estimation of tourism carbon footprint and carbon capacity. International Journal of Low-Carbon Technologies, 16(3), 1040–1046. https://doi.org/10.1093/ijlct/ctab026
- ICAO. (2018). API Data Service,
- IPCC. (2018). Global Warming of 1.5 °C. An IPCC Special Report on the Impacts of Global Warming of 1.5 °C above Pre-Industrial Levels and Related Global Greenhouse Gas Emission Pathways, in the Context of Strengthening the Global Response to the Threat of Climate Change, Sustainable Development, and Efforts to Eradicate Poverty, https://doi.org/10.1017/9781009157940.001
- Keyßer, L. T., & Lenzen, M. (2021). 1.5 degrees C degrowth scenarios suggest the need for new mitigation pathways. Nature Communications, 12(1), 2676. https://doi.org/10.1038/s41467-021-22884-9
- Koessler, A.-K. (2022). Pledges and how social influence shapes their effectiveness. Journal of Behavioral and Experimental Economics, 98, 101848. https://doi.org/10.1016/j.socec.2022.101848
- Larsson, J., Kamb, A., Nässén, J., & Åkerman, J. (2018). Measuring greenhouse gas emissions from international air travel of a country’s residents methodological development and application for Sweden. Environmental Impact Assessment Review, 72, 137–144. https://doi.org/10.1016/j.eiar.2018.05.013
- Lenzen, M., Sun, Y.-Y., Faturay, F., Ting, Y.-P., Geschke, A., & Malik, A. (2018). The carbon footprint of global tourism. Nature Climate Change, 8(6), 522–528. https://doi.org/10.1038/s41558-018-0141-x
- Liu, J., Feng, T., & Yang, X. (2011). The energy requirements and carbon dioxide emissions of tourism industry of Western China: A case of Chengdu city. Renewable and Sustainable Energy Reviews, 15(6), 2887–2894. https://doi.org/10.1016/j.rser.2011.02.029
- Loehr, J., & Becken, S. (2021). The tourism climate change knowledge system. Annals of Tourism Research, 86, 103073. https://doi.org/10.1016/j.annals.2020.103073
- Ma, H., Liu, J., & Xi, J. (2022). Decoupling and decomposition analysis of carbon emissions in Beijing’s tourism traffic. Environment, Development and Sustainability, 24(4), 5258–5274. https://doi.org/10.1007/s10668-021-01657-w
- Ma, X., Han, M., Luo, J., Song, Y., Chen, R., & Sun, X. (2021). The empirical decomposition and peak path of China’s tourism carbon emissions. Environmental Science and Pollution Research International, 28(46), 66448–66463. https://doi.org/10.1007/s11356-021-14956-6
- Meng, W., Xu, L., Hu, B., Zhou, J., & Wang, Z. (2016). Quantifying direct and indirect carbon dioxide emissions of the Chinese tourism industry. Journal of Cleaner Production, 126, 586–594. https://doi.org/10.1016/j.jclepro.2016.03.067
- Moutinho, V., Costa, C., & Bento, J. P. C. (2015). The impact of energy efficiency and economic productivity on CO2 emission intensity in Portuguese tourism industries. Tourism Management Perspectives, 16, 217–227. https://doi.org/10.1016/j.tmp.2015.07.009
- Oklevik, O., Gössling, S., Hall, C. M., Steen Jacobsen, J. K., Grøtte, I. P., & McCabe, S. (2019). Overtourism, optimisation, and destination performance indicators: A case study of activities in Fjord Norway. Journal of Sustainable Tourism, 27(12), 1804–1824. https://doi.org/10.1080/09669582.2018.1533020
- One Planet Network. (2021). Glasgow Declaration: A Commitment to a Decade of Climate Action,
- Pagliara, F., La Pietra, A., Gomez, J., & Vassallo, J. M. (2015). High Speed Rail and the tourism market: Evidence from the Madrid case study. Transport Policy, 37, 187–194. https://doi.org/10.1016/j.tranpol.2014.10.015
- Peeters, P., & Landré, M. (2011). The emerging global tourism geography—An environmental sustainability perspective. Sustainability, 4(1), 42–71. https://doi.org/10.3390/su4010042
- Pham, T., Meng, X., & Becken, S. (2022). Measuring tourism emissions at destination level: Australia case. Annals of Tourism Research Empirical Insights, 3(2), 100062. https://doi.org/10.1016/j.annale.2022.100062
- Robaina-Alves, M., Moutinho, V., & Costa, R. (2016). Change in energy-related CO2 (carbon dioxide) emissions in Portuguese tourism: A decomposition analysis from 2000 to 2008. Journal of Cleaner Production, 111, 520–528. https://doi.org/10.1016/j.jclepro.2015.03.023
- Sainaghi, R. (2006). From contents to processes: Versus a dynamic destination management model (DDMM). Tourism Management, 27(5), 1053–1063. https://doi.org/10.1016/j.tourman.2005.09.010
- Scott, D., & Gössling, S. (2021). From Djerba to Glasgow: Have declarations on tourism and climate change brought us any closer to meaningful climate action? Journal of Sustainable Tourism, 30(1), 199–222. https://doi.org/10.1080/09669582.2021.2009488
- Sharp, H., Grundius, J., & Heinonen, J. (2016). Carbon footprint of inbound tourism to Iceland: A consumption-based life-cycle assessment including direct and indirect emissions. Sustainability, 8(11), 1147. https://doi.org/10.3390/su8111147
- Shi, Y., & Yu, M. (2021). Assessing the environmental impact and cost of the tourism-induced CO2, NOx, SOx emission in China. Sustainability, 13(2), 604. https://doi.org/10.3390/su13020604
- Sun, Y.-Y. (2016). Decomposition of tourism greenhouse gas emissions: Revealing the dynamics between tourism economic growth, technological efficiency, and carbon emissions. Tourism Management, 55, 326–336. https://doi.org/10.1016/j.tourman.2016.02.014
- Sun, Y.-Y. (2019). Global value chains and national tourism carbon competitiveness. Journal of Travel Research, 58(5), 808–823. https://doi.org/10.1177/0047287518781072
- Sun, Y.-Y., Gössling, S., Hem, L. E., Iversen, N. M., Walnum, H. J., Scott, D., & Oklevik, O. (2022). Can Norway become a net-zero economy under scenarios of tourism growth? Journal of Cleaner Production, 363, 132414. https://doi.org/10.1016/j.jclepro.2022.132414
- Sun, Y.-Y., & Higham, J. (2021). Overcoming information asymmetry in tourism carbon management: The application of a new reporting architecture to Aotearoa New Zealand. Tourism Management, 83, 104231. https://doi.org/10.1016/j.tourman.2020.104231
- Sun, Y.-Y., Lin, P.-C., & Higham, J. (2020). Managing tourism emissions through optimizing the tourism demand mix: Concept and analysis. Tourism Management, 81, 104161. https://doi.org/10.1016/j.tourman.2020.104161
- Tang, C., Zhong, L., & Ng, P. (2017). Factors that influence the tourism industry’s carbon emissions: A tourism area life cycle model perspective. Energy Policy, 109, 704–718. https://doi.org/10.1016/j.enpol.2017.07.050
- Tang, Z., Bai, S., Shi, C., Liu, L., & Li, X. (2018). Tourism-related CO2 emission and its decoupling effects in China: A spatiotemporal perspective. Advances in Meteorology, 2018, 1–9. https://doi.org/10.1155/2018/1473184
- Tang, Z., & Huang, T. (2021). Carbon Dioxide Emission Measurement and Its Spatiotemporal Evolution of Tourism Industry in Heilongjiang Province, China. Advances in Meteorology, 2021, 1–10. https://doi.org/10.1155/2021/1458373
- Tang, Z., Shang, J., Shi, C., Liu, Z., & Bi, K. (2014). Decoupling indicators of CO2 emissions from the tourism industry in China: 1990–2012. Ecological Indicators, 46, 390–397. https://doi.org/10.1016/j.ecolind.2014.06.041
- Torres-Delgado, A., Font, X., & Oliver-Solà, J. (2024). Self-defence against carbon footprint evidence: How employees of destination management and marketing organisations cope with conflicting environmental and economic data. Annals of Tourism Research, 104, 103722. https://doi.org/10.1016/j.annals.2023.103722
- Tourism Declares. (2022). Tourism Declares a Climate Emergency. Tourism Declares,. Retrieved 20 December from https://www.tourismdeclares.com/who-has-declared
- Tourism Panel on Climate Change (TPPC). (2023). Tourism climate change stocktake 2023 (S. Becken & D. Scott, eds.). https://tpcc.info/
- Triandafil, A. A., Dinu, A. C., Puie, F., & Șerbănescu, A. (2022). Destination management organizations: A systematization of recent literature with a focus on new research trends. CACTUS, 3(2), 56–63. https://doi.org/10.24818/CTS/3/2021/2.06
- Tsai, K.-T., Lin, T.-P., Hwang, R.-L., & Huang, Y.-J. (2014). Carbon dioxide emissions generated by energy consumption of hotels and homestay facilities in Taiwan. Tourism Management, 42, 13–21. https://doi.org/10.1016/j.tourman.2013.08.017
- UN Environmental Programme (UNEP). (2019). Emissions gap report 2019. UN Environmental Programme.
- UN World Tourism Organization (UNWTO). (2019). UNWTO guidelines for institutional strengthening of Destination Management Organizations (DMOs)-Preparing DMOs for new challenges. UNWTO.
- UN World Tourism Organization (UNWTO). (2023). Climate action in the tourism sector – an overview of methodologies and tools to measure greenhouse gas emissions. UNWTO.
- UN World Tourism Organization (UNWTO). (2024). Policy guidance to support climate action by national tourism administrations. UNWTO.
- World Travel & Tourism Council (WTTC). (2021). A net zero roadmap for travel & tourism. proposing a new target framework for the travel & tourism sector. WTTC.
- World Travel & Tourism Council (WTTC). (2019a). Benchmarking travel & tourism. WTTC.
- World Travel & Tourism Council (WTTC). (2019b). Destination 2030: Global cities’readiness for tourism growth. WTTC.
- Wu, P., Han, Y., & Tian, M. (2015). The measurement and comparative study of carbon dioxide emissions from tourism in typical provinces in China. Acta Ecologica Sinica, 35(6), 184–190. https://doi.org/10.1016/j.chnaes.2015.09.004
- Xia, B., Dong, S., Li, Z., Zhao, M., Sun, D., Zhang, W., & Li, Y. (2022). Eco-efficiency and its drivers in tourism sectors with respect to carbon emissions from the supply chain: An integrated EEIO and DEA approach. International Journal of Environmental Research and Public Health, 19(11), 6951. https://doi.org/10.3390/ijerph19116951
- Xiong, G., Deng, J., & Ding, B. (2022). Characteristics, decoupling effect, and driving factors of regional tourism’s carbon emissions in China. Environmental Science and Pollution Research International, 29(31), 47082–47093. https://doi.org/10.1007/s11356-022-19054-9
- Yang, Y., Jia, J., Liu, C., & Mao, D. (2019). Decoupling and decomposition analysis on the CO2 emissions of tourism industry: A case study of Hainan. E3S Web of Conferences, 118, 04042. https://doi.org/10.1051/e3sconf/201911804042
- Yu, L., Bai, Y., & Liu, J. (2019). The dynamics of tourism’s carbon footprint in Beijing, China. Journal of Sustainable Tourism, 27(10), 1553–1571. https://doi.org/10.1080/09669582.2019.1648480
- Zha, J., Dai, J., Ma, S., Chen, Y., & Wang, X. (2021). How to decouple tourism growth from carbon emissions? A case study of Chengdu, China. Tourism Management Perspectives, 39, 100849. https://doi.org/10.1016/j.tmp.2021.100849
- Zha, J., Fan, R., Yao, Y., He, L., & Meng, Y. (2021). Framework for accounting for tourism carbon emissions in China: An industrial linkage perspective. Tourism Economics, 27(7), 1430–1460. https://doi.org/10.1177/1354816620924891
- Zha, J., He, L., Liu, Y., & Shao, Y. (2019). Evaluation on development efficiency of low-carbon tourism economy: A case study of Hubei Province, China. Socio-Economic Planning Sciences, 66, 47–57. https://doi.org/10.1016/j.seps.2018.07.003
- Zha, J., Tan, T., Yuan, W., Yang, X., & Zhu, Y. (2020). Decomposition analysis of tourism CO2 emissions for sustainable development: A case study of China. Sustainable Development, 28(1), 169–186. https://doi.org/10.1002/sd.1980