
Abstract
Human emissions must reach zero by 2050 to avoid dangerous climate change. Most sectors have achieved a downward path for their greenhouse gas emissions, but tourism’s emissions have continued to grow. We explore scenarios to reduce global tourism emissions and find only a narrow pathway to zero emissions tourism that could lead to net zero by 2050 while not severely damaging the tourism economy. Our study uses a system dynamics model. We describe the business-as-usual scenario, including its consequences for emissions and for tourism’s share of the remaining global carbon budgets if the world is to limit global temperature rise to 1.5 or 2 °C. We explore 45 possible policy approaches, like taxes and subsidies, infrastructure investments, off-sets, technology, behavioural changes, and sustainable aviation fuels. Key measures appear to be a mandate for e-fuel mixing up to 100% by 2050, and a multi-trillion USD investment in hydrogen-powered electric aircraft and high-speed rail infrastructure. We find that a limited renewable energy supply will constrain the growth of aviation if it is to be zero emissions in 2050. A risk-analysis explores the robustness of the policies. Finally, we discuss the consequences of the zero emissions tourism (ZET) scenario we propose.
Introduction
Kotz et al. (Citation2024) show that the cost of inevitable climate change between 2024 and 2050 will reduce the average income by 11–29% compared to a future without climate change. This is bad news for the travel and tourism industry because its growth is largely dependent on discretional income (see figure 1 in Peeters & Dubois, Citation2010). At the same time, tourism’s contribution to climate change was initially estimated at 5% of global emissions in 2005 (UNWTO-UNEP-WMO, Citation2008), 75% of which was generated by tourist transport. More recent work has revealed the total contribution of tourism to greenhouse gas emissions (GHG) to be ∼8% in 2013 (Lenzen et al., Citation2018). Tourism’s emissions are still increasing (Tourism Panel on Climate Change, Citation2023), yet global emissions must be reduced quickly to keep the temperature under 1.5 °C rise (IPCC, Citation2022).
The emissions per year reveal only part of the contribution to climate change. The temperature anomaly the world will face in the future depends on the total amount of accumulated CO2 in the atmosphere (Höhne et al., Citation2020; Tokarska & Gillett, Citation2018). The cumulative amount of carbon dioxide (CO2) emissions permitted over time to keep within a certain temperature threshold is known as the “carbon budget”. This carbon budget is a key parameter that determines the viability of human life within its optimal temperature range (Xu et al., Citation2020). For the tourism sector, we found that in a business-as-usual scenario, the accumulated emissions between 2015 and 2100 would consume 24–42% of the global carbon budget (see Section Including COVID-19 impacts).
Although aviation dominates tourism emissions, all other elements of tourism also need to reach zero emissions. An integrated description of the tourism system is essential to avoid excluding potential solutions for reduced international air travel across all segments of tourism, including domestic tourism, and solutions related to other transport modes. We seek to find a solution that avoids economic decline while enabling zero emissions by 2050. In 1992, the Kyoto Protocol (UNFCCC, Citation1998) shifted the responsibility for international aviation emissions from national governments to the International Civil Aviation Organisation (ICAO) (Lyle, Citation2018). To date, this political approach to managing international aviation’s emissions has not been successful in reducing them. Furthermore, while international emissions are the responsibility of ICAO, domestic aviation emissions are governed by the Paris-agreed Nationally Determined Contributions (NDCs), resulting in systemic inefficiencies in the various national and international approaches to mitigation.
The tourism sector is becoming aware of the situation and in 2021 over a thousand tourism companies and organisations signed the Glasgow Declaration (One Planet Network, Citation2021), committing to reduce emissions by 50% by 2030, and to net zero by 2050. We chose a baseline year of 2019 as suggested by Peeters and Papp (Citation2023). Current climate mitigation language is dominated by the term “net zero” scenarios, defined as scenarios in which “any residual emissions to the atmosphere from the use of fossil fuels are offset by negative emissions strategies” (Deangelo et al., Citation2021, p. 2). The effects and costs of these carbon sinks are highly uncertain (Rogelj et al., Citation2021), and negative emissions are challenged (Allen et al., Citation2022), unrealistic (Millar et al., Citation2017), and unnecessary when demand projections for certain products and services are no longer taken to be non-negotiable (Keyßer & Lenzen, Citation2021). The purpose of this paper is to deliver a long-term, global, “true zero” scenario containing the main building blocks of the tourism sector (its emissions, revenues, tourism trips, and guest-nights) in a fully integrated way to test a multitude of policies and measures. Our research questions are:
How would the tourism sector function under a true zero emissions climate mitigation scenario?
What would be the economic and social consequences of such a scenario?
The social consequences refer to the extent of opportunities to travel, in terms of trips and guest-nights. The economic consequences translate to global tourist spending comparable to a reference scenario. To answer these questions, we have developed a Zero Emissions Tourism (ZET) scenario. Mitigation studies require long-term scenarios (see Section Development of the zero emissions scenario). Therefore, we take a long-term systemic perspective (until 2100) and explore possible global tourism sector pathways to satisfy a true zero goal by 2050, and a 50% reduction by 2030 compared to 2019s emissions. Also, we assess the robustness of the policy measures on the share of the global 1.5 °C carbon budget that global tourism may consume. Robustness of measures is an important aspect of climate mitigation (Krey & Riahi, Citation2009) as robust measures are able to cope with different futures of growth and reduce the risk that the measure fails to deliver.
This paper describes in Section Methods the methods, including, the modelling [The global tourism transport model (GTTMdyn)] and [Modules and policies in GTTMdyn], the scale and scope (Scale, timescale, and scope), the “Reference Scenario” (Section Reference scenario) and the approach to scenario development (Development of the zero emissions scenario). Section Zero emissions tourism scenario presents the results for the ZET scenario. Finally, in Section Discussion and conclusion, we discuss policy and research recommendations, limitations to the study, and conclusions.
Methods
The global tourism transport model (GTTMdyn)
A description of the GTTMdyn was published in 2017 (Peeters, Citation2017). Supplementary File, Section 1.2 provides a copy of the full description of the original model. We chose to apply systems dynamics modelling (Sterman, Citation2000). System dynamics is compelling for long-term scenario development of highly complex systems with many feedback relationships (Lempert et al., Citation2003). The GTTMdyn was developed by the authors in 2017 to enable long-term (up to the year 2100) projections of the global tourism and transport system and to show the impacts of socio-economic and technical developments and of climate mitigation policies (Peeters, Citation2013, Citation2017). The GTTMdyn model is calibrated with historical data between 1900 and 2015 and models the tourism system up to 2100. This long-term view is necessary because earth’s climate system changes slowly and requires many decades to show consistent trends. Furthermore, the diffusion of new transport and energy technologies requires a long time for development and full penetration of the market (Grübler et al., Citation1999).
The model includes domestic and international overnight trips and describes tourism in terms of global guest-nights, trips, passenger-kms, CO2-emissions, revenues in tourism, taxes, subsidies, radiative forcing (an indicator responsible for the temperature anomaly), and a range of intermediate parameters like the global fleets of aircraft and cars, airport and high-speed-rail capacity, and energy and fuel-use. The GTTMdyn distinguishes sixty main tourism markets. These markets are defined as the combination of the three main transport modes (air, car, other) and twenty distance classes (from 50–100 km up to 13,700–18,000 km). Examples of such a market are all people traveling by car over a distance larger than 50 km, but <100 km (car/50–100 km segment). A geographical approach, describing all tourist flows between all countries in the world, is not adopted by the model because doing so would result in extreme complexity and a lack of detailed data.
The main drivers of the number of tourism trips are, first, the level and distribution of income (taken as GDP per capita) and, second, population growth. The tourist Length of Stay (LOS) per trip is an extrapolation of the historic trend, which shows an extremely slow, but consistent, decline. The distribution of trips over the twenty distance classes has complex relationships with income and income equality, population, energy costs, infrastructure capacity, and the cost and speed of transport modes. The modal split and distance are both complex functions of cost and travel time. Because the GTTMdyn does not include the entire geography of tourism, we need a variable that represents the attraction of people to travel long distances—pure utility theory would dictate that all tourists travel to the shortest distance markets (the cheapest and fastest to arrive at). The solution was to introduce the novel concept of the “value of distance”. This “value of distance variable” assumes that in a comparison of two destinations with equal characteristics except for distance from the tourist’s home, the destination with the longest distance is experienced as the most desirable destination.
The transport mode and distance class choice behaviour are based on product diffusion modelling (Bass, Citation2004) and prospect theory (Kahneman & Tversky, Citation1979). The Bass diffusion model was applied in the GTTMdyn because of the need to accommodate the emergence of “new” transport modes. The GTTMdyn runs from 1900 up to 2100 and thus had to accommodate the new air transport mode in the 1920s and space travel in the future. Emissions are calculated using generally accepted emission factors per guest-night and transport mode, both accounting for trend-wise technical developments. Technical improvements feed back into the cost through abatement costs (Nordhaus, Citation2008). Prospect theory poses that choices are made based on a reference value (cost, transport speed) and determined by all choice options available. In the GTTMdyn, these two reference values cause a myriad of feedback loops between the 60 tourism markets.
The GTTMdyn has a user-interface allowing to “play” it as a “serious game” (Van der Zee et al., Citation2012). Players, or “users”, of the GTTMdyn can choose from several global climate mitigation scenarios, consisting of logical combinations of a global emission pathway, energy efficiency developments and temperature rises. The policy input for the model consists of seven central policies: sustainable aviation fuels (10 measures), technological developments (13), infrastructure (4), taxes and subsidies (6), transport speed (4), behavioural assumptions (3) and off-sets (5), providing a total of 45 measures. Several of these measures require the user to set a timeline for their development. See Section 1.9 of the Supplementary File for a detailed overview of the policies and measures.
Scale, timescale, and scope
Scale and scope choices are crucial in studies of emission inventories (Gössling et al., Citation2023) and long-term scenarios (Schwartz, Citation1996). In this study, the scale and scope of the tourism system are global domestic, and international overnight trips for all purposes (leisure, business, and visiting friends and relatives). The scope includes emissions and revenues from accommodation and all transport between markets and destinations. Also included are the emissions connected to producing electricity for transport, alternative fuels, and destination services. However, the energy and emissions from producing fossil fuels are excluded. Further excluded are local transport and tourism activities at the destination, such as visiting attractions or shopping.
The timescale, the future period the scenario describes, is another essential choice in scenario modelling. Long-term scenario studies form the backbone of climate mitigation assessments (Meinshausen et al., Citation2011) and typically cover 50–100 years. In tourism, long-term scenarios are rare and often restricted to specific parts, or markets, of tourism (see Gössling & Scott, Citation2012). The few scenarios that cover decades are qualitative (for instance, Scott & Gössling, Citation2015; Yeoman, Citation2012) or only include parts of tourism, such as aviation (Åkerman, Citation2005), long-haul markets (Vorster et al., Citation2012), international tourism (Hamilton et al., Citation2004), or a specific destination (for example Norway by Sun et al., Citation2022). Only a few scientists have looked at long-term decarbonisation of global tourism (Dubois et al., Citation2011; Gössling & Peeters, Citation2015; UNWTO-UNEP-WMO, Citation2008). Also, the industry has developed a few long-term scenario studies for international aviation (IATA, Citation2021; Van Der Sman et al., Citation2021) and for the global tourism system (WTTC, Citation2021).
The emissions scope is restricted to direct CO2 emissions, thus, ignoring other GHGs and non-CO2 effects on the climate; including these would involve multiplying all CO2 emissions with equivalence- or GWP-factors. However, that would inflate the total numbers but not improve our understanding of how to mitigate CO2 emissions. Moreover, multiplying CO2 emissions with equivalence factors would mix well-defined quantities of CO2 emissions to highly uncertain, ill-defined equivalence factors for non-CO2 impacts of aviation. The resulting CO2e thus will be highly uncertain.
This study disregards food and supply chain emissions because, when travelling, people save on food and retail they would otherwise purchase at home. This same issue occurs for tourists’ reduced energy use at home for heating, cooling, fridges, and lighting. Finally, we disregard tourism activities at destinations because these result in relatively low amounts of direct emissions (some 4.1%) of the total direct emissions (Peeters & Dubois, Citation2010, p. 452) while being highly complex to model and suffering from prohibitive data-gaps. Another complexity in modelling destination tourism activities or attractions is the high visitation of these by non-tourists, emissions from which would need to be subtracted from the total emissions.
This study aims to show the economic and travel consequences of a true zero emissions future of the core businesses of tourism. The study provides a forecasting Reference Scenario and a back-casting zero emissions scenario (Dreborg, Citation1996; Soria-Lara & Banister, Citation2017), assuming specific environmental goals under global recourse limitations. The environmental goal is true zero emissions by 2050, and the resource limitations relate to energy, resources, and land use.
Modules and policies in GTTMdyn
Because of the progress of the political debate since 2017, several new policy-modules have been added to the GTTMdyn including off-sets/CORSIA, zero emissions aircraft technology, e-fuels, renewable energy use, and infrastructure emissions. Also, the COVID-19 pandemic was modelled. Supplementary File, Sections 1.5–1.9 provide detailed descriptions of the new modules, summarised below.
The off-setting policy was added to the model because the ICAO developed the Carbon Off-setting and Reduction Scheme for International Aviation (CORSIA) (ICAO, Citation2021), which is obligatory from 2024. CORSIA off-sets all international aviation emissions above the 2019 level, with off-sets being paid for by the airlines. However, off-setting shows significant flaws (Joppa et al., Citation2021), and only 20% of the off-sets might be considered to be effective (Cames et al., Citation2016). Therefore, in the model, a new timeline element was added that allows the user to set this effectiveness each year from 2024 onwards (the default is 20% effective). Also, the GTTMdyn user can define their own off-setting schemes for aviation by setting the share of total (international and domestic) aviation emissions included in the scheme. Finally, there is a limit to the availability of global off-sets, and the user can set the share of global off-sets dedicated to aviation (the default is 30%). In low-temperature scenarios, total emissions will reduce fast, not leaving much room for other sectors to both reduce their own emissions and create offsets. We ignore negative emissions and carbon storage in biomass because of their limited applicability (Fankhauser et al., Citation2022). See also Supplementary File, Section 1.5.
For the technology-related policies, there is now an option to state the assumed year of entry into service (EIS) of short-, medium- or long-haul zero emissions aircraft. These aircraft will either burn hydrogen or apply fuel cells generating electricity for electric engines. The GTTMdyn assumes that all new aircraft added to an airline’s fleet, or any old aircraft replaced, will be zero emissions technology after the year of EIS. The user can choose the emission reduction effectiveness of the technology between 20 and 100% and set the reduction of the aircraft design cruise speed (the default is 10%).
The GTTMdyn user defines e-fuels by, first, setting a timeline for overall production energy efficiency (the default is 20% but it can be specified between 10 and 80%) and, second, stating the method of introduction (mandate or subsidy). A blending mandate refers to legislation that requires airlines to tank a certain share of alternative fuels in a mix with fossil fuels. In the case of a blending mandate, the user defines the start and end years for the S-curve that describes the diffusion of an e-fuel. In the case of a subsidy, the introduction depends on the cost difference with fossil aviation fuel.
The total amount of renewable energy used is another new element of the model. This includes energy used by electric cars, trains, and accommodation, and energy used to produce e-fuels or hydrogen for zero emissions aircraft. The user can set a maximum share for tourism including all the elements that are assumed to use electricity.
Finally, a module was added to GTTMdyn to reflect infrastructure emissions. This element calculates the CO2 emissions of building new and maintaining existing, high-speed railways and airports. The infrastructure emissions are determined by the capacity required for the transport volumes generated by the GTTMdyn model and by the emission factors per unit of capacity, based on data from several sources (Chen et al., Citation2021; Cheng et al., Citation2020; Jacobs, Citation2014; Yang & Al-Qadi, Citation2017). See Section 4 of the Supplementary File for the dynamic behaviour of the model and Section 5 for a complete description of the model’s submodels, equations, and definitions.
Reference scenario
Every scenario study presents a reference or baseline scenario, in which the development of the system is described assuming policies and external developments do not change within the period the scenario describes. Then, a reference scenario forms the starting point for developing alternative scenarios and provides context. But they also play a role in calibrating and validating the scenario method, in our case the GTTMdyn model. The GTTMdyn model was calibrated using data from 1900 to 2015 (Peeters, Citation2017). The original GTTMdyn reference scenario did not assume the COVID-19 crisis (see Section Without COVID-19), so we developed a new one including COVID-19 (Section Including COVID-19 impacts).
Without COVID-19
The model’s pre-COVID-19 projections are driven by seven variables: the size of the global population, GDP per capita, the equality of the distribution of income over the global population based on the GINI factor (defined by Gini, Citation1912), the development of oil cost and prices for transport and accommodation, the carbon cost for the user-assumed global climate mitigation scenario, the trend-development of technology translating to CO2 emission factors and the speed of each transport mode. Furthermore, some long-term assumptions determine investments in high-speed rail (mainly to maintain the current high-speed rail systems in the world) and in airports. The main exogenous assumptions in the Reference Scenario are:
The SRES B1 medium economic growth (Image-Team, Citation2006) and medium population growth (United Nations, Citation2011); global income equity improves linearly from a GINI factor of 0.66 in 2005 to 0.71 in 2100.
Climate mitigation scenario: a 3.3 °C scenario with low carbon cost is assumed for the Reference Scenario because the world is still not on a pathway to reduce its emissions to below the 2 °C scenario (Tong et al., Citation2019). Note: we ignored the impact of the likely disastrous situation in a 3.3 °C world, even though it is certain that frequent weather-related disasters, conflicts over water, food, land, and resources, loss of biodiversity, and sea-level rise will all have a negative impact on tourism growth (Scott et al., Citation2023).
Technical emission factor developments are assumed to have a 0.5% per year improvement for accommodation and “other” transport modes, a rate of improvement additional to the business-as-usual rate) for aircraft efficiency based on Peeters and Middel (Citation2007), and a 0.55% per year reduction for the car. The decarbonisation of global electricity is assumed to reach 50% by 2100.
Some tourist behaviour assumptions, like the rate of reduction of length of stay, the inclination to travel, and the distance attraction remain equal to the calibrated default values.
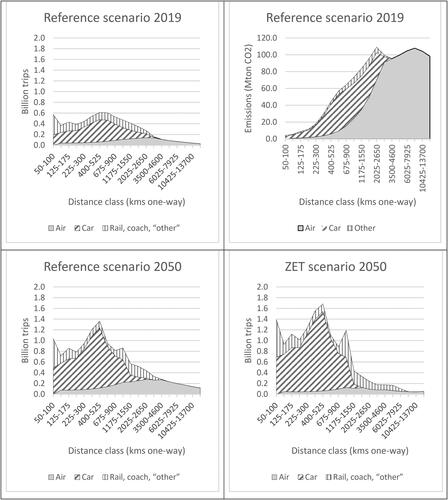
Based on these assumptions, and ignoring the COVID-19 pandemic, the GTTMdyn determines that tourism will continue to develop exponentially until 2040, after which the rate of growth of the number of trips will start to decline. The distance travelled will also increase exponentially until 2040 but after that will increase linearly. Total tourism CO2 emissions increase following the growth of the total number of trips and transport volumes, but partly temporized due to improved efficiencies. At the end of this century, the global number of trips will be 3.1 times larger than it was in 2019, while the total distance travelled will increase by a factor of 5.6 and emissions will increase by a factor of 2.8. Air travel will grow by a factor of 7.1. Revenues for the whole tourism sector will grow by a factor of 3.2. The consequence of the emissions growth is that between 2015 and 2100, the accumulated emissions of tourism would consume 26.1% of the global carbon budget for 2 °C and 45.7% of the 1.5 °C budget. See also Supplementary File, Section 2.1, for complete graphs.
Including COVID-19 impacts
The Reference Scenario was then modelled to include the sharp decline in arrivals and distances travelled in 2020 because of the COVID-19 pandemic and recovery to the original growth path by 2025. To include this disruption, we had to add a module to cater for parked aircraft to get realistic fleet results (see Supplementary File, Section 1.3). Based on several national and global datasets, the global number of trips (domestic and international) dropped by 63% in 2020, and the total distance travelled by 75%. See Supplementary File, Section 2.2, for further details and the resulting graphs in Supplementary File, Figure S6. The number of trips is expected to recover by 2025 to the pre-COVID-19 Reference Scenario. The transport volume is expected to recover before 2030 but will continue to stay 6–8% below the scenario without the pandemic.
The emissions from building and maintaining high-speed rail and airports rise from 0.090 Gton in 2019 to 0.099 Gton in 2050 and to 0.150 Gton in 2100. The share of high-speed rail infrastructure emissions will drop from 53% in 2019 to 27% in 2050 and then rise to 28% in 2100. These infrastructure emissions form 5.4% of tourism operational emissions in 2019, reducing to 3.8% in 2050 and 3.3% in 2100. The accumulated emissions between 2019 and 2100 as share of the global carbon budget for 2 and 1.5 °C temperature rises reduced from 26.1% to 23.8% and from 45.7% to 41.7%, respectively.
Uncertainty in the COVID-19 reference scenario
To assess the variety in outcomes of the COVID-19 Reference Scenario, we applied a normal distribution of deviations to a range of parameters. The normal distribution is defined upon known uncertainties, taken from the literature for a range of assumptions. By running the GTTMdyn 5000 times we assessed the uncertainty in emissions. The main assumptions were:
Demographic scenarios vary between the low and high scenarios given by the United Nations (Citation2011).
Economic scenarios between SRES A2 (stagnated growth) and A1 (high growth) with B1 (medium growth) as average.
Income equity between SRES A2 and A1 with B1 as average.
The prices of gasoline ($0.14 per kg to $0.72 per kg) and air tickets ($0.02 per passenger-km to $0.6 per passenger-km); see Figure S7 in the Supplementary File.
Various scenarios for technological developments in air, car, and other transport mode emission factors, as shown in Table S9 in the Supplementary File.
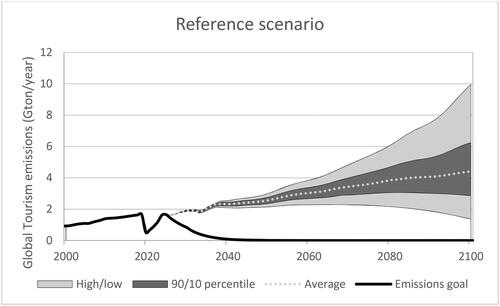
The projected number of trips in 2100 varies between 6.9 billion (almost the same as in 2019) and 44.3 billion, with an average of 20.2 billion and a standard deviation of 6.1 billion trips. For 2050, these numbers are 10.5 and 14.6 (standard dev. 0.8 and 90/10 percentiles 1.5/11.5 billion trips). The transport volume varies in 2100 between 27.0 trillion passenger-km and 165.0 trillion, with an average of 76.2 trillion passenger-km and a standard deviation of 21.6 trillion pkm (90/10 percentiles 105/49.6 trillion pkm) all in 2100. The 2100 CO2 emissions vary between 1.38 and 10.11 Gton, with an average of 4.52 Gton and a standard deviation of 1.33 Gton (90/10 percentiles 6.34/2.90).
shows the emission risk curve. For 1.5 °C, the average share is 41.7%, varying between 28.5 and 60.2%, while for the 2 °C budget, the average share is 23.8% varying between 16.2 and 34.3%. Only the lowest forecast scenario achieves a 19% reduction of emissions in 2100 compared to the level of 2019, although by 2050, this scenario still results in an increase of 28% over 2019 before it starts to reduce.
Figure 1. The variation in tourism CO2 emissions for uncertainty in demographic, economic and technological background. The model was run 5000 times following a Monte Carlo distribution for the inputs listed in the text.
Development of the zero emissions scenario
Our scenario study is based on a quantitative model-based approach. The GTTMdyn model forms the backbone of the scenario development. But the GTTMdyn needs the scenario developer to make a range of choices (all 45 policy measures require some choice telling the model what to assume), we used interactive elements to make those choices.
First, we held a “serious gaming” workshop in August 2022, in which seven researchers and two tourism sector representatives participated and “played” the serious game, the GTTMdyn. We started our scenario building with solutions suggested by the industry and, discovering these to be insufficient, added more far-reaching policies. The workshop resulted in a single, narrow pathway that might allow us to reach the zero emissions goal—we called this pathway the “ZET scenario” (Zero Emissions Tourism). Then, in two online international stakeholder meetings in October 2022, this scenario was discussed by forty representatives of the travel and tourism sector from all over the world, resulting in an improved scenario. Finally, participants of a public webinar in November 2022 reflected on the improved scenario. The stakeholder meetings and the webinar contributed to our understanding of the consequences of the ZET scenario for tourism and for the broader economic landscape in the different world regions.
Zero emissions tourism scenario
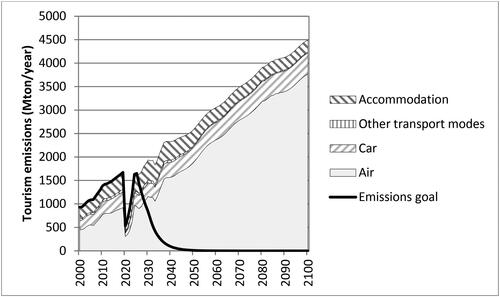
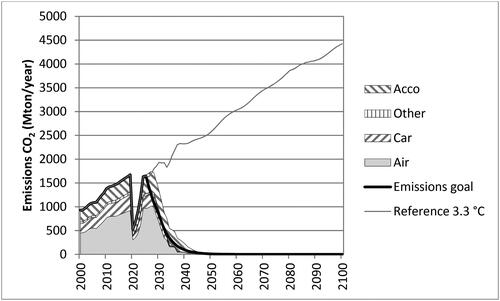
shows the emissions gap between the Reference Scenario and the emissions goal pathways. Air travel emissions form the largest share of this challenge, while other tourism emissions roughly stay constant.
Figure 2. The BAU emission projections strongly contrast with the Emissions goal pathway shown by the black line. Notes: (1) The emissions for “other” transport are very small.
The main policy options for a ZET scenario
During the Glasgow COP26 in 2021, the leading tourism organisations developed a climate roadmap (WTTC, Citation2021) and recommendations for transitioning to a green industry—a green recovery roadmap (UNWTO, Citation2021). Similarly, the aviation sector drafted: a roadmap (IATA, Citation2020), a vision of net zero aviation (ATAG, Citation2021), a scenario study ordered by European aviation organisations (Van Der Sman et al., Citation2021), and another report by independent high-level ICAO experts (ICAO, Citation2022b). For aviation, the solutions propose CO2 off-setting (CORSIA), sustainable alternative fuels (SAF), fuel-efficiency improvements, revolutionary technology, and air traffic control measures. The UNWTO (Citation2021) tourism report discusses monitoring emissions, avoiding food waste, and saving energy in the accommodation sector. WTTC (Citation2021) is more explicit and covers accommodation (waste management, energy use, increased share of renewables, sourcing sustainable products from supply), tour operators (mainly: employee and office operators, shifting away from aviation or choosing the most efficient airline, off-setting), aviation (same as the aviation sector), (online) travel agencies (mainly office-related issues and adding carbon footprint information to inform clients).
For the scenario building, we assumed that all non-aviation elements of tourism would be within the purviews of the NDCs and, thus, would be enforced to zero emissions by 2050. The consequences of the NDC policies are discussed in Section Discussion and conclusion. The aviation sector claims that off-setting is “critical to reaching the sector’s ambitious goals in addressing its impact on the global climate” (ICAO, Citation2022a, p. 7). To assess the impacts of off-setting, we assumed a 1.5 °C background scenario. This temperature assumption requires that there be zero emissions in 2050. Logically, this means that there will be no further availability of fossil fuel energy reduction offsets from other sectors as no fossil fuels will be in use anymore.
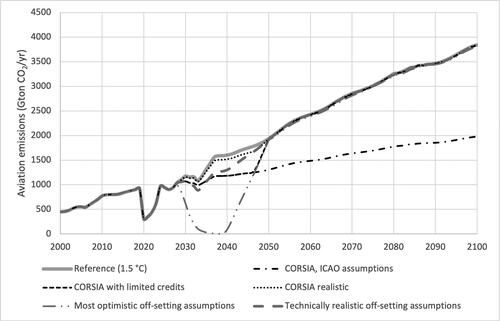
As shows, CORSIA cannot decrease global tourism-related aviation emissions even with theoretical assumptions about improved effectiveness and the availability of credits. This is because CORSIA exempts domestic flights and affects emissions only above the 2019 level. The theoretical assumptions allow for a rise of 41% in emissions compared to 2019. The Technically realistic offset assumptions scenario shows that off-setting effects are marginal and temporary.
Figure 3. The impacts of various off-setting assumptions on aviation emissions. Notes about effects of varying assumptions for offsetting (see Section 1.5 of the Supplementary File for background information):
- Reference (1.5 °C): no offsets.
- CORSIA, ICAO assumptions: CORSIA share of aviation (domestic excluded), 100% effectiveness of off-sets, unlimited off-set resources.
- CORSIA with limited credits: CORSIA share of aviation, 100% effectiveness of off-sets, maximum of 30% share of available off-sets for aviation.
- CORSIA realistic: CORSIA share of aviation, 20% effectiveness and 30% share of available off-sets for aviation.
- Most optimistic off-setting assumptions: 100% aviation emissions, 100% effectiveness of off-sets, 100% share of available off-sets for aviation.
- Technically realistic off-setting assumptions: 100% aviation emissions, 20% offset effectiveness and 30% share of global available off-sets for aviation.
For mitigating its emissions, the aviation sector relies heavily on the use of Sustainable Aviation Fuels (SAF) to deliver high shares of the emission reductions that they have committed to IATA (Citation2021) and (ICAO, Citation2022a). SAF covers a range of different production processes and feedstocks. Three main types exist: biofuels (SAF-B), biological waste-based (SAF-W), and synthetic e-fuels (SAF-E). SAF-B is the oldest form, where a range of agricultural crops generates the feedstock (Edenhofer et al., Citation2011). SAF-B suffers from high land-use and low life cycle emissions reductions. The global land-availability for biofuels depends on the requirements for sustainable development and ranges between “sustainable” and “physical” amounts of 446 and 13,300 Mha, respectively (World Bank Group, Citation2010). SAF-W is not modelled, partly because waste will become a scarce resource in a zero emissions future (Rao & Riahi, Citation2006). SAF-W is still a bio-based fuel and will have issues with land-use, but the life cycle performance could be better. SAF-E can be produced directly from CO2 from the atmosphere (Schäppi et al., Citation2022) or the ocean (Patterson et al., Citation2019). SAF-E can close the carbon cycle if only renewable energy and direct air capture are used (Okesola et al., Citation2018). In essence, there are two pathways to overcome the large price-difference between fossil fuel and SAF: (1) taxes on carbon-based fuels or subsidies on SAF, and (2) introduce a SAF blending mandate policy (World Economic Forum, Citation2020).
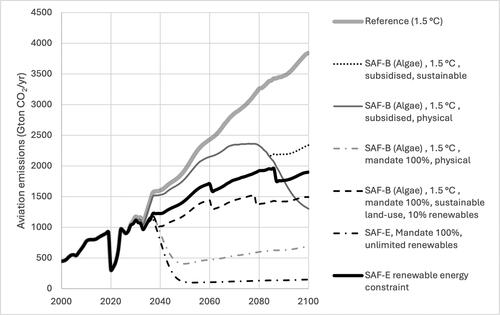
shows the results of a range of assumptions. Under the carbon cost development in a 1.5 °C scenario, algae appeared to perform best of all the SAF-B types tested. When subsidised and under a physical land-use limit, emissions are seen to decline after 2078, though a sustainable land-use limit would stop this effect after 2085 (shown by the divergence of the dotted and narrow dark grey lines in the figure). A 100% mandate by 2050 for algae is initially more effective, though in 2050 emissions would srart to increase by 30% in 2100 (with respect to 2050 levels) due to the sustainable land-use limitation (dashed line) but would reduce by 56% when land-use is not constrained (narrow light grey line). Theoretically, the best option is a 100% blending mandate by 2050 for SAF-E, ignoring the constraint of limited renewables availability. This scenario would reduce emissions by 88% (from 2019 levels). Because Algae-based SAF-B poses serious risks to biodiversity (Abdullah et al., Citation2019), in the ZET scenario we only apply SAF-E, despite its lower performance under renewables constraints.
Figure 4. The potential of sustainable aviation fuels (SAF) for various assumptions about types and land-use and renewables constraints. The 1.5 °C refers to a background scenario where the global temperature is limited to 1.5 °C and the carbon cost and amount of renewable energy globally available in such a scenario.
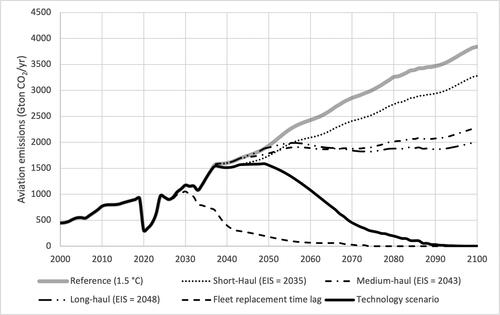
Evolutionary technology—the gradual improvement of fuel efficiency—has failed to compensate for the growth of the aviation sector (Peeters et al., Citation2016). For zero emissions aircraft, we need revolutionary technology like battery-powered aircraft, hydrogen fuel cell electric aircraft, and hydrogen-burning jets (Baroutaji et al., Citation2019). Currently, the gravimetric energy density (MJ/kg) of battery technology is 42 times lower than that of current jet-fuel (Noland, Citation2021). As fuel weight comprises up to 40% of an aircraft’s take-off weight, replacing the fuel with 42 times heavier batteries is impossible—the aircraft would not be able to approach, by any margin, the payload-range performance of current jet-aircraft (Epstein & O’flarity, Citation2019). Suitable batteries are not expected anytime soon and it may not be feasible to increase their energy densities by more than a factor of three because of the laws of physics (Epstein & O’flarity, Citation2019). Hydrogen has a large weight advantage over Jet-A but suffers a large volume disadvantage. Also, hydrogen requires substantial redesigning of current jet aircraft (Epstein & O’flarity, Citation2019). The third option, flying electric but with fuel cells producing electricity from on-board hydrogen, has the best prospects for short- and medium-haul flights (Epstein & O’flarity, Citation2019). Based on sector plans and statements (Airbus, Citation2023; Dubois et al., Citation2023; Flottau, Citation2022; Osborne, Citation2019; Warwick, Citation2022), we assume short-haul flights to have an entry into service (EIS) year of 2035, medium haul to have an EIS of 2043 and long-haul an EIS of 2048. shows that these assumptions bring down emissions to zero, but only by the end of the twenty-first century, 50 years too late. The theoretical Fleet replacement time lag line assumes the almost immediate introduction of zero emissions aircraft (in 2025) and shows the time lag of replacing the current fleet of aircraft.
Figure 5. The potential for revolutionary technology in aviation for short-, medium-, and long-haul range aircraft, and all three combined (technology scenario). The fleet replacement case shows the theoretical emissions when zero emissions aircraft would come onto the market for all ranges by 2025. The “Reference (1.5 °C)” refers to the background that limits the global temperature rise to 1.5 °C.
Assumptions
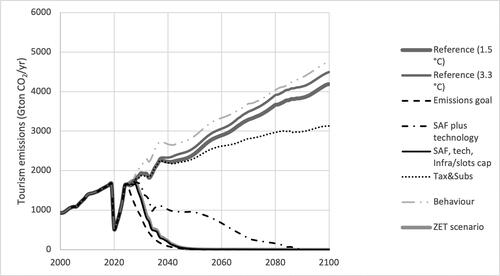
Using the main policies described in the previous section, we created the Zero Emissions Tourism (ZET) scenario. As the “storyline” of a zero-emissions tourism scenario only logically fits a world scenario that limits the global temperature rise to 1.5 °C, we changed the original background scenario assumptions from a 3.3 °C climate future to 1.5 °C. shows the limited reduction of tourism emissions caused by this assumption (the difference between reference 3.3 °C and target 1.5 °C) and the individual policy domain impacts. Nevertheless, even when revolutionary technology and mandated SAF-E are combined, these are insufficient to reduce tourism emissions below the 2000 levels by 2050. Therefore, we had to add a restriction on the growth of air travel, modelled as an international restriction on airport slots through an international agreement. This is coupled with massive investment in high-speed rail to compensate for the travel, particularly of medium-haul trips, removed from aviation. Finally, we rebalanced the subsidies given to rail and other transport modes by adding a ticket tax for aviation and by assuming a per km charge for cars of up to 50% of the reference car-cost (gradually replacing the current fuel taxes that will disappear when cars become increasingly electric). A final assumption was made about tourist behaviour like the number of trips per year, the length-of-stay, and the preference to travel longer distances. Such changes are assumed to be induced by product supply and marketing measures from the sector to keep global revenues growing as in the Reference Scenario. As the Behaviour line in shows: changing behaviour would increase emissions but that effect would be minimal when the other three main policies (SAF-E, technology, and slot-reduction) are implemented (compare the difference between the SAF, tech, infrastructure, and the ZET scenario lines). Without this assumption, revenues would go down in 2050 by 6%. As shows, the emissions will be slightly higher until 2050 due to the additional trips.
Figure 6. The impact of the isolated policy categories and some combinations. The “Reference (1.5 °C)” refers to a global background scenario that limits the global temperature to 1.5 °C, while the other reference scenario assumes the temperature is allowed to rise to 3.3 °C. The main difference for the tourism system is in the different carbon cost in these two background scenarios.
provides an overview of all ZET scenario assumptions deviating from the Reference Scenario. Mini-graphics show the assumed behaviour over time.
Table 1. Overview of all assumptions of the ZET scenario that deviate from the Reference Scenario.
Results for the ZET scenario
shows the final ZET scenario CO2 emissions. The emission pathway is slightly above the emissions goal, but it reaches the goal of zero in 2050. Between 2015 and 2100, the total carbon budgets reduce from 23.6% to 2.8% for 2 °C and from 41.4% to 4.9% for the 1.5 °C case.
Figure 7. The final ZET scenario emissions per main tourism subsector.
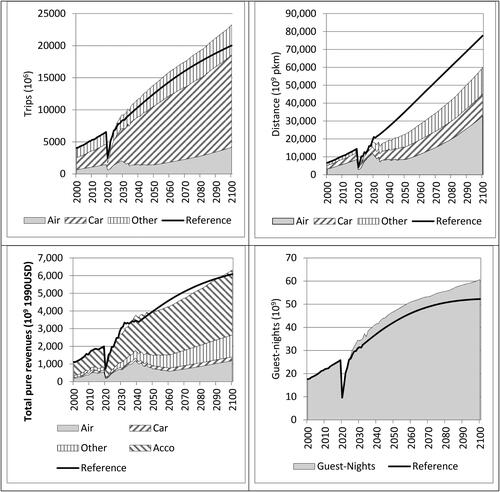
shows the sector consequences of the ZET scenario. As a consequence of the mitigating policies and the behavioural assumptions, the number of trips and guest nights grows faster than in the Reference Scenario. Revenues roughly follow the reference. Only the distances travelled depart substantially from the Reference Scenario, because of the global slot limitation. Introduction of the zero emissions aircraft fleet enables the re-growth after 2050.
Figure 8. The impacts of the ZET scenario on the number of trips (upper left), kilometres travelled (upper right), revenues (lower-left and guest nights (lower right).
shows the distribution of trips over the 60 markets modelled. In 2019, most trips are generated by car for distances up to 1000 km, though larger distances occur (upper left graph). Air transport continues to dominate distances above 2500 km. The upper right graph shows the role of distance for emissions per distance class. The number of trips by other transport modes in distance classes below 2000 km are comparable with the number of air trips, but the emissions are much lower. In the Reference Scenario, all markets grow, but the lower-left graph shows strong growth for aviation and large distance classes. The ZET scenario market distribution overall differs marginally from the Reference Scenario except for the growth of the medium and long-haul “tails” of the graph. From the data, we estimate that about 84% of all trips in the ZET scenario would be in the same market segment as in the Reference Scenario, meaning that only 16% have to shift mode or distance, or both.
Figure 9. Market distribution graphs (billion trips; Mton CO2 (upper-right)) as a function of distance class (lower and upper bounds shown in kms one-way on the horizontal axis).
Our scenario modelling and policy risk analyses show the essential policies for the ZET scenario are:
Full electrification of accommodation, cars, and other transport forms by 2050
100% renewables in electricity production by 2050
An e-fuel blending mandate starting in 2025 and rising to 100% in 2050
Due to the 10% maximum renewables share assumed, there will not be enough e-fuel to accommodate all BAU air travel under a 100% e-fuel mandate. Therefore, a global airport capacity constraint avoids most of the air travel growth between 2025 and 2050. Potential measures are a slots cap, an emission cap, or to include international aviation in NDC’s; GTTMdyn provides only a slots cap).
A multi-trillion investment in faster surface transport like high-speed rail, e-fuel development, zero emissions aircraft, renewables, and electrification.
Risks of failing policy robustness
By running the GTTMdyn 5000 times with the same policy failure risk assumptions (as described in Section Uncertainty in the COVID-19 reference scenario), we find the emissions vary marginally. This shows the ZET scenario is robust. But what will happen to the emissions when policymakers fail to fully implement one or all the three main policy (e-fuel, zero emissions aircraft, and slot-policy)?
We tested a delay to the zero emissions aircraft EIS, a failure of the global slots policy, and a failure of the global SAF-E blending mandate. shows the outcome of a delay in the introduction of zero emissions aircraft technology (a normal distributed delta on EIS, 0 years expected, 80 years standard deviation, truncated between 0 and 60 years above the values set in the ZET scenario). From this, we conclude that a delay to the zero emissions aircraft EIS gives a relatively small impact on global tourism emissions. The cause is that, when combined, the slots restriction and SAF-E mandate (with maximum renewables share of 10% to tourism), alongside an assumed to be still-rising global availability of renewables after 2050, guarantee almost zero emissions until the end of the century. However, the cost of this scenario is that the tourism share of renewables shortly overshoots at 15% and does not reduce below 6%, while in the ZET scenario, these numbers are 10% and 6%, and they decline more quickly. Another issue is that climate warming from contrails will not become zero with e-fuels (Märkl et al., Citation2023). But strategies avoiding contrails/cirrus are being developed (Simorgh et al., Citation2022), and, with e-fuels, would be possible without a CO2 penalty.
Figure 10. The impact of policy failure on all tourism emissions for the failure of bringing zero emissions aircraft to the market (EIS delayed, upper left), a failure to implement the SAF-E blending mandate (upper right) and a failure of the slot capacity policy (lower left). The lower right figure shows the impact of all three failures concurrently.
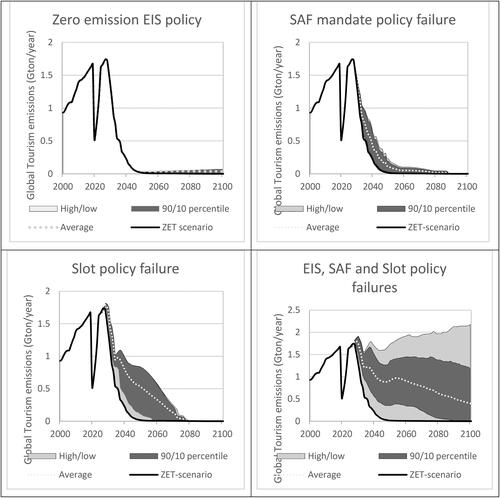
Failing to implement the SAF-E blending mandate (normally distributed failure to reach 100% blending by 2050 between 5% and 100%, truncated to 5%) has a greater impact on emissions than failing to deliver the zero emissions aircraft. However, a failure of the global slot restriction policy (normal distributed number of slots as in the ZET scenario varying between equal to ZET, up to seven times the ZET limit) has the greatest impact. The reason for this is that the slot limitation initially, in 2025, significantly reduces the level of air transport in BAU, while the SAF-measure only starts to become effective after 2035–2040 and the EIS after 2045–2050. So, it is particularly the initial volume reduction of air travel that directly reduces the emissions. Another factor in all three risk-tests is that the strong reduction pathways of non-aviation tourism are unaffected and, relatively quickly, remove vast amounts of emissions between 2019 and 2045. The two other policies cannot replace the effect of the volume restriction (see ). When all three policies fail mutually—tested with 1000 runs due to the higher number of failure combinations—emissions stay roughly constant between 2025 and 2100. This is less than in BAU, due to the zero emissions policies for surface transport and accommodation.
The risk of tourism policies failing the ZET scenario has consequences for the carbon budget consumed by the sector. The combined failure shown in causes the 1.5 °C carbon budget share to range between 5.1% and 25.9% (10/90 percentile 8.2/19.6%). The 2 °C budget share ranges between 2.9 and 14.8% (10/90 percentile 4.7/11.2%). Both shares are down from the average Reference Scenario values of 41% and 24%.
Discussion and conclusion
Social and economic consequences of the ZET scenario
The main outcome of the ZET scenario is that the number of tourists, guest-nights, and revenues can be kept as in BAU, but only if the distances people travel will not grow at least until mid-century. A range of imbalances and inequalities currently characterises the BAU travel and tourism system. Travellers residing in high and middle income countries are responsible for most of tourism’s CO2 emissions (Bruckner et al., Citation2022), while risks of climate change are highest in the least developed nations (Scott et al., Citation2019). The economies of some of these destinations depend highly on long-haul tourism, which in the ZET scenario can no longer grow.
The problem of climate inequity is not unique to tourism, and the solution is straight-forward: poverty alleviation might increase emissions in developing countries, but only a small reduction of the emissions of rich countries would more than off-set that increase (Tourism Panel on Climate Change, Citation2023). Rockström et al. (Citation2023) found that the “just” limits to climate change are well below the “safe” limits. Therefore, the issue of poverty and tourism should not be a general argument against reduced aviation growth, but an argument for fairer distribution of air lift capacity. The fair distribution of SAF-E, and negotiations around airport slots, as proposed in the ZET scenario, can provide further support to an equitable distribution of resources.
Examples of current government interventions fitting a ZET scenario are the inclusion of international aviation emissions in the NDCs of The Netherlands, the United Kingdom, and the European Union (European Parliament, Citation2022). SAF blending mandates are now planned in Sweden, Norway, France, Spain, The Netherlands, the United Kingdom, Germany, Switzerland, Finland, Turkey, and the European Union (Eurocontrol, Citation2023). Slot capacity restrictions to alleviate environmental issues are not a new phenomenon (Reichmuth et al., Citation2011). The Netherlands plans a carbon ceiling for its international airports (Ministerie van Infrastructuur en Waterstaat, Citation2020). The EU has taken several actions to cut emissions from aviation, such as including an increasing emission share of all flights departing from the European Economic Area into the Emissions Trading System (ETS).
Though tour operators, travel agencies, national tourism organisations, and destination management organisations are highly dependent on national and international policies, they can accelerate the change by actively shaping travel demand. Opportunities are shifting to domestic and regional tourism, identifying new short- and medium-haul source markets, enhancing cross-level, cross-border, and cross-sector collaboration, incentivising longer stays, diversifying local economies, and shaping the understanding of the holiday experience.
Limitations
Our approach posed some limitations. To avoid too complex modelling, rather than trying to model all potential flows between all countries, only sixty distance and transport mode markets of the global tourism system were included in the model. A disadvantage of the GTTMdyn is that it cannot distinguish between international and domestic tourism, nor explicitly say anything about tourism flows between certain regions. Nevertheless, as the previous section articulated, the ZET scenario provides guidance to qualitatively assess the consequences for individual countries worldwide. Of course, the lack of geography raises “questions around global equity and fairness” (Peeters & Papp, Citation2023, p. 6), which Peeters and Papp (Citation2023) discuss in Part 4 of their report.
The scope of GTTMdyn excludes indirect emissions except for airport and high-speed rail construction. In the BAU scenario, these emissions never exceed 5% of all tourism emissions. In the ZET scenario, rail construction may cause up to 50% of all tourism’s emissions, but this peak occurs close to 2050 when the global tourism emissions approach zero. So, in absolute terms, the emissions are still low. See also Section 1.8 of the Supplementary File.
The GTTMdyn does not cover same-day visitors as it utilises the UNWTO definition of a visitor to be classified as “a tourist (or overnight visitor) if his/her trip includes an overnight stay” (UNWTO, Citation2016, p. 532). Many tourism and transport statistics use varying specifications for same-day visitors like a minimum visiting time or a minimum distance from home, causing serious data and modelling issues (Peeters et al., Citation2007; UNWTO, Citation2019; UNWTO-UNEP-WMO, Citation2008). The only attempt to estimate same-day emissions was published by UNWTO-UNEP-WMO (Citation2008) and shows that some 13% of all tourism transport emissions were from same-day visitors, while only 2% of air travel emissions were from same-day trips.
In modelling the ZET scenario, we ignore tourism activities at destinations and the indirect emissions of food and waste, although these can be substantial in the high-end accommodation sector due to high food-waste ratios and high energy consumption per room in hotels. Some 25% of trips are for visiting friends and relatives, while also low-emission apartments, campsites, and holiday homes often are popular. Also, we ignore local transport and tourist activities at the destination. At global level there is no data on which such travel can be based. The only source providing an estimate is UNWTO-UNEP-WMO (Citation2008), who assume that about 40 kg of CO2 per trip is caused by activities including local transport.
In air travel, we ignore non-CO2 effects. Generally, these are represented by calculating CO2_eq (carbon equivalents), but such calculations are highly problematic (Peeters et al., Citation2007). Lee et al. (Citation2021, p. 13) warn about using a simple equivalence factor for long-term projections because “the ratio between total CO2-warming-equivalent emissions from all forcing agents and those from CO2 alone will change substantially if future aviation emissions deviate from their current growth trajectory”. Another reason to ignore the non-CO2 effects is that CO2 forms an intergenerational effect, while most non-CO2 effects can typically be mitigated intra-generationally. A final matter is that multiplying all aviation emissions with a certain uplift-factor is likely to change the numbers, but not the outcome of the ZET scenario.
A seldomly discussed matter is the potential role of hydrogen in climate change. Hydrogen is not a GHG, but it may indirectly cause changes to the climate (Warwick et al., Citation2022). Burning hydrogen at high altitudes will cause water vapour and may cause contrails and cirrus clouds (Miller et al., Citation2023). Therefore, the fuel cell aircraft have a better prospect because such aircraft will fly lower and be less prone to contrail forming (Grewe et al., Citation2014). However, the hydrogen leakage risk should be further assessed.
Sector and policy recommendations
Most changes required for the ZET scenario will happen because of the NDCs in the assumed 1.5 °C global scenario, outside the tourism industry. These changes include ground transport and accommodation electrification and 100% renewable electricity production. On the demand side, we show that, in 2050, 16% of travellers will shift from one to another tourism market, which is not a major behavioural change over a period of almost three decades.
However, in the ZET scenario, the three key policy changes require an international approach and will modify mainly the air transport supply. Of the three international policy changes, the first is to mandate the blending of e-fuels for aviation following an S-curve that ends at 100% in 2050. This mandate should be set within a reasonable share of global renewables supply, which we assume never to exceed 10%. Because of the constraint on the supply of renewables, 100% e-fuels in 2050 is only possible at limited to no growth of air travel (see also discussion in Becken et al., Citation2023). This means a fundamental change for policymakers, who normally take sector volume growth as the natural “law”, accepting environmental limitations will always be exceeded. The ZET scenario shows that shifts from high- to low-carbon trips are possible without losing economic value, freedom of travel, or jobs.
We modelled limiting the aviation volume by applying an airport slots cap. Environmental (noise) constraints to airport capacity are not uncommon (Massy-Beresford, Citation2023). Currently, 43% of global passengers fly from a slot-restricted airport and international Worldwide Airport Slot Guidelines (WASG) exist (IATA, Citation2024). Building on such WASG would allow for a more equitable distribution of air travel over the world and consider remote island’s high dependence on aviation. The ICAO (International Civil Aviation Organisation) would be an obvious candidate for implementing such a regulation. The UNFCCC could support this action by including international aviation bunkers in the NDCs, making the emission consequences of airport developments the full responsibility of national governments (Lyle, Citation2022).
A third international policy should enforce the development of zero emissions aircraft. Though part of the industry is currently increasingly investing in such aircraft as retrofit (Bjerregard, Citation2022) or new designs (Flottau, Citation2023), government support and regulation are needed to support this development (Flottau, Citation2022) and to phase out conventional aircraft as soon as appropriate. To achieve such phase out, the stringencies for the ICAO CO2 Emissions Standard (ICAO, Citation2017) could be set close to zero.
Tourism enterprises and trade organisations can accelerate the changes required in the ZET scenario by lobbying and by focused product and market development. While only moderate behavioural change is required from the travellers, the key change will be a change in supply (Papp et al., Citation2023). Industry experts can play a key role in enhancing the perception of domestic and regional destinations, low and zero emission transportation modes, longer stays and, in general, rewarding sustainable choices.
Research recommendations
It is recommended to use the ZET scenario to identify and develop key international policies. For instance, to develop existing ICAO policies (CORSIA and the CO2 standard), to implement the 100% e-fuel mandate, or to find the best way to implement an international policy to curb aviation capacity growth, which is needed to avoid tourism’s share of global renewables becoming disproportional. A second line of research could assist policymakers to achieve 100% renewables, full electrification of accommodation and surface and water transport, effective modal shift to low-energy rail and public transport, and to reduce the desire for long distance travel.
Eco-labels, currently based on lower-carbon properties of tourism products, should be modified towards an indicator that identifies zero emission products. Current label schemes tend to highly value off-setting, even though these can hardly help to reach a true zero emissions future. Also, the current line of studies in behavioural change might be better shifted away from “responsible travellers” towards “responsible supply” (Font & Hindley, Citation2016), and provide knowledge about how tourist behaviour will change under a ZET scenario that is firmly based on institutional change.
The reduced long-haul air travel generates a range of research questions with respect to equity issues and accessibility of remote areas. Solutions are essential here, but the ZET scenario contains sufficient levels of long-haul travel, to solve these issues. However, some governance will be needed because pure economic drivers will drive the tourism system to ever increasing distances for tourists from the most developed countries as history shows.
Conclusions
The ZET scenario proves that it is possible to reduce tourism’s emissions to true-zero by 2050 while maintaining the sector’s capacity to thrive and maintain its contribution to the global economy. This growth, however, differs from the growth paradigm of the past. In the ZET scenario, growth is steered by emissions and partly redistributed from the dominant aviation sector to faster decarbonising subsectors. In the shorter distance classes, rail and electric car/bus/ferry travel will dominate. A shift will occur towards short- and medium-haul travel away from frequent long-haul trips. As those long-haul markets are small, this means 84% of all trips in the ZET scenario will remain in the same market segment as in the Reference Scenario.
Behavioural change based on “soft” measures (like government campaigns and eco-labels) has its limitations (Papp et al., Citation2023). The ZET scenario is full of supply driven behavioural change as, for instance, the development of the volume of passenger-kilometres between 2025 and 2050 comes almost to a stand-still. While many of the proposed measures in the ZET scenario fall outside the direct competencies of travel and tourism actors, the sector can play a crucial role in accelerating the transition to true zero.
The challenges to realise the ZET scenario need to be weighed against the disastrous impacts of a too fast warming future. We show that the ZET scenario provides a bright, socio-economic development path for tourism and provides better opportunities for a fair and just transition than is offered by the Reference Scenario. ZET offers opportunities for preserving a higher share of long-distance travel for the most remote destinations. The relatively small losses in long-haul travel are easily absorbed by the short- to medium-haul sectors of the tourism economy.
The ZET scenario offers a viable, true zero emissions future for the global travel and tourism sector. Nevertheless, the implementation of this scenario depends largely on our ability to shift from short-term thinking to long-term planning. The success of the ZET scenario rests on three main pillars: the large-scale introduction of zero emissions aircraft, a global SAF-E mandate, and a global airport slots policy. These actions, coupled with the electrification of accommodation, cars, and other transport modes, 100% use of renewable energy for electricity production, and a shift in tourism product development and marketing will pave the way for a thriving sector and sustainable destinations.
Supplemental Material
Download PDF (12.3 MB)Acknowledgements
We would like to thank three anonymous reviewers for their insightful comments and recommendations, which helped us greatly improve the manuscript. We would also like to thank Marianne Copeland for her most helpful proofreading of the draft text.
Disclosure statement
No potential conflict of interest was reported by the author(s).
Additional information
Funding
Notes on contributors
Paul Peeters
Paul Peeters is a Professor at the Centre for Sustainability, Tourism and Transport (CSTT) of Breda University of Applied Sciences, the Netherlands. His publications cover a wide range of topics including climate scenario’s, system dynamic approaches to tourism research and modelling, air transport, tourism transport mode choice, and modal shift, policy making, tourism climate mitigation and adaptation policies, and transport technological developments.

Bernadett Papp
Bernadett Papp works as a researcher at the European Tourism Futures Institute, Bernadett focuses mostly on urban tourism development and related challenges. She is active in the field of scenario planning and strategic foresight. She teaches at bachelor and master levels at NHL Stenden University in the Netherlands. In the past years, Bernadett worked with various multilateral organisations. She is currently a PhD candidate at the University of Glasgow, Scotland, and a member of the United Nations World Tourism Organization’s QUEST Advisory Board.
References
- Abdullah, B., Syed Muhammad, S. A F. A., Shokravi, Z., Ismail, S., Kassim, K. A., Mahmood, A. N., & Aziz, M. M. A. (2019). Fourth generation biofuel: A review on risks and mitigation strategies. Renewable and Sustainable Energy Reviews, 107, 37–50. https://doi.org/10.1016/j.rser.2019.02.018
- Airbus (2023). Zeroe. Towards the world’s first zero-emission commercial aircraft. Retrieved from https://www.airbus.com/en/innovation/low-carbon-aviation/hydrogen/zeroe
- Åkerman, J. (2005). Sustainable air transport – On track in 2050. Transportation Research-D, 10(2), 111–126.
- Allen, M. R., Friedlingstein, P., Girardin, C. A. J., Jenkins, S., Malhi, Y., Mitchell-Larson, E., Peters, G. P., & Rajamani, L. (2022). Net zero: Science, origins, and implications. Annual Review of Environment and Resources, 47(1), 849–887. https://doi.org/10.1146/annurev-environ-112320-105050
- ATAG (2021). Waypoint 2050x. Balancing growth in connectivity with a comprehensive global air transport response to the climate emergency: A vision of net-zero aviation by mid-century. Air Transport Action Group.
- Baroutaji, A., Wilberforce, T., Ramadan, M., & Olabi, A. G. (2019). Comprehensive investigation on hydrogen and fuel cell technology in the aviation and aerospace sectors. Renewable and Sustainable Energy Reviews, 106, 31–40. https://doi.org/10.1016/j.rser.2019.02.022
- Bass, F. M. (2004). Comments on “a new product growth for model consumer durables”: The bass model. Management Science, 50(12_supplement), 1833–1840. https://doi.org/10.1287/mnsc.1040.0300
- Becken, S., Mackey, B., & Lee, D. S. (2023). Implications of preferential access to land and clean energy for sustainable aviation fuels. The Science of the Total Environment, 886, 163883. https://doi.org/10.1016/j.scitotenv.2023.163883
- Bjerregard, L. (2022). Hydrogen is coming. Aftermarket prepares for hydrogen-electric aircraft conversions, 2022, MRO20-22.
- Bruckner, B., Hubacek, K., Shan, Y., Zhong, H., & Feng, K. (2022). Impacts of poverty alleviation on national and global carbon emissions. Nature Sustainability, 5(4), 311–320. https://doi.org/10.1038/s41893-021-00842-z
- Cames, M., Harthan, R. O., Füssler, J. R., Lazarus, M., Lee, C. M., Erickson, P., & Spalding-Fecher, R. (2016). How additional is the clean development mechanism? Analysis of the application of current tools and proposed alternatives (CLlMA.B.3/SERl2013/0026r).
- Chen, P., Lu, Y., Wan, Y., & Zhang, A. (2021). Assessing carbon dioxide emissions of high-speed rail: The case of Beijing-Shanghai corridor. Transportation Research Part D: Transport and Environment, 97, 102949. https://doi.org/10.1016/j.trd.2021.102949
- Cheng, S., Lin, J., Xu, W., Yang, D., Liu, J., & Li, H. (2020). Carbon, water, land and material footprints of China’s high-speed railway construction. Transportation Research Part D: Transport and Environment, 82, 102314. https://doi.org/10.1016/j.trd.2020.102314
- Deangelo, J., Azevedo, I., Bistline, J., Clarke, L., Luderer, G., Byers, E., & Davis, S. J. (2021). Energy systems in scenarios at net-zero CO2 emissions. Nature Communications, 12(1), 6096. https://doi.org/10.1038/s41467-021-26356-y
- Dreborg, K. H. (1996). Essence of backcasting. Futures, 28(9), 813–828. https://doi.org/10.1016/S0016-3287(96)00044-4
- Dubois, G., Ceron, J. P., Peeters, P. M., & Gössling, S. (2011). The future tourism mobility of the world population: Emission growth versus climate policy. Transportation Research-A, 45(10), 1031–1042.
- Dubois, T., Massy-Beresford, H., Norris, G., Warwick, G., & Batey, A. (2023). Getting concrete. Aviation Week & Space Technology, 94–97(December 26, 2022-January 15, 2023).
- Edenhofer, O., Pichs-Madruga, R., Sokona, Y., Seyboth, K., Matschoss, P., Kadner, S., & Von Stechow, C. (Eds.). (2011). IPCC special report on renewable energy sources and climate change mitigation. Cambridge University Press.
- Epstein, A. H., & O’flarity, S. M. (2019). Considerations for reducing aviation’s CO2 with aircraft electric propulsion. Journal of Propulsion and Power, 35(3), 572–582. https://doi.org/10.2514/1.B37015
- Eurocontrol (2023). Use of sustainable aviation fuels in European states (ECAC) and airports. Retrieved from https://www.eurocontrol.int/shared/saf/
- European Parliament (2022). Fit for 55: Deal on more ambitious emissions reduction for aviation. Retrieved from https://www.europarl.europa.eu/news/en/press-room/20221205IPR60611/fit-for-55-deal-on-more-ambitious-emissions-reduction-for-aviation
- Fankhauser, S., Smith, S. M., Allen, M., Axelsson, K., Hale, T., Hepburn, C., Kendall, J. M., Khosla, R., Lezaun, J., Mitchell-Larson, E., Obersteiner, M., Rajamani, L., Rickaby, R., Seddon, N., & Wetzer, T. (2022). The meaning of net zero and how to get it right. Nature Climate Change, 12(1), 15–21. https://doi.org/10.1038/s41558-021-01245-w
- Flottau, J. (2022). Aerospace moving too slowly on sustainability, Faury says. Retrieved from https://aviationweek.com/air-transport/aircraft-propulsion/aerospace-moving-too-slowly-sustainability-faury-says
- Flottau, J. (2023). Big bets. Airbus targets both new conventional and hydrogen platforms for 2035 even as supply chain constraints will limit its growth for years. Aviation Week & Space Technology, 34–37(June 19 - July 2, 2023).
- Font, X., & Hindley, A. (2016). Understanding tourists’ reactance to the threat of a loss of freedom to travel due to climate change: A new alternative approach to encouraging nuanced behavioural change. Journal of Sustainable Tourism, 25(1), 26–42. https://doi.org/10.1080/09669582.2016.1165235
- Gini, C. (1912). Variabilità E Mutabilità. In E. Pizetti & T. Salvemini (Eds.), Reprinted in Memorie di metodologica statistica (Vol. 1). Libreria Eredi Virgilio Veschi.
- Gössling, S., & Peeters, P. M. (2015). Assessing tourism’s global environmental impact 1900–2050. Journal of Sustainable Tourism, 23(5), 639–659. https://doi.org/10.1080/09669582.2015.1008500
- Gössling, S., & Scott, D. (2012). Scenario planning for sustainable tourism: An introduction. Journal of Sustainable Tourism, 20(6), 773–778. https://doi.org/10.1080/09669582.2012.699064
- Gössling, S., Balas, M., Mayer, M., & Sun, Y.-Y. (2023). A review of tourism and climate change mitigation: The scales, scopes, stakeholders and strategies of carbon management. Tourism Management, 95, 104681. https://doi.org/10.1016/j.tourman.2022.104681
- Grewe, V., Champougny, T., Matthes, S., Frömming, C., Brinkop, S., Søvde, O. A., Irvine, E. A., & Halscheidt, L. (2014). Reduction of the air traffic’s contribution to climate change: A React4c case study. Atmospheric Environment, 94, 616–625. https://doi.org/10.1016/j.atmosenv.2014.05.059
- Grübler, A., Nakićenović, N., & Victor, D. G. (1999). Dynamics of energy technologies and global change. Energy Policy, 27(5), 247–280. https://doi.org/10.1016/S0301-4215(98)00067-6
- Hamilton, J. M., Maddison, D. J., & Tol, R. S. J. (2004). The effects of climate change on international tourism (Working Paper FNU 36).
- Höhne, N., den Elzen, M., Rogelj, J., Metz, B., Fransen, T., Kuramochi, T., Olhoff, A., Alcamo, J., Winkler, H., Fu, S., Schaeffer, M., Schaeffer, R., Peters, G. P., Maxwell, S., & Dubash, N. K. (2020). Emissions: World has four times the work or one-third of the time. Nature, 579(7797), 25–28. https://doi.org/10.1038/d41586-020-00571-x
- IATA (2020). IATA technology roadmap 2050. Author.
- IATA (2021). Net-zero carbon emissions by 2050. Fly Net Zero. Retrieved from https://www.iata.org/en/pressroom/pressroom-archive/2021-releases/2021-10-04-03/
- IATA (2024). Worldwide airport slots. Fact sheet. Author.
- ICAO (2017). Information on the methodology and data used to develop the new aeroplane CO2 emissions standard. In EASA (Ed.), Notice of proposed amendment 2017-01. Implementation of the CAEP/10 amendments on climate change, emissions and noise (pp. 253–301). European Aviation Safety Agency.
- ICAO (2021). Carbon offsetting and reduction scheme for international aviation (CORSIA). Retrieved from https://www.icao.int/environmental-protection/CORSIA/Pages/default.aspx
- ICAO (2022a). 2022 Environmental report. Innovation for a green transition. Author.
- ICAO (2022b). Report of the high-level meeting on the feasibility of a long-term aspirational goal for international aviation CO2 emissions reductions (HLM-LTAG) (Doc. 10178). Author.
- Image-Team (2006). The Image 2.2 Implementation of the SRES scenarios. A comprehensive analysis of emissions, climate change and impacts in the 21st century (CD-ROM 500110001 (former 481508018)). Bilthoven.
- IPCC (2022). Climate change 2022: Mitigation of climate change. Contribution of Working Group III to the sixth assessment report of the Intergovernmental Panel on Climate Change. https://doi.org/10.1017/9781009157926
- Jacobs (2014). 8. Carbon: Assessment. Prepared for the Airports Commission.
- Joppa, L., Luers, A., Willmott, E., Friedmann, S. J., Hamburg, S. P., & Broze, R. (2021). Microsoft’s million-tonne CO2-removal purchase—Lessons for net zero. Nature, 597(7878), 629–632. https://doi.org/10.1038/d41586-021-02606-3
- Kahneman, D., & Tversky, A. (1979). Prospect theory: An analysis of decision under risk. Econometrica, 47(2), 263–291. https://doi.org/10.2307/1914185
- Keyßer, L. T., & Lenzen, M. (2021). 1.5 °C degrowth scenarios suggest the need for new mitigation pathways. Nature Communications, 12(1), 2676. https://doi.org/10.1038/s41467-021-22884-9
- Kotz, M., Levermann, A., & Wenz, L. (2024). The economic commitment of climate change. Nature, 628(8008), 551–557. https://doi.org/10.1038/s41586-024-07219-0
- Krey, V., & Riahi, K. (2009). Implications of delayed participation and technology failure for the feasibility, costs, and likelihood of staying below temperature targets–Greenhouse gas mitigation scenarios for the 21st century. Energy Economics, 31(Supplement 2), S94–S106. https://doi.org/10.1016/j.eneco.2009.07.001
- Lee, D. S., Fahey, D. W., Skowron, A., Allen, M. R., Burkhardt, U., Chen, Q., Doherty, S. J., Freeman, S., Forster, P. M., Fuglestvedt, J., Gettelman, A., De León, R. R., Lim, L. L., Lund, M. T., Millar, R. J., Owen, B., Penner, J. E., Pitari, G., Prather, M. J., Sausen, R., & Wilcox, L. J. (2021). The contribution of global aviation to anthropogenic climate forcing for 2000 to 2018. Atmospheric Environment, 244, 117834. https://doi.org/10.1016/j.atmosenv.2020.117834
- Lempert, R. J., Popper, S. W., & Bankes, S. C. (2003). Shaping the next one hundred years. New methods for quantitative, long-term policy analysis. RAND.
- Lenzen, M., Sun, Y.-Y., Faturay, F., Ting, Y.-P., Geschke, A., & Malik, A. (2018). The carbon footprint of global tourism. Nature Climate Change, 8(6), 522–528. https://doi.org/10.1038/s41558-018-0141-x
- Lyle, C. (2018). Beyond the ICAO’s CORSIA: Towards a more climatically effective strategy for mitigation of civil-aviation emissions. Climate Law, 8(1–2), 104–127. https://doi.org/10.1163/18786561-00801004
- Lyle, C. (2022). Capacity for a Code Red response – Sustainable tourism’s. Aviation emissions (Horizon paper).
- Märkl, R. S., Voigt, C., Sauer, D., Dischl, R. K., Kaufmann, S., Harlaß, T., … Le Clercq, P. (2023). Powering aircraft with 100% sustainable aviation fuel reduces ice crystals in contrails. EGUsphere, 2023, 1–37.
- Massy-Beresford, H. (2023). Flight cap debate highlights political pressure on airlines. Aviation Week & Space Technology, 38 (Jun 19 - July 2, 2023).
- Meinshausen, M., Smith, S. J., Calvin, K., Daniel, J. S., Kainuma, M. L. T., Lamarque, J.-F., Matsumoto, K., Montzka, S. A., Raper, S. C. B., Riahi, K., Thomson, A., Velders, G. J. M., & van Vuuren, D. P. P. (2011). The RCP greenhouse gas concentrations and their extensions from 1765 to 2300. Climatic Change, 109(1–2), 213–241. https://doi.org/10.1007/s10584-011-0156-z
- Millar, R. J., Fuglestvedt, J. S., Friedlingstein, P., Rogelj, J., Grubb, M. J., Matthews, H. D., Skeie, R. B., Forster, P. M., Frame, D. J., & Allen, M. R. (2017). Emission budgets and pathways consistent with limiting warming to 1.5 °C. Nature Geoscience, 10(10), 741–747. https://doi.org/10.1038/ngeo3031
- Miller, T. R., Chertow, M., & Hertwich, E. (2023). Liquid hydrogen: A mirage or potent solution for aviation’s climate woes? Environmental Science & Technology, 57(26), 9627–9638. https://doi.org/10.1021/acs.est.2c06286
- Ministerie van Infrastructuur en Waterstaat (2020). CO2-Plafond Internationale Luchtvaart [CO2-ceiling international aviation] (IENW/BSK-2020/238729). Author.
- Noland, J. K. (2021). Hydrogen electric airplanes: A disruptive technological path to clean up the aviation sector. IEEE Electrification Magazine, 9(1), 92–102. https://doi.org/10.1109/MELE.2020.3047173
- Nordhaus, W. (2008). A question of balance. Weighing the options on global warming policies. Yale University Press.
- Okesola, A. A., Oyedeji, A. A., Abdulhamid, A. F., Olowo, J., Ayodele, B. E., & Alabi, T. W. (2018). Direct air capture: A review of carbon dioxide capture from the air. IOP Conference Series: Materials Science and Engineering, 413, 012077. https://doi.org/10.1088/1757-899X/413/1/012077
- One Planet Network (2021). The Glasgow Declaration: A commitment to a decade of tourism climate action.
- Osborne, T. (2019). Startup sees fuel cell future for regional aviation. Aviation Week & Space Technology. Retrieved from https://aviationweek.com/future-aerospace/startup-sees-fuel-cell-future-regional-aviation?
- Papp, B., Neelis, I., & Heslinga, J. H. (2023). Don’t hate the players, hate the system! – The continuation of deep-rooted travel patterns in the face of shock events. International Journal of Contemporary Hospitality Management, 36(5), 1647–1664. https://doi.org/10.1108/IJCHM-09-2022-1177
- Patterson, B. D., Mo, F., Borgschulte, A., Hillestad, M., Joos, F., Kristiansen, T., Sunde, S., & van Bokhoven, J. A. (2019). Renewable CO2 recycling and synthetic fuel production in a marine environment. Proceedings of the National Academy of Sciences, 116(25), 12212–12219. https://doi.org/10.1073/pnas.1902335116
- Peeters, P. M. (2013). Developing a long-term global tourism transport model using a behavioural approach: Implications for sustainable tourism policy making. Journal of Sustainable Tourism, 21(7), 1049–1069. https://doi.org/10.1080/09669582.2013.828732
- Peeters, P. M. (2017). Tourism’s impact on climate change and its mitigation challenges. How can tourism become ‘climatically sustainable’? [PhD]. Delft University of Technology.
- Peeters, P. M., & Dubois, G. (2010). Tourism travel under climate change mitigation constraints. Journal of Transport Geography, 18(3), 447–457. https://doi.org/10.1016/j.jtrangeo.2009.09.003
- Peeters, P. M., & Middel, J. (2007, June 26–29). Historical and future development of air transport fuel efficiency. In R. Sausen, A. Blum, D. S. Lee, & C. Brüning (Eds.), Proceedings of an International Conference on Transport, Atmosphere and Climate (TAC) (pp. 42–47). DLR Institut für Physic der Atmosphäre.
- Peeters, P. M., Higham, J., Kutzner, D., Cohen, S. A., & Gössling, S. (2016). Are technology myths stalling aviation climate policy? Transportation Research Part D, 44, 30–42.
- Peeters, P. M., Szimba, E., & Duijnisveld, M. (2007). Major environmental impacts of European tourist transport. Journal of Transport Geography, 15(2), 83–93. https://doi.org/10.1016/j.jtrangeo.2006.12.007
- Peeters, P. M., Williams, V., & Gössling, S. (2007). Air transport greenhouse gas emissions. In P. M. Peeters (Ed.), Tourism and climate change mitigation. Methods, greenhouse gas reductions and policies (Vol. AC 6, pp. 29–50). NHTV.
- Peeters, P., & Papp, B. (2023). Envisioning tourism in 2030 and beyond. The changing shape of tourism in a decarbonising world. Travel Foundation.
- Rao, S., & Riahi, K. (2006). The role of non-CO2 greenhouse gases in climate change mitigation: Long-term scenarios for the 21st century. The Energy Journal, 27(3_suppl), 177–200. https://doi.org/10.5547/ISSN0195-6574-EJ-VolSI2006-NoSI3-9
- Reichmuth, J., Berster, P., & Gelhausen, M. C. (2011). Airport capacity constraints: Future avenues for growth of global traffic. CEAS Aeronautical Journal, 2(1–4), 21–34. https://doi.org/10.1007/s13272-011-0034-4
- Rockström, J., Gupta, J., Qin, D., Lade, S. J., Abrams, J. F., Andersen, L. S., Armstrong McKay, D. I., Bai, X., Bala, G., Bunn, S. E., Ciobanu, D., DeClerck, F., Ebi, K., Gifford, L., Gordon, C., Hasan, S., Kanie, N., Lenton, T. M., Loriani, S., … Zhang, X. (2023). Safe and just earth system boundaries. Nature, 619(7968), 102–111. https://doi.org/10.1038/s41586-023-06083-8
- Rogelj, J., Geden, O., Cowie, A., & Reisinger, A. (2021). Net-zero emissions targets are vague: Three ways to fix. Nature, 591(7850), 365–368. https://doi.org/10.1038/d41586-021-00662-3
- Schäppi, R., Rutz, D., Dähler, F., Muroyama, A., Haueter, P., Lilliestam, J., Patt, A., Furler, P., & Steinfeld, A. (2022). Drop-in fuels from sunlight and air. Nature, 601(7891), 63–68. https://doi.org/10.1038/s41586-021-04174-y
- Schwartz, P. (1996). The art of the long view: Planning for the future in an uncertain world. John Wiley & Sons, Ltd.
- Scott, D., & Gössling, S. (2015). What could the next 40 years hold for global tourism? Tourism Recreation Research, 40(3), 269–285., https://doi.org/10.1080/02508281.2015.1075739
- Scott, D., Hall, C. M., & Gössling, S. (2019). Global tourism vulnerability to climate change. Annals of Tourism Research, 77, 49–61. https://doi.org/10.1016/j.annals.2019.05.007
- Scott, D., Hall, C. M., Rushton, B., & Gössling, S. (2023). A review of the IPCC sixth assessment and implications for tourism development and sectoral climate action. Journal of Sustainable Tourism, in press, 1–18., https://doi.org/10.1080/09669582.2023.2195597
- Simorgh, A., Soler, M., González-Arribas, D., Matthes, S., Grewe, V., Dietmüller, S., Baumann, S., Yamashita, H., Yin, F., Castino, F., Linke, F., Lührs, B., & Meuser, M. M. (2022). A comprehensive survey on climate optimal aircraft trajectory planning. Aerospace, 9(3), 146. https://doi.org/10.3390/aerospace9030146
- Soria-Lara, J. A., & Banister, D. (2017). Participatory visioning in transport backcasting studies: Methodological lessons from Andalusia (Spain). Journal of Transport Geography, 58, 113–126. https://doi.org/10.1016/j.jtrangeo.2016.11.012
- Sterman, J. D. (2000). Business dynamics. Systems theory and modeling for a complex world. Irwin McGraw-Hill.
- Sun, Y.-Y., Gössling, S., Hem, L. E., Iversen, N. M., Walnum, H. J., Scott, D., & Oklevik, O. (2022). Can Norway become a net-zero economy under scenarios of tourism growth? Journal of Cleaner Production, 363, 132414. https://doi.org/10.1016/j.jclepro.2022.132414
- Tokarska, K. B., & Gillett, N. P. (2018). Cumulative carbon emissions budgets consistent with 1.5 °C global warming. Nature Climate Change, 8(4), 296–299. https://doi.org/10.1038/s41558-018-0118-9
- Tong, D., Zhang, Q., Zheng, Y., Caldeira, K., Shearer, C., Hong, C., Qin, Y., & Davis, S. J. (2019). Committed emissions from existing energy infrastructure jeopardize 1.5 °C climate target. Nature, 572(7769), 373–377. https://doi.org/10.1038/s41586-019-1364-3
- Tourism Panel on Climate Change (2023). Tourism and climate change stock take 2023 (D. Scott, S. Becken, & G. Lipman, Eds.). Tourism Panel on Climate Change.
- UNFCCC (1998). Kyoto Protocol to the United Nations Framework Convention on Climate Change.
- United Nations (2011). World population prospects: The 2010 revision. Retrieved from http://esa.un.org/unpd/wpp/unpp/panel_indicators.htm
- UNWTO (2016). Compendium of tourism statistics. Data 2010–2014 (2016 ed.). United Nations World Tourism Organisation.
- UNWTO (2019). Transport-related CO2 emissions of the tourism sector – Modelling results. United Nations World Tourism Organisation.
- UNWTO (2021). Recommendations for the transition to a green travel and tourism. United Nations World Tourism Organisation.
- UNWTO-UNEP-WMO (2008). Climate change and tourism: Responding to global challenges. United Nations World Tourism Organisation.
- Van Der Sman, E., Peerlings, B., Kos, J., Lieshout, R., & Boonekamp, T. (2021). Destination 2050. – A route to net zero European aviation (NLR-CR-2020-510). Royal NLR – Netherlands Aerospace Centre.
- Van Der Zee, D.-J., Holkenborg, B., & Robinson, S. (2012). Conceptual modeling for simulation-based serious gaming. Decision Support Systems, 54(1), 33–45. https://doi.org/10.1016/j.dss.2012.03.006
- Vorster, S., Ungerer, M., & Volschenk, J. (2012). 2050 Scenarios for long-haul tourism in the evolving global climate change regime. Sustainability, 5(1), 1–51. https://doi.org/10.3390/su5010001
- Warwick, G. (2022). The week in technology, June 20–24, 2022. Aviation Week & Space Technology. Retrieved from https://aviationweek.com/aerospace/week-technology-june-20-24-2022
- Warwick, N., Griffiths, P., Keeble, J., Archibald, A., Pyle, J., & Shine, K. (2022). Atmospheric implications of increased hydrogen use. University of Cambridge and University of Reading.
- World Bank Group (2010). Rising global interest in farmland. Can it yield sustainable and equitable benefits?World bank Group.
- World Economic Forum (2020). Clean skies for tomorrow: Sustainable aviation fuels as a pathway to net-zero aviation. Insight report. World Economic Forum.
- WTTC (2021). A net zero roadmap for travel & tourism. Proposing a new target framework for the travel & tourism sector. World Travel & Tourism Council.
- Xu, C., Kohler, T. A., Lenton, T. M., Svenning, J.-C., & Scheffer, M. (2020). Future of the human climate niche. Proceedings of the National Academy of Sciences, 117(21), 11350–11355. https://doi.org/10.1073/pnas.1910114117
- Yang, R., & Al-Qadi, I. L. (2017). Development of a life-cycle assessment tool to quantify the environmental impacts of airport pavement construction. Transportation Research Record: Journal of the Transportation Research Board, 2603(1), 89–97. https://doi.org/10.3141/2603-09
- Yeoman, I. (2012). 2050-Tomorrow’s tourism (Vol. 55). Channel View Publications.