Abstract
The ratio of nitrate consumption to phosphate consumption (the draw-down ratio) during phytoplankton growth is often assumed to equal the Redfield ratio of 16 mol N : 1 mol P. As such, both nutrients are expected to be exhausted simultaneously during phytoplankton blooms in ocean waters where upwelling brings nitrate and phosphate to the surface in the Redfield ratio. We examined the extent to which the draw-down ratio can vary from 16 : 1 in batch cultures of Chaetoceros muelleri grown under two irradiances, and initial NO3 −: PO4 3− ratios of 5 and 35 mol N mol P − 1 in the culture media. Cell growth and nutrient concentration were measured together with particulate C, N and P. Exponential phase growth rates of 0.3 day − 1 and 1.8 day − 1 were observed under low and high light, respectively, while initial NO3 −: PO4 3− ratios did not affect growth rates. The NO3 − to PO4 3− draw-down ratio differed significantly from the Redfield ratio, with the ratio increasing with decreasing irradiance and increasing initial N : P ratio. During nutrient-replete exponential phase, the particulate C-to-N ratio (C : N) was independent of irradiance and initial nitrate-to-phosphate ratios. However, particulate C : N increased from about 6 mol C (mol N)−1 at the nutrient-replete early exponential phase to around 20 at the beginning of the stationary phase. At the initial NO3 −: PO4 3− of 35, particulate N : P increased from an initial value of around 5 for both irradiances to 35 – 45 at the end of the exponential phase.
Introduction
The concept of constant elemental composition of planktonic biomass in the oceans of C: N : P of 106 : 16 : 1 (by atoms) was developed by Redfield (Citation1934) and has been a cornerstone in algal physiology and oceanography. Since the nitrate-to-phosphate ratio of the deep ocean closely resembles particulate N : P ratio, it has been inferred that both elements may potentially limit phytoplankton growth (Redfield et al., Citation1963). However, the relative uniformity, in a statistical sense, of marine particulate matter N : P and its relationship with the relative uniformity of nutrients in the deep sea, does little to explain whether the biological processes in the ocean are the cause or the effect of the N : P of the available nutrients (Redfield, Citation1958). The situation is probably more complex than that and the N : P of particulate matter may be both a causal agent and an outcome in the system of complex feedbacks that regulate nutrient cycling in the ocean.
The deviation of the particulate N : P in a water body from the Redfield ratio of 16 mol N (mol P) − 1 has often been used to differentiate between N-limitation (when N : P < 16) and P-limitation (N : P > 16; Tyrell, Citation1999, but see Hecky et al., Citation1993). This approach does not take into account the considerable variability in N : P that has been documented for algae and cyanobacteria (Geider & LaRoche, Citation2002). In particular, the transition point between N- and P-limitation, also termed the critical ratio, has been observed to deviate considerably from 16 : 1 (Terry et al., Citation1985). Downing & McCauley (Citation1992) implicate a ratio of 28 : 1 as transitional for N and P limitation for mixed lake phytoplankton. Furthermore, this approach conflicts with the inference from the resource-ratio theory developed for phytoplankton (Tilman, Citation1977, Citation1985) that changes in environmental ratios of two essential nutrients will cause changes in the phytoplankton community due to exploitative competition among species with different optimal nutrient ratios.
Chemical composition in phytoplankton cultures varies as a function of the degree of nitrogen or phosphorus limitation (Healey, Citation1985; Goldman, Citation1986). The range of C : N : P stoichiometry is much wider under nutrient-limited conditions than in nutrient replete cells (Geider & La Roche, Citation2002). For example Goldman et al. (Citation1979) reported an increase of the C : N ratio from 7.1 to 20 in Dunaliella tertiolecta in N-limited chemostats, as its growth rate decreased from 90% of maximum growth rate to 10%. In the same report, N : P of Monochrysis lutheri (now Pavlova lutheri) increased from 15 to 115 as its P-limited growth rate decreased. Perry (Citation1976) also reported similar increases in N : P and C : N ratios in relation to growth rate decrease. Under nutrient-replete conditions Burkhardt et al. (Citation1999) and Sakshaug et al. (Citation1983, Citation1984) have reported a rather more restricted range of N : P between 5 and 17 for a number of species.
It is generally agreed that the range of phytoplankton elemental N : P is restricted as the species-specific maximum growth rate is reached (Goldman, Citation1986). Elser et al. (Citation2003) showed that P-rich ribosomal RNA, growth rate and biomass P content were tightly coupled in diverse microbial, animal and plant species under P-limiting conditions. This coupling was relaxed when P was not limiting for growth. A review of biological stoichiometry and its link with growth rate of various widely diverse organisms can be found in Elser et al. (Citation2000) and Sterner & Elser (Citation2002). Since algae maintain their elemental composition within relatively narrow limits while growing in a range of combinations of light and nutrients, they must also have mechanisms for regulating uptake of each element (Laws & Bannister, Citation1980). However, there is a need to establish how narrow/wide these limits are. Do phytoplankton expend energy regulating the uptake of these elements irrespective of the environmental conditions or is there a ‘modus operandi’ within which little regulation is necessary? Evidence on luxury consumption (Elrifi & Turpin, Citation1985) and a recent model which shifts the emphasis to transport kinetics and efficiency of internal resource utilization (Flynn, Citation2002) support the suggestion of environmentally controlled regulation.
Here we examine how variations in the nitrate-to-phosphate ratio of the growth medium affect the particulate N : P in batch cultures of C. muelleri at irradiances that limit and saturate growth rate. Batch cultures have the advantage of mimicking the onset of nutrient limitation, while the cells are in a transient state. In that respect the conditions experienced by the alga during a typical period of batch culture growth resemble that of an oceanic bloom. The main focus is the extent to which the elemental stoichiometry of phytoplankton, at various growth stages reflects the nutrient elemental composition of the culture medium. In tandem with the increase in cell numbers, we monitored the decline of dissolved inorganic N and P and the accumulation of particulate N and P. Finally, we discuss the change of phytoplankton elemental composition during the course of the batch culture.
Materials and methods
Chaetoceros muelleri Lemmermann 1898 (CCAP 1010/3) was cultured in triplicate 3-litre batch cultures at irradiances of 50 (low light, LL) and 600 (high light, HL) μmol photons m − 2 s − 1 at 25°C and light : dark cycle of 14 : 10 h with continuous aeration, which maintained the culture medium at air equilibrium. The culture medium consisted of filtered (0.2 μm) seawater enriched to f/2 (Guillard & Ryther, Citation1962) concentrations of trace elements and vitamins. Nitrate was adjusted to about 100 μmol l − 1 and phosphate to either 20 or 2.9 μmol l − 1 to achieve the desired N : P ratios. Irradiance was measured with a QSL 4π (Biospherical Instruments) quantum meter, in the centre of the culture flask containing f/2 medium. Silicate was not added to the medium, but high residual silicate concentration in the seawater used, and dissolution from the glass culture vessel, maintained high concentrations (> 50 μmol l − 1) throughout the experiments (measured as described by Strickland & Parsons, Citation1972).
To initiate the experiments, batch cultures (3 l volume) were inoculated with exponentially growing cells (0.05 l volume) from cultures that had been grown in medium with the same NO3 −: PO4 3− as that of the experimental treatment.
Sampling was always carried out in the middle of the light phase. Algal cell concentration was determined daily using an improved Neubauer haemocytometer. Dissolved nitrate + nitrite and phosphate (Strickland & Parsons, Citation1972) were also determined daily. Particulate analyses were carried out daily in the HL experiments and every 3 days in the LL experiments. Particulate samples were collected on precombusted (at 450°C for 4 h) Whatman GF/F glass fibre filters. Particulate phosphorus was determined by the method of Solorzano and Sharp (Citation1980). Particulate carbon and nitrogen were analysed on a 440 Elemental Analyzer (Control Equipment Corporation, Cazenovia, NY, USA). After 16 days, one of the triplicate LL cultures with NO3 −: PO4 3− = 35 was lost. Due to the significantly longer duration of the LL experiments and the limited number of analyses that could be performed given the initial volume of the batch cultures, not all sets of analyses were carried out every time the culture was sampled. Significant differences (95% confidence limit) among the treatments were determined from the multiple comparisons between means T′-method (Sokal and Rohlf, Citation1995) and model II regression analysis and F-tests were employed to examine significant differences in nutrient draw down relationships (McArdle, Citation2003).
Results
Cell abundance increased () and inorganic nitrogen and phosphorus concentrations declined with time () in batch cultures of Chaetoceros muelleri. Attainment of stationary phase coincided with exhaustion of inorganic N in the HL, initial NO3 −: PO4 3− = 5 treatment, although inorganic P was very low (traces still detectable on days 5 and 6, ), but coincided with exhaustion of inorganic P in the HL, initial NO3 −: PO4 3− = 35 treatment about 1 day before inorganic N was exhausted. Under LL conditions, cells continued to divide for a few days after the inorganic nutrient concentrations declined to undetectable levels. Cell abundance (i.e. yield) in stationary phase cultures was similar in all four treatments, suggesting that the inorganic nitrogen provided in the culture medium limited biomass yield.
Fig. 1. Time course of cell abundance of Chaetoceros muelleri under HL (A) and LL (B), at initial inorganic N : P of 5 (circles) and 35 (triangles). Declines of nitrate and phosphate concentrations during exponential growth of C. muelleri under HL at initial inorganic N : P = 5 (C), LL at initial inorganic N : P = 5 (D), HL at initial inorganic N : P = 35 (E), and LL at initial inorganic N : P = 35 (F). Open symbols : HL, filled symbols : LL, squares : nitrate (left axis), rhombus : phosphate (right axis). Error bars indicate SD (n = 6).
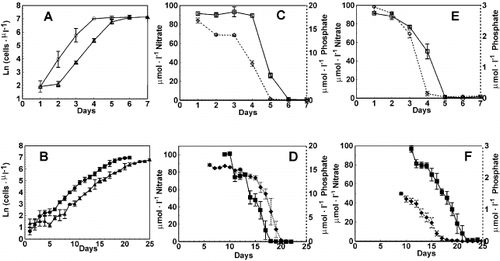
The maximum growth rate in the exponential phase () did not depend on the initial NO3 −: PO4 3− ratio (p > 0.05), but did depend on irradiance (p < 0.05) averaging 1.7 d − 1 at 600 μmol photons m − 2 s − 1 (HL), and 0.3 d − 1 at 50 μmol photons m − 2 s − 1 (LL). The growth rates reported here are in close agreement with those reported by Johansen et al. (Citation1990) and Fujii et al. (Citation1995) for this diatom.
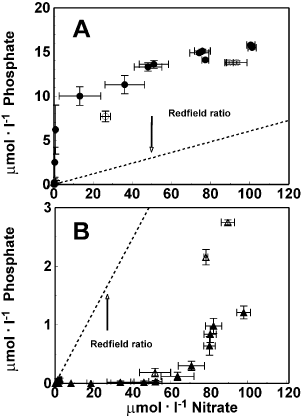
The relationship between phosphate and nitrate draw-down is illustrated in . At initial NO3 −: PO4 3− = 5 the cultures ran out of NO3 − first, before depleting the available PO4 3− (), while at initial NO3 −: PO4 3− = 35 the cultures ran out of PO4 3− first, before depleting NO3 − (). The NO3 −: PO4 3− draw-down ratio during exponential growth phase did not equal the initial inorganic NO3 −: PO4 3− ratio in any of the treatments ().
Table 1. Summary of early exponential phase and late stationary phase draw-down ratios of nitrogen and phosphorus together with particulate N : P and C : N for the various conditions used. Numbers in parentheses indicate SD (n ⩾ 4). N.A. = Not applicable
Fig. 2. Phosphate versus nitrate draw-down curves for Chaetoceros muelleri at initial N : P 5 (A), and 35 (B). Open symbols : HL, filled symbols : LL. Error bars indicate SD (n = 3). Redfield uptake rate line of 16 mol N per 1 mol P is included for reference.
The conversion of dissolved inorganic nitrate plus nitrite into particulate N can be assessed from . Dissolved inorganic N was initially converted to particulate organic N with an one-to-one relationship. However, about 20% of the particulate N was subsequently lost, without regeneration of nitrate or nitrite, by the end of the observation period.
Fig. 3. Relationship between particulate N and dissolved inorganic N for Chaetoceros muelleri for all culture conditions (A), and relationship between particulate P and dissolved inorganic P for N : P = 35 (B). Open symbols : HL, filled symbols : LL, Circles : N : P = 5, triangles : N : P = 35.
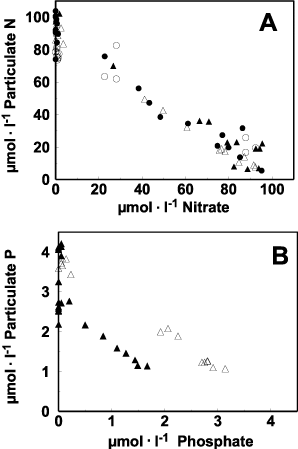
Particulate PO4 3− was measured only for the cultures at initial NO3 −: PO4 3− = 35. Under both light conditions, the slope of the relationship between appearance of particulate P and decline of PO4 3− was about 1.0 (). Despite starting with the same PO4 3− levels in the culture medium, there is an offset of about 1 μmol PO4 3− between the high and low light treatments. This offset may have resulted from conversion of phosphate into dissolved organic P during the lag phase in the LL cultures and subsequent conversion of this dissolved organic P into particulate P once all of the phosphate had been consumed at the end of exponential growth phase. Since organic phosphorus was not measured, we cannot confirm this suggestion.
The relationship between particulate organic C and particulate N was independent of both the nitrate:phosphate ratio of the medium and irradiance as long as nitrate was detectable (). Thereafter, continuing production of particulate organic C and loss of particulate N led to increases in C : N. The maximum organic C produced did not appear to differ between conditions, although the different duration of the HL and LL experiments renders direct comparison difficult. Initially cells in all conditions exhibited a C:N of about 6 (mol mol − 1), which increased to around 20 for the HL and 12 – 16 for the LL cultures ().
Fig. 4. Relationship between particulate organic carbon and particulate nitrogen concentrations for Chaetoceros muelleri for all culture conditions (A). Changes in cellular C:N for all cultures (B) and cellular N : P over time for the initial N : P 35 (C). Symbols as in Fig. 3. Redfield ratio lines of 6.6 mol C per 1 mol N, and of 16 mol N per 1 mol P are included for reference. Error bars indicate SD (n = 3).
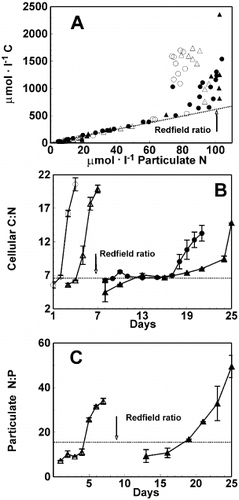
Particulate N : P was obtained only for the cultures where initial NO3 −: PO4 3− = 35 (). During the early stages of the exponential growth phase, particulate N : P equalled about 10 mol N (mol P)− 1. At the end of the exponential phase the particulate N : P had increased to around 35 for the HL set and 45 for the LL set of cultures. The nutrient (NO3 − : PO4 3−) draw-down ratios during exponential growth () were significantly higher than the measured particulate N : P (, ). Thus, the calculated draw-down ratios determined for the initial NO3 −: PO4 3− = 35 culture were not reflected in the particulate N : P.
Discussion
Conversion of inorganic nitrogen and phosphorus to particulate nitrogen and phosphorus
There have been few investigations of the efficiency of conversion of dissolved inorganic nutrients into particulate nutrients in phytoplankton. Our results show a near 1 : 1 relationship between nitrate and phosphate consumed and particulate N and P produced during the exponential growth phase in Chaetoceros muelleri, although there was subsequent loss of particulate N (about 20%) without remineralization of nitrate or nitrite. Raimbault et al. (Citation1999) describe a near 1 : 1 relationship for conversion of dissolved to particulate P in batch cultures of Dunaliella tertiolecta. Similarly, a near 1 : 1 relationship between dissolved and particulate N in cultures of Synechococcus sp., Phaeodactylum tricornutum and Tetraselmis maculata was reported by Pujo-Pay & Raimbault (Citation1994). The loss of particulate N, probably in the form of dissolved organic nitrogen (DON), not measured here, resembles the estimates from Pujo-Pay et al. (Citation1997) who showed that less than 10% of the nitrate uptake was released or excreted as DON. These results contrast with those of Bronk et al. (Citation1994), who reported high rates of DON in natural assemblages that may have included grazers as well as phytoplankton.
Variability of N : P under nutrient-replete conditions
As early as 1961, Parsons and co-workers documented a range of N : P from 5.6 to 16.5 for nine species of marine phytoplankton. Rhee (Citation1978) reported a mass ratio of N : P from 2.5 to 10 for N-limited Scenedesmus sp. at supply N : P < 30. More recently, Sakshaug and coworkers (Citation1983, Citation1984) documented a range from 7 to 17 in six species, and Burkhardt et al. (Citation1999) documented a range from 5.0 to 11.8 in seven species. Raimbault et al. (Citation1999) showed no clear trend with time in the particulate N : P in batch cultures of D. tertiolecta. Bertilson et al. (Citation2003), studying elemental composition of marine cyanobacteria, reported a relatively constrained C : N ratio between 5 and 5.7 and N : P ratios between 21 and 33 for one strain of Prochlorococcus sp. and two strains of Synechococcus sp.
Based on a review of the literature, Geider & La Roche (Citation2002) suggested that the range of N : P values under nutrient-replete conditions appeared to arise largely from interspecific or clonal variability rather than from differences in growth conditions or analytical techniques.
Recently Quigg et al. (Citation2003) examined some aspects of the evolutionary inheritance of elemental stoichiometry in marine phytoplankton. They examined 15 species from five algal phyla under one growth condition, and suggested that phylogenetic differences were reflected in macronutrient (carbon : nitrogen : phosphorus) stoichiometries. Almost identical C : N, C : P, and N : P ratios were observed for diatoms and prymnesiophytes (Quigg et al., Citation2003). However, data from the literature (), from experiments which were carried out under a variety of growth conditions, reveal a much greater variability in these ratios. The approach of Quigg et al. (Citation2003) to select one growth condition for the widely different species, probably masks this variability. Physical and/or chemical factors that may affect the elemental composition of nutrient-replete phytoplankton include nutrient concentration ratios, daylength, irradiance, salinity and temperature. A limited amount of data suggests that under nutrient-replete conditions, the N : P ratio in a particular species is largely independent of the initial inorganic NO3 −: PO4 3− ratio in the culture media. For example, the N : P ratio of Emiliania huxleyi varied by less than 20% when the NO3 −: PO4 3− ratio in the growth medium ranged from 4 to 100, and the N : P ratio of Amphidinium carterae varied by less than 10% when the medium NO3 − : PO4 3− ratio ranged from 4 to 20 (Sakshaug et al., Citation1983).
Table 2. Summary of elemental composition of diatoms and dinoflagellates. Original data are from Burkhardt et al. (Citation1999), Goldman et al. (Citation1992), La Roche et al. (Citation1993), Nielsen (Citation1992), Parsons et al. (Citation1961), Sakshaug et al. (Citation1983), Terry et al. (Citation1983)
We observed a particulate N : P of about 10 at low and high light in the cultures with initial nitrate:phosphate = 35. However, the NO3 −:PO4 3− draw-down ratio under these conditions was much higher (; ). This mismatch between N : P determined from nutrient draw-down and particulate analyses suggests high production of P-rich dissolved organic matter during the lag and early exponential phase of the LL cultures, consistent with the suggestion made on the basis of data in . This mismatch may also be due to curve fitting error associated with rapid changes and high relative degree of scatter in the observations (), initially different intracellular nitrogen and phosphorus pools and/or differences in consumption/production of dissolved organic N and/or P.
Variability of C : N under nutrient replete conditions and temporal changes of C:N in culture
Particulate C : N was found to be independent of irradiance and initial nitrate:phosphate of the culture medium, in the exponentially growing cultures (). Similarly, C : N was not affected by irradiance or daylength in Gyrodinium aureolum (Nielsen, Citation1996) or in natural assemblages confined in plastic spheres (Antia et al., Citation1963; Banse, Citation1974). However, in nutrient-replete Phaeodactylum tricornutum, C:N increased with irradiance from 5.0 to 7.7 in one strain, and 6.3 to 6.9 in a second strain (Terry et al., Citation1983); none-the-less, this is still a relatively constrained range.
There was a dramatic increase in the C : N ratio of C. mulleri following depletion of inorganic N from the medium. Raimbault et al. (Citation1999) also showed an increase of C : N over time in batch cultures of Dunaliella tertiolecta. These C : N ratios are consistent with the range of 4 to 20 that has been reported in the literature for various laboratory cultures and marine particulate matter (Geider & La Roche, Citation2002).
Summary
We conclude that, in Chaetoceros muelleri, nitrate and phosphate uptake and cellular stoichiometry of C : N : P were simultaneously influenced by light and dissolved inorganic N : P of the surrounding medium. Particulate C : N : P under some conditions differed from the Redfield proportions. Under nutrient-replete conditions, particulate C : N was independent of light conditions and initial nitrate:phosphate. The final N : P of the particulate matter reflected the initial nitrate-to-phosphate ratio of the medium, consistent with Rhee's (Citation1978) suggestion. Therefore, we suggest that, on larger time scales, the observed N : P of particulate matter is the result of the nutrient profile of the water body, rather than the nutrient profile being a reflection of some intrinsic, fixed elemental composition of the phytoplankton. Our results do not exclude the possibility that the N : P of particulate matter is both a causal agent and an outcome in oceanic nutrient cycling. However, light levels, or other variables, through the control of growth, may determine how long it takes to deplete inorganic nutrients.
Acknowledgements
This study was funded by NERC (UK) grant No NER/A/S/2000/00351. We would like to thank Dr H. McIntyre for his help on the CHN analyses and two anonymous reviewers for helpful comments on the manuscript.
Related Research Data
References
References
- Antia , NL , McAllister , CD , Parsons , TR , Stephens , K and Strickland , JDH . 1963 . Further measurements of primary production using a large-volume plastic sphere . Limnol. Oceanogr , 8 : 166 – 183 .
- Banse , K . 1974 . On the interpretation of data for the carbon-to-nitrogen ratio of phytoplankton . Limnol. Oceanogr , 19 : 695 – 699 .
- Bertilsson , S , Berglund , O , Karl , DM and Chisholm , SW . 2003 . Elemental composition of marine Prochlorococcus and Synechococcus: Implication for the ecological stoichiometry of the sea . Limnol. Oceanogr , 48 : 1721 – 1731 .
- Bronk , DA , Glibert , PM and Ward , BB . 1994 . Nitrogen uptake, dissolved organic nitrogen release and new production . Science , 265 : 1843 – 1846 .
- Burkhardt , S , Zondervan , I and Riebesell , U . 1999 . Effect of CO2 concentration on C : N : P ratio in marine phytoplankton: A species comparison . Limnol. Oceanogr , 44 : 683 – 690 .
- Downing , JA and McCauley , E . 1992 . The nitrogen : phosphorus relationship in lakes . Limnol. Oceanogr , 37 : 936 – 945 .
- Elrifi , IR and Turpin , DH . 1985 . Steady-state luxury consumption and the concept of optimum nutrient ratios – a study with phosphate and nitrate limited Selenastrum minutum (Chlorophyta) . J. Phycol , 21 : 592 – 602 .
- Elser , J , Sterner , RW , Gorokhova , E , Fagan , W , Markow , T , Cotner , J , Harrison , J , Hobbie , S , Odell , G and Weider , L . 2000 . Biological stoichiometry from genes to ecosystems . Ecology Letters , 3 : 540 – 550 .
- Elser , J , Acharya , K , Kyle , M , Cotner , J , Makino , W , Markow , T , Watts , T , Hobbie , S , Fagan , W , Schade , J , Hood , J and Sterner , RW . 2003 . Growth rate-stoichiometry couplings in diverse biota . Ecology Letters , 6 : 936 – 943 .
- Flynn , KJ . 2002 . How critical is the critical N : P ratio? . J. Phycol , 38 : 961 – 970 .
- Fujii , S , Nishimoto , N , Notoya , A and Hellebust , JA . 1995 . Growth and osmoregulation of Chaetoceros muelleri in relation to salinity . Plant Cell Physiol , 36 : 759 – 764 .
- Geider , RJ and La Roche , J . 2002 . Redfield revisited: variability of C : N : P in marine microalgae and its biochemical basis . Eur. J. Phycol , 37 : 1 – 17 .
- Goldman , JC . 1986 . On phytoplankton growth rates and particulate C : N : P ratios at low light . Limnol. Oceanogr , 31 : 1358 – 1363 .
- Goldman , JC , McCarthy , JJ and Peavey , DG . 1979 . Growth rate influence on the chemical composition of phytoplankton in oceanic waters . Nature , 279 : 210 – 215 .
- Goldman , JC , Hansell , DA and Dennett , MR . 1992 . Chemical characterization of 3 large oceanic diatoms: potential impact on water column chemistry . Mar. Ecol. Prog. Ser , 88 : 257 – 270 .
- Guillard , RRL and Ryther , RH . 1962 . Studies of marine plankton diatoms. I Cyclotella nana Hustedt and Detonula confervacea (Cleve) . Gran. Can. J. Microbiol , 8 : 229 – 239 .
- Healey , PF . 1985 . Interacting effects of light and nutrient limitation on the growth rate of Synechococcus linearis (Cyanophyceae) . J. Phycol , 21 : 134 – 146 .
- Hecky , RE , Campbell , P and Hendzel , LL . 1993 . The stoichiometry of carbon, nitrogen, and phosphorus in particulate matter of lakes and oceans . Limnol. Oceanogr , 38 : 709 – 724 .
- Johansen , JR , Barclay , WR and Nagle , N . 1990 . Physiological variability within ten strains of Chaetoceros muelleri (Bacillariophyceae) . J. Phycol , 26 : 271 – 278 .
- La Roche , J , Geider , RJ , Graziano , LM , Murray , H and Lewis , K . 1993 . Induction of specific proteins in eukaryotic algae grown under iron-, phosphorus-, or nitrogen-deficient conditions . J. Phycol , 29 : 767 – 777 .
- Laws , EA and Bannister , TT . 1980 . Nutrient- and light-limited growth of Thalassiosira fluviatilis in continuous culture, with implications for phytoplankton growth in the ocean . Limnol. Oceanogr , 25 : 457 – 473 .
- McArdle , BH . 2003 . Lines, models, and errors: Regression in the field . Limnol. Oceanogr , 48 : 1363 – 1366 .
- Nielsen , MV . 1992 . Irradiance and daylength effects on growth and chemical composition of Gymnodinium aureolum Hulburt in culture . J. Plankton Res , 14 : 811 – 820 .
- Nielsen , MV . 1996 . Growth and chemical composition of the toxic dinoflagellate Gymnodinium galatheanum in relation to irradiance, temperature and salinity . Mar. Ecol. Prog. Ser , 136 : 205 – 211 .
- Parsons , TR , Stephens , K and Strickland , JDH . 1961 . On the chemical composition of eleven species of marine phytoplankters . J. Fish. Res. Bd. Can , 18 : 1001 – 1016 .
- Perry , MJ . 1976 . Phosphate utilization by an oceanic diatom in phosphorus-limited chemostat culture and in the oligotrophic waters of the North Pacific . Limnol. Oceanogr , 21 : 88 – 107 .
- Pujo-Pay , M and Raimbault , P . 1994 . Improvement of the wet-oxidation procedure for simultaneous determination of particulate organic nitrogen and phosphorus collected on filters . Mar. Ecol. Prog. Ser , 105 : 203 – 207 .
- Pujo-Pay , M , Conan , P and Raimbault , P . 1997 . Excretion of dissolved organic nitrogen by phytoplankton assessed by wet oxidation and 15N tracer procedures . Mar. Ecol. Prog. Ser , 153 : 99 – 111 .
- Quigg , A , Finkel , Z , Irwin , A , Rosenthal , Y , Ho , T , Reinfelder , J , Schofield , O , Morel , F and Falkowski , P . 2003 . The evolutionary inheritance of elemental stoichiometry in marine phytoplankton . Nature , 425 : 291 – 294 .
- Raimbault , P , Diaz , F , Pouvesle , W and Boudjellal , B . 1999 . Simultaneous determination of particulate organic carbon, nitrogen and phosphorus collected on filters, using a semiautomated wet-oxidation method . Mar. Ecol. Prog. Ser , 180 : 289 – 295 .
- Redfield AC 1934 On the proportions of organic derivatives in sea water and their relation to the composition of plankton In James Johnstone Memorial Volume (Daniel, R.J. editor) 176 192 Univ. of Liverpool
- Redfield , AC . 1958 . The biological control of chemical factors in the environment . Amer. Sci , 46 : 205 – 221 .
- Redfield AC Ketchum BH Richards FA 1963 The influence of organisms on the composition of seawater In The Sea (M.N. Hill, editor) vol. 2 26 77 Interscience
- Rhee , GY . 1978 . The effect of N : P atomic ratios and nitrate limitation on algal growth, cell composition, and nitrate uptake . Limnol. Oceanogr , 23 : 10 – 25 .
- Sakshaug , E , Andersen , K , Myklestad , S and Olsen , Y . 1983 . Nutrient status of phytoplankton communities in Norwegian waters (marine, brackish, and fresh) as revealed by their chemical composition . J. Plankton Res , 5 : 175 – 196 .
- Sakshaug , E , Granéli , E , Elbrächter , M and Kayser , H . 1984 . Chemical composition and alkaline phosphatase activity of nutrient-saturated and P-deficient cells of four marine dinoflagellates . J. Exp. Mar. Biol. Ecol , 77 : 241 – 254 .
- Sokal RR Rohlf FJ 1995 Biometry. The principles and practice of statistics in biological research Third edition, W. H. Freeman & Co, New York
- Solórzano , L and Sharp , JH . 1980 . Determination of total dissolved phosphorus and particulate phosphorus in natural waters . Limnol. Oceanogr , 25 : 754 – 758 .
- Sterner RQ Elser JJ 2002 Ecological Stoichiometry: the biology of elements from molecules to the biosphere Princeton University Press, New Jersey, USA
- Strickland JDH Parsons TR 1972 A practical handbook of seawater analysis Fisheries Research Board of Canada, Ottowa, Canada
- Terry , KL , Hirata , J and Laws , EA . 1983 . Light-limited growth of two strains of the marine diatom Phaeodactylum tricornutum Bohlin: chemical composition, carbon partitioning and the diel periodicity of physiological processes . J. Exp. Mar. Biol. Ecol , 68 : 323 – 329 .
- Terry , KL , Laws , EA and Burns , DJ . 1985 . Growth rate variation in the N : P requirement ratio of phytoplankton . J. Phycol , 21 : 323 – 329 .
- Tilman , D . 1977 . Resource competition between planktonic algae: An experimental and theoretical approach . Ecology , 58 : 338 – 348 .
- Tilman , D . 1985 . The resource-ratio hypothesis of plant succession . Amer. Nat , 125 : 827 – 852 .
- Tyrell , T . 1999 . The relative influences of nitrogen and phosphorus on oceanic primary production . Nature , 400 : 525 – 531 .