Abstract
Conventional and landmark-based geometric morphometric approaches were used to clarify the taxonomic identity of a centric diatom morph. This morph, found in cultures isolated from the Geeste estuary (northern Germany), showed an intermediate valve morphology between that of typical specimens of Cyclotella meneghiniana Kützing and of Cyclotella scaldensis Muylaert & Sabbe. Its internal valve ultrastructure was compared to that of cells from (1) cultures of C. meneghiniana isolated from the same field samples and grown in the same conditions, (2) field material from the samples from which the cultures were isolated, and (3) a sample from the type locality of C. scaldensis. The morphometric analyses were used to determine (1) whether morphological variation of these morphs was continuous, or whether there were distinct morphological groups, and (2) how effective the alternative morphometric approaches were in answering this question. Both approaches proved informative and their results complemented each other, supporting the conclusion that three distinct size-reduction series were present in the samples investigated. Since the different morphs occurred sympatrically, we suggest that they probably belong to three reproductively isolated species.
Introduction
Cyclotella meneghiniana Kützing is one of the classically problematic diatom species. To investigate the variation in what we believed to be a single population of this species, we established a collection of clonal cultures from an estuarine locality in Northern Germany. Scanning electron microscopy revealed that some of these strains differed morphologically from typical C. meneghiniana. Morphometric analyses were initiated to clarify the taxonomic identity of these cultures.
The valve morphology of these cultures resembled that of Cyclotella scaldensis Muylaert & Sabbe (Citation1996), but did not differ as markedly from C. meneghiniana as the former, based on the above authors’ illustrations. We therefore refer to this morph as ‘ambiguous’. SEM observations of a sample from the River Schelde (the type locality of C. scaldensis) showed that it contained valves similar to our ‘ambiguous’ morph, as well as others that we considered characteristic of C. scaldensis. However, these observations did not unambiguously reveal whether there was a continuum of morphological variation from typical C. meneghiniana through the ‘ambiguous’ morphology to typical (‘extreme’) C. scaldensis, or if these were distinct morphological groups (morphospecies). We therefore attempted to characterise valve morphology quantitatively to clarify this question. Based on our preliminary observations, we assigned specimens to three morphs (C. meneghiniana, the ‘ambiguous’ morph, or more characteristic C. scaldensis), and also grouped them according to their origin, i.e., cultures, original samples from the River Geeste, and from the River Schelde sample. Original field samples were included to determine whether any aspects of our results were culture-induced.
We used both conventional and geometric morphometric approaches to characterise inner valve face morphologies. Conventional morphometric techniques have proven effective for clarifying species limits, especially in the centric genus Stephanodiscus (Theriot & Stoermer, Citation1984a, Citationb), as well as other diatom genera, and to investigate intraspecific morphological variation (Theriot, Citation1987; Hausmann & Lotter, Citation2001; Droop, Citation1995; Teubner, Citation1995). Whereas the data used for such analyses can include a diverse collection of measurements, counts and angles, geometric morphometrics place greater emphasis on a more complete use of two- or three-dimensional geometric information (Rohlf & Marcus, Citation1993). One such group of methods describes outline shape using Legendre polynomials or Fourier analysis, and has been used in quantitative studies of outline shape in pennate diatoms (Pappas et al., Citation2001; Rhode et al., Citation2001; du Buf & Bayer, Citation2002). We used another methodology called thin plate splines (Bookstein, Citation1991; Dryden & Mardia, Citation1998). Here, the shapes studied are modelled as geometric configurations of landmarks (reliably identifiable points that are assumed to be homologous in the range of specimens investigated), and their differences as ‘smooth’ deformations. Shape variation within a sample of landmark configurations is described in terms of parameters that describe these deformations and can be analysed with classical multivariate analytical methods (Dryden & Mardia, Citation1998, for methodological details). To our knowledge, thin-plate splines and landmark-based morphometric analyses of valve ultrastructure have not previously been used for diatoms.
Materials and methods
Samples
Two net plankton and two benthic samples were taken from the lowest, tidal stretch of the River Geeste in Bremerhaven, northern Germany, on 9 July 2001. Plankton samples were collected from shore using a 20 µm mesh plankton net. Benthic samples were collected by scraping material from the surface of stones and wooden structures close to shore. A sediment sample from the Schelde estuary (Belgium) from December 2002 was provided by K. Muylaert.
Cultures
Cultures were initiated from samples taken from the River Geeste using a modified DY-IV medium (Andersen et al., Citation1997) prepared with filter-sterilised water from the sampling sites. After 1–4 days, individual cells were isolated from these initial cultures with a micropipette and repeatedly washed in fresh medium. Cultures were maintained at 15°C in a growth chamber with a 14 : 10 light–dark cycle at a photon flux density of 30–40 µmol m−2 s−1. Twenty cultures were used in the analyses, fifteen of which were identified as C. meneghiniana and five as the other, ‘ambiguous’ morph. Cultures or live material of the third morph (C. scaldensis) were not available for our study.
Electron microscopy
Diatom valves from field samples and cultures were cleaned using 30% H2O2 and five drops of HCl, rinsed in distilled water and dried on coverslips, sputter coated in an Emscope SC500 Modular Sputter Coater, and examined with a PHILIPS XL30 ESEM operated at 10 kV accelerating voltage. For all morphometric analyses, scanning electron micrographs of inner valve views were used, as these provided the greatest number of possibly useful characters, including alveolar morphology, the frequency of marginal fultoportulae (FPs) and morphology of the rimoportulae (RPs). All SEM photographs and data sheets are available from B. Beszteri upon request.
Conventional morphometrics
The Microscope Control software of the SEM was used for measurements. The image of each specimen measured was saved as a tiff file. For all measurements and photographs, each cell was rotated so that the RP was located at the bottom of the image to standardise diameter measurements. Data from 312 specimens were used for the analyses, including cultures as well as field samples. Valves were assigned to one of the three morphs before morphometric analysis.
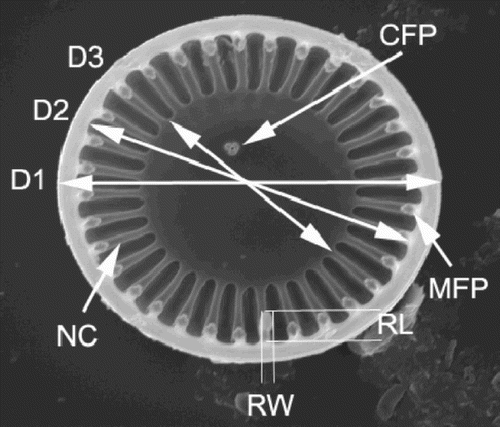
Variables used are shown in . Diameter measurements (D1, D2, D3) were taken in horizontal and vertical directions on the images and averaged to reduce measurement error and error due to the valves not lying absolutely perpendicular to the electron beam. Ratios of valve diameters (D1) measured in the two directions were calculated and specimens whose ratio was smaller than 0.95 (an arbitrarily chosen limit to exclude tilted specimens) were excluded from further analyses.
Fig. 1. Variables used for the conventional morphometric analyses, illustrated on a C. meneghiniana valve. D1 – valve diameter; D2 – valve diameter measured between the inner edges of the mantle (i.e., D1 minus twice the mantle thickness); D3 – diameter of the central area; RW – width of the rimoportula; RL – length of the rimoportula; NC – number of costae; MFP – number of marginal fultoportulae; CFP – number of central fultoportulae.
Principal component analysis (PCA) was calculated from the correlation matrix of the variables. PCA scores were calculated by postmultiplying the data matrix (with rows corresponding to cases and columns to variables) by the matrix of the eigenvectors of the correlation matrix without any further scaling. Canonical variate analysis was used to ordinate specimens to maximise separation of morphs with respect to their within-group variances. The size ranges of the morphs were similar (see below) and they overlapped, so no correction for this effect was used (dos Reis et al., Citation1990). The analyses were carried out with MATLAB 6 (MathWorks Inc., Natick, MA, USA), using several MATLAB functions of R. Strauss (available at http://www.biol.ttu.edu/Strauss/Matlab/matlab.htm).
Discriminant analyses were performed using SYSTAT 10 (Version 10, SPSS Inc.) in order to test the distinctness of the groups. A jack-knifed discriminant analysis was also performed with SYSTAT 10, in which one of the specimens in every run was excluded from the calculation of the Mahalanobis distances from group centroids and was subsequently classified using the values obtained from the rest of the sample. This might be considered a more conservative indication of group distinctness.
Diagrams of valve morphologies were constructed in the following way to illustrate the results: three concentric circles with diameters D1, D2 and D3, were drawn to represent the valve outline, the inner rim of the valve mantle and the central area, respectively. The area between the second and third of these circles was divided into NC ‘triangles’, representing the alveoli. The RPs were represented by equilateral triangles with a height of RL and a base length of RW. The value of MFP was used to calculate the reciprocal of the frequency of marginal FPs, (NC-1)/MFP. This value was rounded to the nearest integer, M, and a star, representing a FP, was drawn at every Mth costa.
The diagrams were used to reconstruct morphologies corresponding to points in the PCA scatter plot. Coordinates of the points on all except the two first principal component axes were fixed to zero, and points were projected back into the space of the original measurements. For this, row vectors of PCA scores were post-multiplied by the transpose of the matrix of eigenvectors, the entries of the resulting vector multiplied by the standard deviations of the corresponding column of the original matrix and added to the corresponding column means. The scores, thus calculated, were used to draw valve diagrams as described above.
Geometric morphometrics
The images used for the geometric morphometric comparisons were a subset of those used for the above conventional analyses (193 specimens). Landmark coordinates were digitised on the images and scale factors were recorded for each by measuring the length of the scale bar in the picture in pixel units using the software tpsDig (http://life.bio.sunysb.edu/morph/). The approach chosen for this study models ‘shape’ as point (landmark) configurations and obtains a multivariate dataset describing shape variation using smooth deformations (Bookstein, Citation1991; Dryden & Mardia, Citation1998). This dataset can then be analysed with conventional multivariate data analysis methods. For digitising landmarks and performing much of the following calculations, the tps series of programs (by F. J. Rohlf, http://life.bio.sunysb.edu/morph/) was used.
The landmarks recorded are listed in and their position on a valve is shown in . Landmark 1, the centre of the valve, was found by digitising the valve outline and calculating the coordinates of its centroid using the tpsDig program. To be able to use landmark 7, specimens without a FP at the costa adjacent to the RP had to be excluded from the analyses. However, it seemed to be the rule in all three morphs that there was a FP at both costae neighbouring the RP, and only eight specimens were excluded for this reason.
Fig. 2. Positions of landmarks 2 to 9 used for the geometric morphometric analyses shown on a valve from the ‘ambiguous’ morph. Landmark 1, the midpoint of the valve is not shown here. describes positioning of the landmarks.
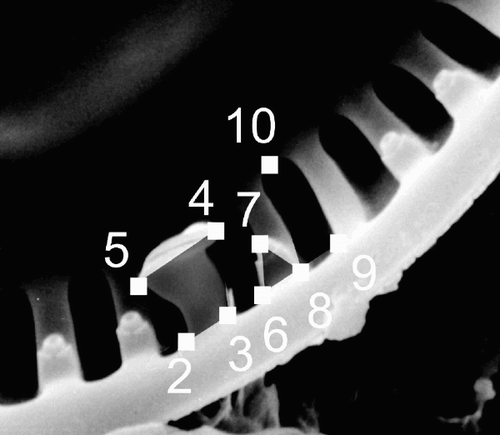
Table 1 . Landmark points recorded for the geometric morphometric analyses. Their position is described on a valve, the RP of which was oriented towards the bottom of the image. See also
Landmarks were chosen around the RP as a point of correspondence between valves, since only one RP is present in valves of the group studied. In order to characterise alveolar morphology (landmarks 8–10), the alveoli adjacent to the RP might have appeared the most appropriate following this line of thought, but in many valves with large, bent RPs, the inner part of those (where landmark 10 would be) was obscured by the head of the RP. We therefore chose to use the second alveolus.
A multivariate dataset describing shape variability was obtained by the use of partial warp scores (Dryden & Mardia, Citation1998; Rohlf, Citation1999). With this technique, the thin-plate spline, an interpolating function minimising bending energy, was fitted to the landmark configurations of the sample, using the calculated average landmark configuration as reference. Shape variation was described in terms of the parameters of the fitted functions. If shape variation in a sample is sufficiently small, the data thus obtained are a good approximation of the exact non-linear shape space which uses Procrustes distance as a metric (Dryden & Mardia, Citation1998; Rohlf, Citation1999). To verify that this was the case here, the slope of the regression line of tangent space distances against Procrustes distances and their uncentred correlation coefficient were calculated using tpsSmall (http://life.bio.sunysb.edu/morph/). The slope of the regression line was 0.99, the correlation coefficient 0.99996, and inspection of the scatter of points revealed no large deviations of single points. These were accepted as indications of a good fit.
The use of partial warp scores allows for differential weighting of localised or global shape differences in a principal component (also called relative warp) analysis (Bookstein, Citation1991; Rohlf, Citation1993). With positive values of the weighting parameter α, partial warps with smaller bending energy, describing more global shape differences are given more weight, whereas with negative α more localised differences can be emphasised. Because we expected that the most interesting variation in our sample would be found in small-scale features, such as the shape of the RP or alveoli, we used α = −1 for the relative warp analysis.
To analyse shape differences further, the partial warp scores were used as an ordinary multivariate dataset, in principle as described above for the conventional dataset. Centroid size and valve diameter were used as size measures to describe size-dependent morphological variation. Centroid size is a size measure generally used in geometric morphometric studies – it is calculated as the square root of the sum of squared distances of a specimen's landmarks from their centroid (Dryden & Mardia, Citation1998). Valve diameter, on the other hand, is the most readily available measure of cell size in these diatoms. To compare allometry, shape change with size within the three groups, the partial warp scores were regressed on both size measures (centroid size and valve diameter) as well as on their logarithms using tpsRegr (http://life.bio.sunysb.edu/morph/). A multivariate analysis of covariance was performed to test the null hypothesis of equal slopes of the regression lines in the three morphs. Of the different size measures used, the logarithm of valve diameter explained the most variance of the partial warp scores (data not shown), and was therefore used for the illustrations. Diagrams depicting shape changes from the overall mean landmark configuration to those predicted by the regression for different sizes using the thin-plate spline interpolation (Bookstein, Citation1991; Dryden & Mardia, Citation1998) were used to summarise differences in morphological changes with size reduction.
Results
Description of the morphs
We refer to the three morphs as ‘ambiguous’ and ‘extreme’ morphs of C. scaldensis, and C. meneghiniana. The ‘ambiguous’ morph included the ambiguously identified valves found in cultures isolated from the River Geeste and in the original samples, as well as similar valves from the River Schelde. Valves of the ‘extreme’ morph were predominantly found in the Schelde sample, only four valves were encountered in the Geeste material, and none in culture. C. meneghiniana valves included those unambiguously identified as belonging to this species, from cultures and from field samples from both rivers.
All three morphs showed the typical features of the C. meneghiniana complex (–; Håkansson, Citation1990; Håkansson & Chepurnov, Citation1999; Håkansson, Citation2002). Valves were areolated peripherally but not in the central area (apart from some of the smallest valves, <7 µm diameter). The central area was smooth on the inside, and smooth to colliculate (rugose) on the outside (–, –, –; Muylaert & Sabbe, Citation1996). It was tangentially undulate, with the central FPs in the elevated part when observed from the valve exterior. The single RP was found in front of the elevated part of the undulation and the central FPs. The marginal FPs occurred with varying frequency on the costae, spines were often inserted at their outer openings. All FPs had three satellite pores. When observed from the valve exterior, costae corresponded to the furrows in the undulating striated peripheral area.
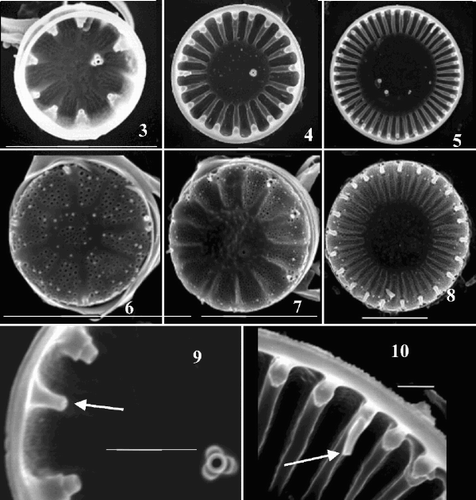
Figs 3–10. Scanning electron micrographs of valves from Cyclotella meneghiniana cultures. –. Valve interiors. –. Valve exteriors over the size range. –, Detail of interior margins showing rimoportulae (arrows) in an extremely small () and a larger () valve. Scale bars represent 5 µm (–) and 1 µm (, ).
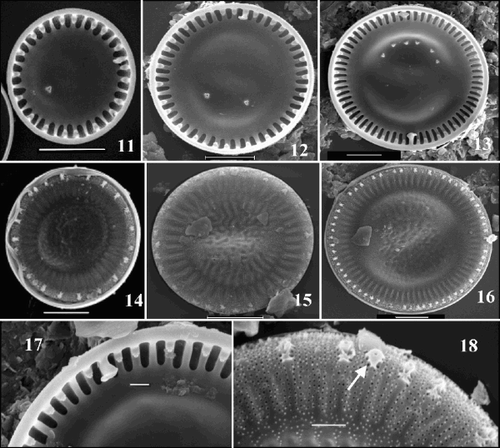
Figs 11–18. SEM images of valves of the ‘ambiguous’ morph of Cyclotella scaldensis. –. Valve interiors. –. Valve exteriors over the size range. . Interior margin showing rimoportula. . Exterior margin showing process openings; RP opening is marked by an arrow. Scale bars represent 5 µm (–) and 1 µm (, ).
Figs 19–26. SEM images of valves of the ‘extreme’ morph of Cyclotella scaldensis. –. Valve interiors. –. Valve exteriors over the size range. . Exterior margin, showing process openings; RP opening marked by an arrow. . Interior margin with RP and two neighbouring FPs. Scale bars represent 5 µm (–) and 2 µm (, ).
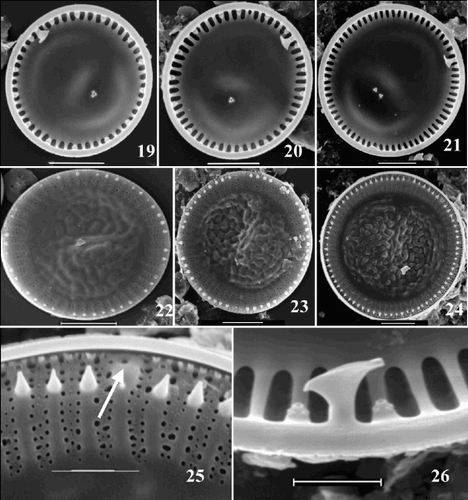
The following differences could be observed between the morphs: C. meneghiniana had long alveolar chambers (–, ), with open central portions. In both C. scaldensis morphs the central parts of the alveolar chambers were covered by central lamina (–, , and –, , respectively). The RP lips were radially oriented in C. meneghiniana (), but twisted in the C. scaldensis morphs (, ). In C. meneghiniana, marginal FPs were found on almost every costa (–), whereas they occurred on every second to fourth in the C. scaldensis morphs (–, –).
The most marked differences between the two C. scaldensis morphs were found in the frequency of the marginal FPs and in RP morphology. The ‘ambiguous’ morph had more frequent marginal FPs than the ‘extreme’ (–, –). The number of central FPs also differed in the two morphologies: valves of the ‘ambiguous’ morph had fewer than valves of the same diameter assigned to the ‘extreme’ morph (–, –). RPs had somewhat undulate lips in the ‘ambiguous’ morph (), whereas in the ‘extreme’ morph, they were straighter and wider ().
Examining the figures in Muylaert & Sabbe (Citation1996), we found that their concept of C. scaldensis probably included both morphs as described above. They included a valve interior that we would recognise as the ‘extreme’ morph (Muylaert & Sabbe, Citation1996: ), together with ones (Muylaert & Sabbe, Citation1996: , ) that we would identify as the ‘ambiguous’ morph. Thus, according to their description, both morphs belong to C. scaldensis.
Our morphometric results (below) indicated that the two C. scaldensis morphs could be differentiated by their marginal FP frequency and the number of central FPs at any given size. Based on this, we were then also able to compare exterior valve views of the morphs. The valve face was more pronouncedly colliculate in the ‘extreme’ morph (compare – and –). Spines at the outer openings of processes were straighter in this morph (), whereas those of the ‘ambiguous’ morph had a more elaborate shape (). Both C. scaldensis morphs differed from C. meneghiniana by having small emergences at the external process openings, especially marked for the RPs. Such emergences were absent in C. meneghiniana (, ; Håkansson & Chepurnov, Citation1999: Figs 34, 35).
Conventional morphometrics
Pair-wise scatter plots of variables provide perhaps the simplest approach for looking at multivariate data. shows the number of marginal FPs (MFP) plotted against number of costae (NC). These variables showed the most marked differences between the two morphs of C. scaldensis, showing no overlap in this plot. On the other hand, the ‘ambiguous’ morph overlapped with C. meneghiniana at the smaller end of the size range, while being quite distinct at larger sizes.
Fig. 27. Scatter plot of number of costae (NC) against number of marginal fultoportulae (MFP). Group outliers are connected by lines. (+ = C. meneghiniana, = ‘ambiguous’ morph of C. scaldensis, ○ = ‘extreme’ morph of C. scaldensis. c = cultures, g = field samples from the River Geeste, s = field samples from the river Schelde.)
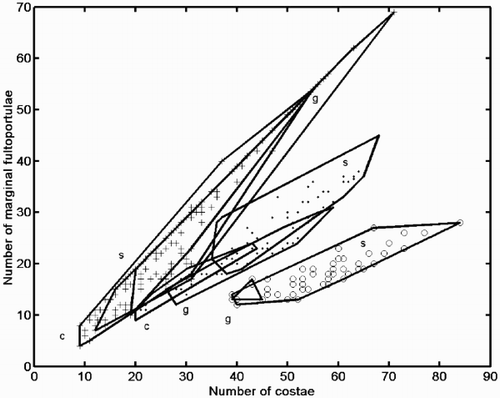
The range of the ratio of NC and MFP (calculated as (NC-1)/MFP because one costa is always occupied by the RP) in the ‘extreme’ C. scaldensis morph (2.44–3.92) did not overlap with that of either the ‘ambiguous’ morph (1.24–2.25) or C. meneghiniana (1.0–2.0) in our sample. Similar ratios are not generally appropriate for compensating for size-related differences and are often less effective in revealing morphological distinctness than an analysis of the interdependence of the two variables (Bookstein et al., Citation1985; Theriot, Citation1988). In this particular case, however, (NC-1)/MFP proved to be a useful index that unequivocally discriminated the two morphs of C. scaldensis. Assuming that the major axis regression lines, MFP = a*NC + b (a = 0.35, b = −1.98 for the ‘extreme’ and a = 0.59, b = −2.0 for the ‘ambiguous’ morph), describe the interrelationship of these variables well, we can expect that the value of the (NC-1)/MFP index approaches 1/a at relatively large values of NC, i.e., if NC > 10. This is well below the observed minimum value of NC in C. scaldensis (20 for the ‘ambiguous’, 39 for the ‘extreme’ morph). We can therefore expect that for these morphs, the curvilinearity occurring at small sizes (Theriot, Citation1988) will not impede the ability of this ratio to distinguish them. However, whereas the bivariate plot () indicates that valves of the ‘ambiguous’ morph are more different from C. meneghiniana at larger sizes, this does not emerge if the ratio of the two variables is applied.
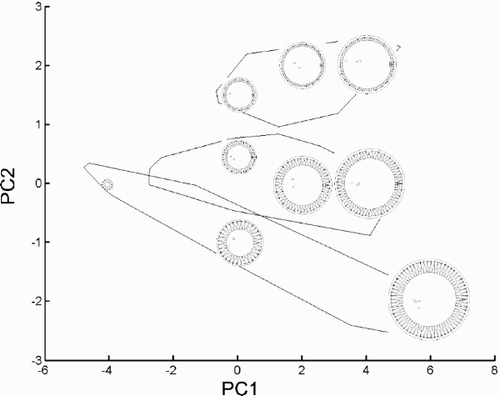
To summarise the variation in the eight recorded variables, a principal component analysis of their correlation matrix was calculated. The first and second principal components accounted for 75.16 and 13.55% of the total (standardised) variation, respectively. The scatter plot in also showed that the two morphs of C. scaldensis were distinct from each other with respect to the eight variables used, whereas scatters of the ‘ambiguous’ morph and C. meneghiniana again overlapped at the lower end of the size range. Nevertheless, as in , the PCA scatter plot strongly suggests that there were three different size reduction series in our samples. The loadings of the variables on the first principal component (PC1) were all positive () and PC1 accounted for 75% of total (standardised) variation. Thus, PC1 reflects overall size variation in our sample (Humphries et al., Citation1981). This suggests that morphometric differences between C. meneghiniana and the ‘ambiguous’ morph were clearer at larger sizes (at larger values of PC1), but smaller specimens were more similar to each other. The loadings of the variables on the first two principal component axes and reconstructed morphologies corresponding to some points in the PCA plot (, ) illustrate that PC2 contrasted RP width (RW) and NC with MFP. Thus, points with larger PC2 values represent valves with a wider RP, more costae, and fewer marginal FPs. The other variables were not strongly correlated with this axis, which separated the morphs.
Fig. 28. Scatter plot on the first two principal component axes of the conventional morphometric dataset. Group outliers are connected by lines. (+ = C. meneghiniana, = ‘ambiguous’, ○ = ‘extreme’ morph of C. scaldensis. c = cultures, g = field samples from the River Geeste, s = field samples from the river Schelde.) Vector correlations of the original variables with the first two principal components are shown in the upper left hand corner.
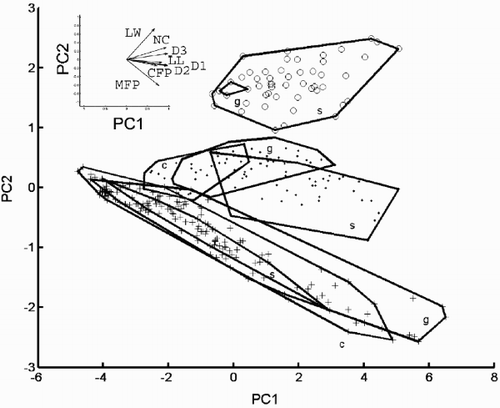
Fig. 29. Reconstructed morphologies of some points in the plane of the first two principal component axes (data shown in ). Group outliers of the three morphs are shown. Morphologies were ‘reconstructed’ by projecting PCA scores back into the coordinate system of the original variables and drawing diagrams based on the resulting values (see ‘Materials and methods’ for details). The diagrams are drawn at the same scale. The morphologies shown correspond to PCA scores (−4, 0), (0, −1), (0, 0.5), (0, 1.5), (2, 0), (2, 2), (4, 0), (4, 2) and (6, −2).
Furthermore, – show that cultured cells of C. meneghiniana, and those found in the River Schelde, were practically indistinguishable from cells of this species from the Geeste material. On the other hand, similarity of the groups (cultures, Geeste and Schelde material) of the ‘ambiguous’ morph was less. Nevertheless, these also overlapped to a large extent, and their differences seem to be caused by variation in the size distributions of the three samples. Cultures of this morph tended to be smaller (had smaller values on PC1) than cells of the same morph in the original field samples (River Geeste); those found in the Schelde sample were even larger.
Results of a canonical variate analysis of the eight variables are shown in . This technique maximises the separation of predefined groups (the three morphs) in multivariate space with respect to their within-group variance. The figure shows that even C. meneghiniana could be distinguished without overlap from the ‘ambiguous’ morph in the variables used, despite their overlap in the PCA plot. also shows that valve diameter (D1), diameter measured between the inner edges of the mantle (D2) and RP length (RL) contributed least to the separation of the morphs, and that CV2 was only strongly correlated with the number of central fultoportulae (CFP). The other variables all contributed to the separation of the groups on the first axis (CV1).
Fig. 30. Canonical variate analysis of the conventional morphometric dataset. Canonical variate scores calculated by grouping the specimens according to morph. (+ = C. meneghiniana, = ‘ambiguous’, ○ = ‘extreme’ morph of C. scaldensis; c = cultures, g = field samples from the River Geeste, s = field samples from the river Schelde.) Group outliers are connected by lines. Vector correlations of the canonical variates with the eight original variables are shown in the upper right hand corner.
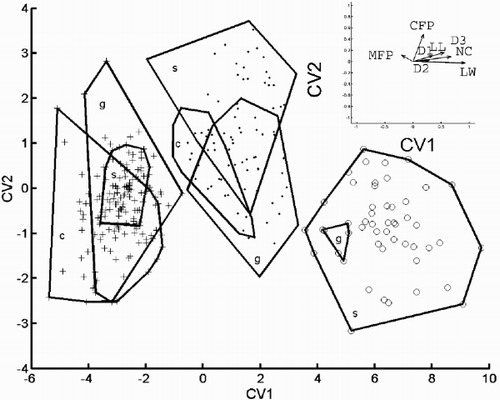
Discriminant analyses provided a further test of the distinctness of the morphs. In a regular discriminant analysis, two C. meneghiniana specimens were misclassified as the ‘ambiguous’ morph, all other specimens were classified correctly. In a jack-knifed discriminant analysis, two C. meneghiniana specimens were misclassified as ‘ambiguous’, and one specimen of the ‘ambiguous’ morph as C. meneghiniana. Thus, although the distinction between the ‘ambiguous’ morph and C. meneghiniana was somewhat less marked than separation of the ‘extreme’ morph from the others, the former were also distinguishable from each other with minimal error.
Geometric morphometrics
shows the results of a relative warp analysis, a principal component analysis of partial warp scores, using a weighting factor α of −1. This weighting emphasises small-scale differences, and we used it because we expected that interesting differences among the morphs would be found in configurations of closely spaced landmarks, rather than in large-scale features. This plot () showed that landmark configurations separated C. meneghiniana from the C. scaldensis morphs. Separation of the latter morphs was not complete, although they showed negligible overlap. Thus, despite similarity in alveolar and RP morphologies of the C. scaldensis morphs, there were considerable differences in these features.
Fig. 31. Relative warp analysis with α = −1, small scale differences weighted more than global ones. Scores of specimens on the first two relative warp axes. Group outliers are connected by lines. (+ = C. meneghiniana, = ‘ambiguous’, ○ = ‘extreme’ morph of C. scaldensis; c = cultures, g = field samples from the River Geeste, s = field samples from the river Schelde.)
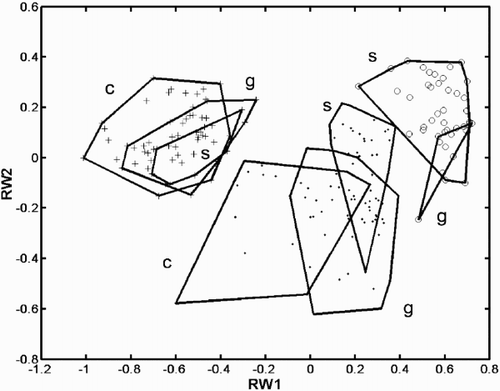
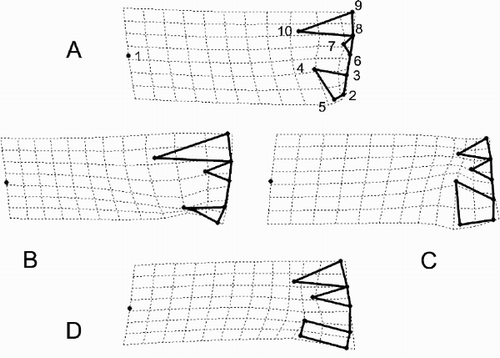
Points in the relative warps plot in each represent a landmark configuration (see for the correspondence of landmark points with anatomic features of the valve). The plots () illustrate changes in these configurations when moving in different directions (up [ A], to the left [ B], to the right [ C], down [ D]) from the origin (the overall mean configuration) in the coordinate system of the relative warps (). B is particularly interesting because it shows the difference between an ‘ambiguous’ C. scaldensis and C. meneghiniana. Changes in the relative positions of landmarks 4, 5 and 10 are the most marked. These changes correspond to a radial orientation of the RP head and long alveolar chambers and show that these are important differences between C. meneghiniana and the other morphs. The difference between the C. scaldensis morphs ( C, D) is less easily interpreted using these diagrams.
Fig. 32. Landmark configurations corresponding to some points of depicted as deformations from the mean configuration (the origin of the coordinate system in ). corresponds to the point (0, 0.5) of the coordinate system, to (−0.5, 0), to (0.5, 0), and to (0, −0.5). The points connected by thick lines represent the landmark points shown in , but the diagrams are rotated approximately 90° anti-clockwise compared to .
Canonical variates analysis (not shown) indicated more clearly that even the two morphs of C. scaldensis could be distinguished without overlap. The differences are illustrated most clearly by analysing the correlation of shape change with size (). C. meneghiniana ( A–C) has longer alveoli than the other two morphs and its RP head is always orientated radially. The contrasting tendencies between the two morphs of C. scaldensis also become more obvious. The ‘extreme’ morph () tends to have smaller alveoli and marginal FPs, and a wider RP than the ‘ambiguous’ morph () at the same size (valve diameter).
Fig. 33. Patterns of allometric valve shape change in the three morphs with size as calculated from a linear regression of the partial warp scores on the logarithm of valve diameter. Landmarks (see to link them to the anatomic features of the valve interior) are connected by thick lines but the diagrams are rotated approximately 90° anti-clockwise compared to . The landmark configurations predicted by the regression for three different diameters (D1 = 8, 16 and 24 µm, respectively) in the three morphs are shown in the columns and the different taxa by rows. Row 1 = Cyclotella meneghiniana, row 2 = ‘ambiguous’ morph of C. scaldensis and row 3 = ‘extreme’ morph of Cyclotella scaldensis.
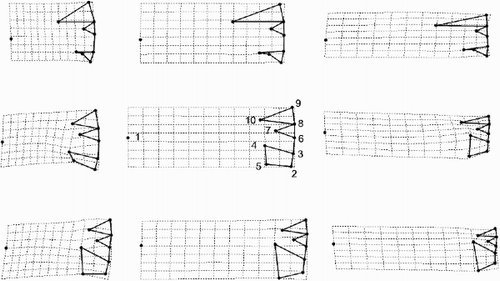
As with the conventional morphometric analyses, morphological similarity of the three groups of C. meneghiniana (cultures, Geeste and Schelde samples) was closer than that of the three ‘ambiguous’ morph groups (). As discussed above (cf. ), this is probably due to the size differences. Valves from cultures showed more variation in the landmark configurations than those from field samples, a pattern not observed in the conventional analyses (, ).
In a discriminant analysis using partial warp scores, no case was misclassified, whereas in the jack-knifed discriminant analysis, one C. meneghiniana valve was misclassified as ‘ambiguous’ C. scaldensis, and five C. scaldensis specimens were misclassified as the other morph of this species, but never as C. meneghiniana. This again illustrates that C. meneghiniana was most distinct, while the two C. scaldensis morphs could also be distinguished with minimal error.
Discussion
Morphometrics
Electron microscopy has clarified several earlier problems of diatom taxonomy (Round et al., Citation1990) simply by providing increased resolution of morphological features. However, increased resolution alone is probably insufficient to resolve all taxonomic questions. One of the important problems when delimiting species is to decide whether morphological groups are distinct (Mann, 1999). Morphometric methods can help decide if morphological variation is continuous and they can identify which characters can be most effectively or easily used to distinguish groups identified (Theriot and Stoermer, Citation1984a, Citationb). Furthermore, they can help communicate results and information about morphological variation over many specimens, the range of which could not be illustrated photographically. They therefore constitute an important part of the methodological arsenal of diatom taxonomy.
Basic morphometric insights are of fundamental importance to diatom taxonomy. Some of these are already gaining recognition: the increasing use of multivariate data analysis methods instead of single-variable comparisons, and the characterisation of allometric trends by analysing the interdependence of size-dependent quantities instead of their reduction to a ratio (Theriot, Citation1988). Reproducing morphologies based on the analysed parameters is a classical morphometric approach (Bookstein et al., Citation1985) that might also be useful for diatom studies, as shown in diatom outline shape analyses (Mou & Stoermer, Citation1992). It can be used to verify the adequacy of recorded characters by comparing specimen morphologies with diagrams based on the data collected. Furthermore, it can also be used to help interpret results in a variety of ways, e.g. presenting diagrams corresponding to different points in morphospace (, ) or to phases of a size reduction series (). This is an often-used advantage of many landmark- and outline-based geometric morphometric methods. Although this is not necessarily readily achievable in conventional morphometric analyses, Tropper (Citation1975) and this study illustrate that it could be feasible.
The use of landmarks, which has become a central concept of morphometrics in the last two decades (Rohlf & Marcus, Citation1993; Dryden & Mardia, Citation1998), has not yet established itself in morphometric analyses of diatom valves. Mou & Stoermer (Citation1992) suggest that this is because ‘most diatoms do not have outline landmarks’ and that ‘internal structures, such as labiate processes, are usually not qualified as landmarks’, because of the lack of knowledge about their function and ontogeny, and because their number usually varies within a genus, and often within a species. We think that, at least in some diatom groups, landmark points can be chosen so that we have as much confidence in their homology between specimens as in that of our conventional morphometric variables. The varying number of most structures found on diatom frustules is, on the other hand, a practical problem. Comparing shapes of the repetitive structures themselves (as in this study) might enable us to circumvent this problem. The characterisation of RP morphology in our study is a good illustration of a case where landmarks characterise morphologies more intuitively and precisely than simple measurements. Using the traditional approach, a difference in the ‘width’ of the RPs between the C. meneghiniana and the C. scaldensis morphs () could be revealed. The same differences could, on the other hand, be interpreted more precisely as a twist of the RP head in the landmark-based analyses (–; compare –, , ).
Taxonomic identity of the ambiguous morph
The two different approaches introduced to analyse valve ultrastructural variation proved to some extent complementary: differences between the two morphs of C. scaldensis emerged more clearly in the conventional morphometric analyses (–), those between C. meneghiniana and the ‘ambiguous’ morph in the geometric ones (). Results from both approaches confirmed that (i) valve morphologies of the cultivated strains corresponded to valve morphologies of the morphs in the field samples, and (ii) the three morphs were morphologically distinct. The analyses allowed us to identify our ‘ambiguous’ cultures as a C. scaldensis morph that has an intermediate valve morphology between the other (‘extreme’) morph of this species and C. meneghiniana.
The biological relevance of the morphological distinctness of samples of diatom valves depends, first of all, on whether the differences can be explained simply by size differences. The characteristic cell size reduction, inherent in many diatom life cycles, can lead to morphological changes that cause smaller and larger specimens of a clonal culture to look quite different (Meyer et al., Citation2001). The morphological differences found between our three morphs cannot be explained by this phenomenon, because their distinctness was found despite overlapping size ranges (C. meneghiniana: 4.4–32.5 µm; ‘ambiguous’ morph: 7.1–24.3 µm; ‘extreme’ morph: 12.8–27.1 µm).
Alternatively, morphological differences might be explained by intraspecific geographical variation or phenotypic responses to different environmental conditions. To date, little is known about geographical variation in diatom valve morphology. On the other hand, morphological plasticity has been observed in a closely related species, C. cryptica. Strains of this species exhibited valve morphology characteristic of C. meneghiniana when grown in low salinity media, whereas they produced the typical C. cryptica morphology at higher salinities (Schultz, Citation1971). In our study, we did not attempt to study phenotypic plasticity, but any effect of environmental or geographic factors on valve morphology was reduced to a minimum by the sampling design. The compared valves were (i) grown under the same culture conditions (medium, temperature, light intensity, light–dark cycle), and (ii) co-occurred in the same field samples.
Culture studies could reveal cases where morphological variation spanned proposed species boundaries in this genus, as illustrated by Hegewald & Hindáková (Citation1997) for the C. ocellata-complex. The occurrence of different morphs in their study was partly size-dependent (connected to life cycle), but also seemed to represent phenotypic variability. We found neither size-dependent morphological changes nor size-independent morphological variability that exceeded morph limits. However, variability was observed in some minor features. In particular, the presence and morphology of spines was highly variable in the ‘ambiguous’ C. scaldensis cultures. Valves with regularly and irregularly spaced spines, as well as those without any spines, could be found in a single sample of a clonal culture. Presence of spines seemed to be a more stable character in C. meneghiniana: valves always possessed spines, although they were not always present at each FP opening.
The availability of cultures of the ‘extreme’ morph could provide the possibility for comparative experimental studies of phenotypic plasticity and/or for molecular genetic comparison with the other morphs. However, even in the absence of cultures, the co-occurrence of the three morphs in the same field samples at overlapping size ranges strongly suggests that the morphological differences between them result from their genetic distinctness – i.e. the three morphs constitute different morphospecies.
We note that ribosomal DNA sequence comparisons of these strains further reinforce the possibility that they belong to distinct species (Beszteri et al., in preparation). Furthermore, whereas cultures of C. meneghiniana were easy to isolate and grow, even for a long time in a variety of media, cultures of the ‘ambiguous’ morph were more problematic. The latter required the addition of river water and frequent transfers when they reached stationary phase in order to survive. This indicates that the cultures differed not only morphologically, but also physiologically, and further supports their separation into different species. The three morphs also seem to have different ecological preferences, as illustrated by their contrasting abundances in the two estuarine sites.
However, a number of questions remain to be answered about the three morphs in order to improve understanding of this particular taxonomic group, not only for its own sake, but also as a model of diatom species complexes in general. With respect to morphology, the most important question is whether these morphs remain morphologically distinct on a global scale, and whether they show morphological plasticity. On the other hand, the biological and ecological differences between the morphs need to be clarified to permit any ‘practical’ consequences of distinguishing them, for example in water quality monitoring.
Acknowledgements
Thanks to Koenraad Muylaert and Koen Sabbe for providing the sample from the Schelde. This paper was made possible by B. Beszteri's attendance at the Amsterdam Morphometrics Workshop in 2002, helpful suggestions from Edward Theriot, and the Stony Brook Morphometrics web site (http://life.bio.sunysb.edu/morph/). We would also like to thank Friedel Hinz and Ute Bock for their help with the electron microscopy, Uwe John and Alberto Garcia Sáez for discussions, and Eileen Cox, Marina Montresor, Richard Crawford and two anonymous reviewers for valuable comments on different versions of the manuscript, which helped to improve it greatly. This work was in part supported by the project ‘Algaterra’ of the German Federal Ministry of Education and Research (project ID 01LC0026, http://www.algaterra.org) and by grant no. FKFP-0154/2000 of the Hungarian Ministry of Education.
References
References
- Andersen , RA , Morton , SL and Sexton , JP . 1997 . CCMP – Provasoli-Guillard National Centre for Culture of Marine Phytoplankton 1997 list of strains . J. Phycol. , 33 : 1 – 75 .
- Bookstein FL 1991 Morphometric Tools for Landmark Data: Geometry and Biology, Cambridge University Press Cambridge
- Bookstein FL Chernoff B Elder RL Humphries JM Smith GR Strauss RE 1985 Morphometrics in Evolutionary Biology: The Geometry of Size and Shape Change, with Examples from Fishes, Academy of Natural Sciences of Philadelphia Philadelphia
- dos Reis , SF , Pessôa , LM and Strauss , R . 1990 . Application of size-free canonical discriminant analysis to studies of geographic differentiation . Rev. Brasil. Genet. , 13 : 509 – 520 .
- Droop SJM 1995 A morphometric and geographical analysis of two races of Diploneis smithii/D. fusca (Bacillariophyceae) in Britain In Proceedings of the Thirteenth International Diatom Symposium (Marino, D. & MontresorM., editors) 347 369 Biopress Limited Bristol
- Dryden IL Mardia KV 1998 Statistical Shape Analysis, John Wiley & Sons New York
- Du Buf H Bayer MM (editors) 2002 Automatic Diatom Identification. Series in Machine Perception and Artificial Intelligence 51 World Scientific Publishing London
- HÅkansson , H . 1990 . Cyclotella meneghiniana Kütz. (Bacillariophyceae): its morphology and reappraisal of similar species . Nova Hedwigia Beih. , 100 : 19 – 37 .
- HÅkansson , H . 2002 . A compilation and evaluation of species in the genera Stephanodiscus, Cyclostephanos and Cyclotella with a new genus in the family Stephanodiscaceae . Diatom Res. , 17 : 1 – 139 .
- HÅkansson , H and Chepurnov , V . 1999 . A study of variation in valve morphology of the diatom Cyclotella meneghiniana in monoclonal cultures: effect of auxospore formation and different salinity conditions . Diatom Res. , 14 : 251 – 272 .
- Hausmann , S and Lotter , AF . 2001 . Morphological variation within the diatom taxon Cyclotella comensis and its importance for quantitative temperature reconstructions . Freshwat. Biol. , 46 : 1323 – 1333 .
- Hegewald , E and Hindáková , A . 1997 . Variability of a natural population and clones of the Cyclotella ocellata-complex (Bacillariophyceae) from the Gallberg-pond, NW-Germany . Arch. Hydrobiol. , 120 : 17 – 37 .
- Humphries , JM , Bookstein , FL , Chernoff , B , Smith , GR , Elder , RL and Poss , SG . 1981 . Multivariate discrimination by shape in relation to size . Syst. Zool. , 30 : 291 – 308 .
- Mann , DG . 1999 . The species concept in diatoms . Phycologia , 38 : 437 – 495 .
- Meyer , B , Wulf , M and HÅkansson , H . 2001 . Phenotypic variation of life-cycle stages in clones of three similar Cyclotella species after induced auxospore production . Diatom Res. , 16 : 343 – 361 .
- Mou , D and Stoermer , EF . 1992 . Separating Tabellaria (Bacillariophyceae) shape groups based on Fourier descriptors . J. Phycol. , 28 : 386 – 395 .
- Muylaert , K and Sabbe , K . 1996 . Cyclotella scaldensis spec. nov. (Bacillariophyceae), a new estuarine diatom . Nova Hedwigia , 63 : 335 – 345 .
- Pappas , JL , Fowler , GW and Stoermer , EF . 2001 . Calculating shape descriptors from Fourier analysis: shape analysis of Asterionella (Heterokontophyta, Bacillariophyceae) . Phycologia , 40 : 440 – 456 .
- Rhode , KM , Pappas , JL and Stoermer , EF . 2001 . Quantitative analysis of shape variation in type and modern populations of Meridion (Bacillariophyceae) . J. Phycol. , 37 : 175 – 183 .
- Rohlf FJ 1993 Relative warp analysis and an example of its application to mosquito wings In Contributions to Morphometrics (Marcus, L.F., Bello, E. & Garcia-Valdecasas, A., editors) 131 159 Museo Nacional de Ciencias Naturales (CSIC) Madrid
- Rohlf , FJ . 1999 . Shape statistics: Procrustes superimpositions and tangent spaces . J. Class. , 16 : 197 – 223 .
- Rohlf , FJ and Marcus , LF . 1993 . A revolution in morphometrics . Trends Ecol. Evol. , 8 : 129 – 132 .
- Round FE Crawford RM Mann DG 1990 The Diatoms: Biology and Morphology of the Genera, Cambridge University Press Cambridge
- Schultz , ME . 1971 . Salinity-related polymorphism in the brackish-water diatom Cyclotella cryptica . Can. J. Bot. , 49 : 1285 – 1289 .
- Teubner , K . 1995 . A light microscopical investigation and multivariate statistical analyses of heterovalvar cells of Cyclotella-species (Bacillariophyceae) from lakes of the Berlin-Brandenburg region . Diatom Res. , 10 : 191 – 205 .
- Theriot , E . 1987 . Principal component analysis and taxonomic interpretation of environmentally related variation in silicification in Stephanodiscus (Bacillariophyceae) . Br. Phycol. J. , 22 : 359 – 373 .
- Theriot , E . 1988 . An empirically based model of variation in rotational elements in centric diatoms with comments on ratios in phycology . J. Phycol. , 24 : 400 – 407 .
- Theriot , E and Stoermer , EF . 1984a . Principal component analysis of Stephanodiscus: observations on two new species from the Stephanodiscus niagarae complex . Bacillaria , 7 : 37 – 58 .
- Theriot , E and Stoermer , EF . 1984b . Principal component analysis of variation in Stephanodiscus rotula and S. niagarae (Bacillariophyceae) . Syst. Bot. , 9 : 53 – 59 .
- Tropper , CB . 1975 . Morphological variation of Achnanthes hauckiana (Bacillariophyceae) in the field . J. Phycol. , 11 : 297 – 302 .