Abstract
Synchrotron-based Fourier-transform infrared (FTIR) microspectroscopy was used to characterize micropopulations of the cyanobacteria Anabaena flos-aquae and Aphanizomenon flos-aquae in mixed phytoplankton samples taken from the epilimnion and hypolimnion of a stratified eutrophic lake (Rostherne Mere, UK). All FTIR spectra (normalized to amide I) showed a closely similar sequence of 10 bands over the wavenumber range 4,000–900 cm−1 and were assigned to a range of vibrationally active chemical groups. Interspecific differences between Anabaena and Aphanizomenon were revealed using correlation and multivariate analysis (principal component analysis, PCA) of the set of individual band intensities. Differences between species (separately for epilimnion and hypolimnion) were also analysed by comparing band intensity means, and by performing PCA over a broad spectral region (1,750–900 cm−1). Comparison of intensity means showed that spectra obtained from epilimnetic algae had significant differences in bands 5–7 and in bands 4, 9 and 10. However, in the spectra obtained from the hypolimnion algae, a different pattern was observed, with significant differences between the species restricted to bands 7–10. PCA of the spectral region 1,750–900 cm−1 also demonstrated interspecific differences in relation to carbohydrate and protein concentrations, with Anabaena displaying higher carbohydrate levels in both the epilimnion and hypolimnion. Intraspecific comparisons of band intensity means for epilimnion and hypolimnion subpopulations demonstrated clear differences in Aphanizomenon, where significant differences were observed between epilimnion (higher carbohydrate concentration compared with protein) and hypolimnion (lower carbohydrate concentration compared with protein) subpopulations. Anabaena however showed only minor differences. PCA comparison of the spectral region 1,750–900 cm−1, followed by data visualization using scores plots and loading plots, also demonstrated quantitative differences. Scores plots resolved the epilimnion and hypolimnion subpopulations in Aphanizomenon (but not Anabaena), with the loading plot showing large differences in carbohydrates, supporting the analysis using discrete peak intensities.
Introduction
Along with other biophysical techniques such as magnetic resonance imaging, chemoluminescence (Villareal & Lipschultz, Citation1995) and X-ray microanalysis (Sigee et al., Citation1999a , Citation b ; Sigee & Levado, Citation2000), Fourier-transform infrared (FTIR) microspectroscopy can detect and quantify a range of chemical groups within phytoplankton microsamples. These biophysical techniques have the potential to make diagnoses, identify organisms and obtain information on physiological responses in situ (Sacksteder & Barry, Citation2001). The chemical groups that can be quantified using FTIR microspectroscopy include various vibrational modes of O–H, N–H, =C–H, OCH2 and >P=O, and the spectra obtained thus reflect both the molecular structure and the molecular environment of the functional groups involved.
Although FTIR microspectroscopy has largely been used in relation to purified biochemicals such as nucleic acids (Liquier & Taillandier, Citation1996), proteins (Stuart, Citation1997), lipids (Lewis & McElhaney, Citation1996) and polysaccharides (Brandenberg & Seydel, Citation1996), it may also be applied to more complex biological samples – including bacteria (Naumann et al., Citation1996), fungi (Guibal et al., Citation1995), microalgae (Sigee et al., Citation2002), higher plants (Wetzel et al., Citation1998) and tissue culture cells (Holman et al., Citation2000). The technique has recently been used to study physiological changes in microalgae (Heraud et al., Citation1999; Giordano et al., Citation2001), and to discriminate between cyanobacterial strains (Kansiz et al., Citation1999).
Most FTIR studies on whole microorganisms (including phytoplankton) have been carried out on laboratory-cultured material, with relatively few analyses of environmental organisms. However, the high spatial resolution of the microscopical technique (in combination with the high-intensity synchrotron beam) means that particular species can be selectively analysed within mixed environmental populations, allowing these species to be directly characterized as they occur within the ecosystem. Recently Sigee et al. (Citation2002) carried out synchrotron-based FTIR studies on the green alga Pediastrum duplex directly isolated from a freshwater lake, demonstrating that it was possible to obtain high quality spectra from air-dried monolayer (single-cell thick) preparations. Analysis of these spectra permits determination of the relative cellular levels of discrete vibrational groups present within nucleic acids, lipids, carbohydrates and proteins. The present study extends this earlier work to analyse more detailed aspects of phytoplankton ecology, and investigates two planktonic subpopulations of the cyanobacteria Aphanizomenon flos-aquae and Anabaena flos-aquae to determine whether: (i) any variation in molecular characteristics occurred with depth in the lake water column, and (ii) the two species could be differentiated in terms of molecular composition.
Materials and methods
Collection and processing of samples
1-litre volumes of lake water were collected from the central region of Rostherne Mere (Cheshire, UK) on 12 July 2000, as part of a routine study programme. The samples were obtained from depths of 0, 5, 10 and 15 m in the water column using a standard depth sampler. Large zooplankton were immediately (on the boat) removed by filtration, and the remaining sample subsequently processed in the laboratory.
Within 1 h of collection, water samples were filtered using a 63-μm phytoplankton net and the phytoplankton was recovered as a concentrated suspension in distilled water just prior to dehydration. During the period of suspension, cells were checked visually under a light microscope to ensure no adverse effects such as cell bursting or leaking of organic material occurred. No loss of cell integrity was observed, which is in line with previous X-ray microanalysis studies (Sigee et al., Citation1999a , Citation b ; Sigee & Levado, Citation2000) where no detectable change in cellular ionic content could be observed during short-term distilled water treatment. Droplets of the phytoplankton concentrate were then deposited on ‘Low-e’ reflectance slides (Kevley Technologies, Chesterland, USA), air-dried under sterile laminar flow at room temperature and stored in a desiccator until analysis.
Infrared analysis
Instrumentation and data collection
Synchrotron-dependent infrared analysis was carried out at Daresbury Laboratory, Warrington (UK), using a Nicolet NicPlan microscope fitted with a Nicolet 730 mid-IR FTIR spectrometer (beamline station 13.3). The use of a high-intensity synchrotron source allowed very small apertures to be employed while maintaining an adequate signal-to-noise ratio. Spectral resolution of the mercury cadmium telluride (MCT) detector was 4 cm−1, with 128 co-added scans. Spectra were collected using a 10 μm square aperture, and were collected over the wavenumber range 4,000–650 cm−1. Infrared absorption spectra were collected from clear field (background) and from colonies of algae (see ) and a ratio obtained of the sample to background spectrum. Specimens were examined and analysed in the dry state, with no mounting medium or coverslip. Each depth sample was initially examined by bright-field microscopy, and 20 individual colonies of Aphanizomenon and Anabaena were randomly selected within the mixed phytoplankton population for analysis (one spectrum per colony).
Qualitative analysis
Spectral absorption bands were identified in relation to published information. Supporting information on band assignments was also obtained by analysis of a range of pure biochemical standards (protein, nucleic acid, fatty acid and soluble carbohydrate) as detailed in Sigee et al. (Citation2002).
Quantitative analysis
Manipulation of FTIR spectra was carried out using Nicolet OMNIC software (Nicolet Ltd). Spectra were baseline-corrected using the automatic baseline correct algorithm and subsequently normalized to amide I.
Two approaches were adopted in relation to quantitative analysis. Firstly, the intensity of each discrete band (i.e. 10 data points per spectrum) were recorded. These data were then used to compare samples (different species and different depths) in relation to individual band intensities or with reference to the pattern of bands using correlation and principal component analysis (PCA). Statistical analysis on band intensities was carried out using EXCEL and SPSS software.
The second approach was the use of PCA analysis to compare an entire spectral region of interest. In this study, PCA was carried out using intensities over the wavenumbers 1,750–900 cm−1, the region in which the majority of the molecular information lies, resulting in 442 data points per spectrum. Spectra obtained from different species, and from different depths, were then compared and the data analysed using scores plots, with each point on the plot representing an individual spectrum, thus allowing the clustering of data sets to be visualized. Loading plots were then generated which showed which regions of the spectra (e.g. protein, carbohydrate) were responsible for the observed separation. The procedure for carrying out PCA, and generating scores and loading plots, was carried out using MATLAB (The MathWorks Inc.).
Results
Conditions within the water column
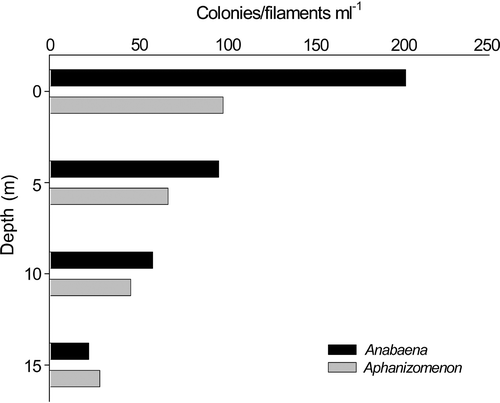
The mixed phytoplankton population throughout the water column was dominated by colonies of Anabaena flos-aquae and Aphanizomenon flos-aquae, the latter typically occurring as rafts of associated filaments. These were sampled at a point in time when they were present in the lake at different phases in their annual cycle. Anabaena flos-aquae was just past an early July peak of >200 colonies ml−1, while Aphanizomenon flos-aquae was in the early phase of a peak which reached over 1,200 filaments ml−1 in late August (). Due to variations in colony size, these counts provide only an approximate indication of biomass. Counts of Anabaena and Aphanizomenon showed a marked attenuation with depth (), ranging from high population densities at the lake surface (Anabaena: 200 colonies ml−1, Aphanizomenon: 100 filaments ml−1) to <30 colonies/filaments ml−1 at 15 m.
Fig 1. Seasonal variation in the numbers of Anabaena flos-aquae colonies (•) and Aphanizomenon flos-aquae filaments (○) in Rostherne Mere during 2000. Arrow indicates date on which samples were taken.
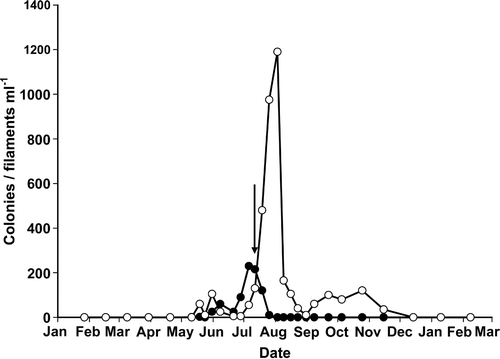
Fig 2. Variation in numbers of Anabaena flos-aquae colonies and Aphanizomenon flos-aquae filaments with depth in Rosthene Mere at the time of sampling (12 July 2000).
Other algae present included the dinoflagellates Peridinium cinctum and Ceratium hirundinella at 118 and 15 cells ml−1, respectively, the chlorophytes Staurastrum sp. and Scenedesmus quadricauda at 35 and 100 cells ml−1, respectively, and the diatom Asterionella formosa at 70 cells ml−1.
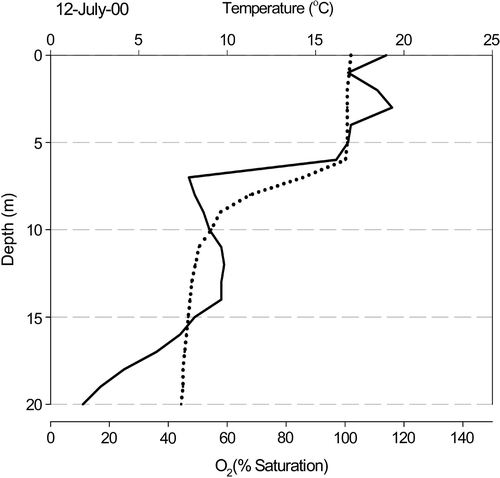
The different phytoplankton populations sampled from the water column occurred in markedly different physico-chemical microenvironments (). Cells in the epilimnion (0- and 5-m samples) were present at high irradiance (not measured), 18°C and 100–120% O2 saturation, while hypolimnion samples (10 and 15 m) occurred at low irradiance, 5–10°C and 40–60% O2 saturation.
Fig 3. Depth profiles of temperature (dotted line) and oxygen (solid line) in Rosthene Mere on 12 July 2000. Measurements were taken at 1-m intervals.
Band assignments and relationships
Under the light microscope, air-dried preparations of mixed phytoplankton samples showed typical images of Aphanizomenon flos-aquae (, bundles of filaments) and Anabaena flos-aquae (, filamentous colonies). At each depth, 20 spectra of each alga were collected, resulting in 40 spectra for each algal species in both the epilimnion and hypolimnion. Spectral analysis was carried out over areas (10 × 10 µm squares) of specimens where the colony was one-cell deep. The thickness of this monolayer was determined by mean filament width, which ranged from 2.5 ± 0.42 µm (mean ± SD, n = 20) for Aphanizomenon to 4.95 ± 0.46 µm (mean ± SD, n = 20) for Anabaena. The regions of analysis generated infrared absorption spectra that were closely similar in Anabaena () and Aphanizomenon (), and contained 10 clear bands over the wavenumber range 4,000–900 cm−1. Assignments for the 10 bands are shown in , and are attributed to a range of vibrational modes in residual water (band 1), lipids (bands 2, 5), proteins (bands 1, 3, 4, 5 and 6), nucleic acids plus other phosphorus-containing compounds (band 7) and carbohydrates (bands 2, 8, 9, 10). Analysis of populations of Anabaena and Aphanizomenon throughout the water column (0–15 m) showed that band positions (wavenumber) were closely similar in the two populations (), with no significant differences between the algae.
Fig 4. Light microscope images of Aphanizomenon flos-aquae and Anabaena flos-aquae from an air-dried sample of mixed phytoplankton (5-m depth), viewed without mounting medium or coverslip. (a) Bundle of filaments of Aphanizomenon, with Anabaena in bottom left corner. Thickness of monolayer (mean cellwidth): 2.5 µm. (b) Part of a colony of Anabaena. Filaments are surrounded by a thick surface coat of dried mucilage (m). Thickness of monolayer (mean cell width): 4.9 µm. In each image, the size and position of the probe area (region of analysis) is indicated by the 10 × 10 µm white square.
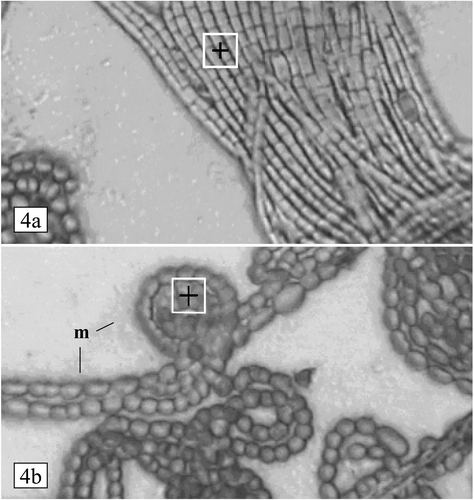
Fig 5. Infrared absorption spectrum from the colony of Anabaena flos-aquae (surface phytoplankton sample) shown in . Band assignments are given in .
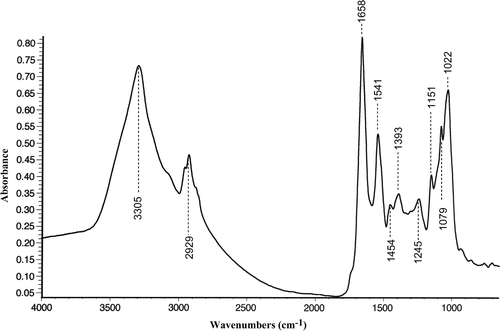
Table 1. Assignment of bands found in FTIR spectra from air-dried colonies of Aphanizomenon flos-aquae and Anabaena flos-aquae.
Table 2. Comparison of band positions in FTIR spectra of Aphanizomenon and Anabaena.
Species comparison – correlation and principal component analysis
Pearson analyses of normalized band intensities (referenced to amide I) showed a distinctive pattern of significant correlations (99% probability level) in both algae (). In both species, strong correlations were found between bands 8, 9 and 10, consistent with their joint derivation from carbohydrate. Apart from this, the pattern of correlations was very different in the two organisms. In Anabaena, the carbohydrate bands (8–10) also showed strong correlation with bands 1 and 2. In contrast, the carbohydrate bands in Aphanizomenon were not correlated with bands 1 and 2, but showed major negative correlations with the protein band 4 (amide II).
Table 3. Correlation matrix for band intensities for Anabaena and Aphanizomenon.
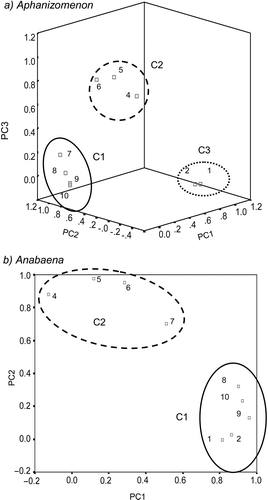
PCA was also carried out on normalized band intensities. In Aphanizomenon, 95% of sample variance was determined by three principal components, leading to a three-dimensional PCA plot (). Variability within the samples led to three main groups of bands, determined by PC1 (bands 7–10), PC2 (bands 4–6) and PC3 (bands 1, 2). In Anabaena, over 85% of sample variance was determined by two principal components, leading to a two-dimensional PCA plot (). Two major groups of bands were derived from PC1 (bands 1, 2, 8–10) and PC2 (bands 4–7).
Fig 6. PCA of band intensities in total populations (n = 80) of Aphanizomenon and Anabaena. Three-dimensional (a) and two-dimensional (b) PC plots in rotated space. Band intensities are normalized to amide I (band 3) and are grouped (C1, C2, C3) in relation to the major determining principal component (PC1, PC2, PC3, respectively).
Species comparison – analysis of individual band intensities and the spectral region 1,750–900 cm−1
Interspecific comparison of algal populations was carried out separately for epilimnion (n = 40 for each species) and hypolimnion (n = 40 for each species) subsamples. Analysis was carried out in two ways: analysis of discrete band intensities and positions, and spectral comparison using PCA on the spectral region from 1,750–900 cm−1.
(i) Analysis of band intensities
shows the mean (±SD) band intensities for Aphanizomenon and Anabaena spectra from epilimnion and hypolimnion samples, together with the coefficients of variation (standard deviation expressed as a percentage of the mean). There was a wide variation in the intensities of the individual bands for both species, suggesting a relatively heterogeneous population. The highest coefficients of variation occurred in Aphanizomenon, in the peaks derived from carbohydrate (2, 8–10). In Anabaena, the highest variation again occurred in bands derived from carbohydrate, particularly in spectra obtained from hypolimnion samples. This suggests that the two algal species show greatest heterogeneity in terms of their carbohydrate content, with Aphanizomenon displaying greater heterogeneity than Anabaena.
Table 4. Mean band intensities (n = 40) for Anabaena and Aphanizomenon subpopulations sampled from the epilimnion and hypolimnion.
PCA of normalized band intensities () has already shown that Aphanizomenon and Anabaena have different band groupings in PC plots. Quantitative differences between species were also analysed by direct comparison of band intensities. Prior to normalization, band intensities differed markedly between the two algal populations, with significantly higher values (t-test, p < 0.01) for all the bands in Anabaena compared with Aphanizomenon. These differences appeared to reflect the greater cell size in Anabaena (), resulting in higher infrared absorption. Major bands in Anabaena routinely had absorbance values in the range 0.7–0.9 (), compared with values of 0.3–0.7 in Aphanizomenon (see later ).
Following normalization to amide I, band intensities were more similar between species, but there were still significant differences in mean band intensities (). In the spectra obtained from epilimnetic algae bands 5–7 were significantly different (p < 0.01) and bands 4, 9 and 10 significantly different at the p < 0.05 level. However, in the spectra obtained from algae sampled within the hypolimnion a different pattern was observed, with bands 7–10 significantly different at the 0.01 level.
(ii) Spectral comparison
Separate PCAs were carried out over the 1,750–900 cm−1 wavenumber region for epilimnion and hypolimnion samples. Within the epilimnion dataset, 74% of the variability was determined by PC1, while the corresponding figure for the hypolimnion was 73%. The PC scores plots for hypolimnion populations () show that, although species separation is not absolute (with some overlap), there is some separation along PC1. For the samples collected from the hypolimnion, approximately 73% of the spectra situated positively on PC1 were from Anabaena colonies, and a similar proportion situated negatively were from Aphanizomenon colonies. For the epilimnion () a separation along PC1 can also be observed, though it is less clear than for the hypolimnion. In this part of the water column 68% of Anabaena were positively situated on PC1 while for Aphanizomenon the separation is less distinct, with 58% of situated negatively. The regions of the spectra that are responsible for the separation of groups in PCA plots can be investigated using loading plots. Loading plots show which are the most important wavenumbers in separating the groups along each PC, with the magnitude of the loading being a measure of the importance of that wavenumber to the separation. Wavenumbers with zero loading represent unimportant features. The loading plot () shows that the separation of the algae along PC1 can be largely attributed to differences in the cellular concentrations of protein and carbohydrate. The positive loadings in these regions also indicate that those spectra situated positively along PC1 (principally Anabaena) display relatively higher carbohydrate and protein levels than Aphanizomenon in both epilimnion and hypolimnion samples.
Fig 7. PCA of (a) epilimnion and (b) hypolimnion micropopulations of Anabaena (+) and Aphanizomenon (∗). Two-dimensional PC plots derived from 1,750–900 cm−1 spectral region, normalized to amide I. In both epilimnion and hypolimnion, Anabaena forms the majority of spectra with a positive loading on PC 1. For each depth, 80 spectra were analysed (40 Anabaena, 40 Aphanizomenon).
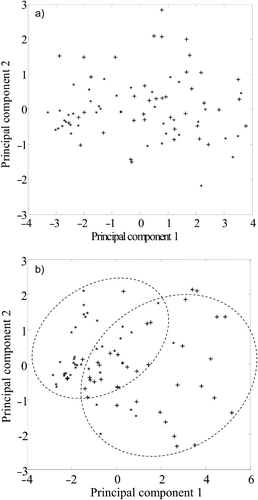
Fig 8. Loading plot comparison of PCA-resolved epilimnion and hypolimnion populations () of Anabaena and Aphanizomenon.
Intraspecific variation within the water column: comparison of the epilimnion and hypolimnion
For each alga, comparison of epilimnion (n = 40) and hypolimnion (n = 40) populations was carried out by analysis of discrete band intensities and analysis of whole spectra.
(i) Analysis of band intensities
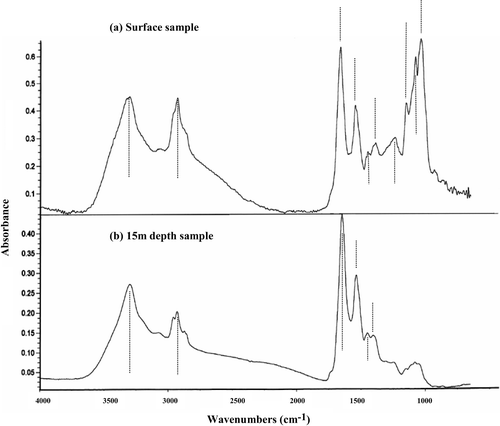
Significant differences between epilimnion (combined surface and 5-m samples) and hypolimnion (combined 10- and 15-m samples) populations were observed in relation to normalized band intensities (). In Anabaena, the only significant difference in band intensity was for band 2 (lipid; epilimnion > hypolimnion). In Aphanizomenon, however, significantly (p < 0.01) higher hypolimnion absorption signals were detected for band 4 (amide II) and 5 (protein/lipid) and lower hypolimnion levels for bands 8–10 (carbohydrate). These effects can be clearly seen when comparing Aphanizomenon FTIR spectra from different depths in the water column, with the 15-m hypolimnion sample having much reduced intensities in the region 1,200–900 cm−1 ().
Fig 9. Typical FTIR spectra from filaments of Aphanizomenon, sampled at the lake surface and at 15-m depth. Band marker lines are the same as those in Fig. 5. The surface sample has a prominent group of carbohydrate bands which are much reduced in the hypolimnion sample.
(ii) Spectral comparison
PCA was carried out using the 1,750–900 cm−1 region of the spectra. Spectra were analysed in relation to epilimnion and hypolimnion subsets and expressed as a two-dimensional scores plot ().
Fig 10. PCA of epilimnion (+) and hypolimnion (∗) algae within total populations (n = 80) of (a) Aphanizomenon and (b) Anabaena. Two-dimensional PC plots derived from 1,750–900 cm−1 spectral region, normalized to amide I. Epilimnion and hypolimnion subpopulations appear to form two separate groupings for Aphanizomenon (indicated by broken lines) but not for Anabaena.
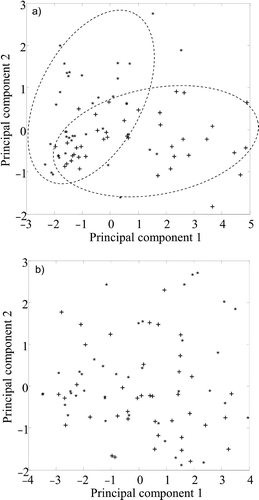
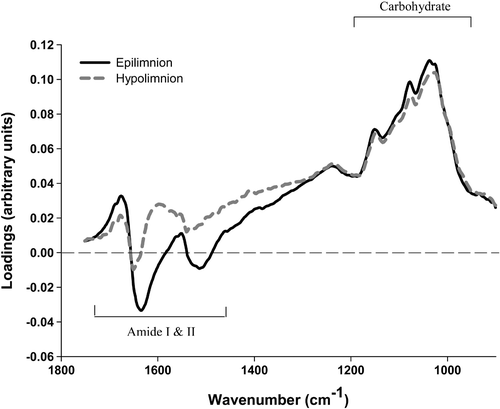
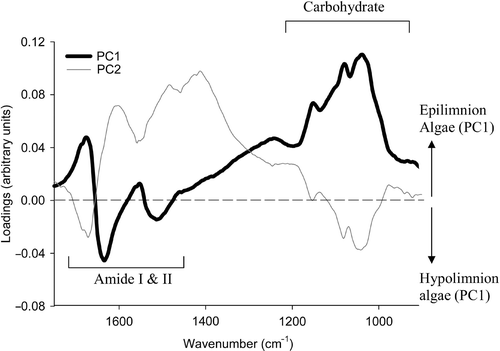
The PC scores plot for Aphanizomenon () show a separation into two overlapping epilimnion and hypolimnion subpopulations. Within this dataset, 65% of the variability was determined by PC1, and 15% by PC2. The loading plot () shows differences between epilimnion (higher carbohydrate absorbance compared with protein) and hypolimnion (lower carbohydrate absorbance compared with protein) subpopulations. The PC scores plot for Anabaena () did not show any clear resolution of epilimnion and hypolimnion subpopulations, and no further analysis was carried out.
Fig 11. Differentiation of epilimnion and hypolimnion subpopulations in Aphanizomenon. Loading plot comparison of PCA-resolved subpopulations () in relation to principal components – PC1 and PC2.
Discussion
In this study, synchrotron-based FTIR analysis has been applied to environmental populations of cyanobacteria. Comparative analysis of discrete absorption bands and broad spectral regions was used to differentiate between species, distinguish subpopulations in the epilimnion and hypolimnion and demonstrate molecular heterogeneity within microscopical samples.
Interpretation of FTIR spectra
Procedures for specimen preparation and analysis of spectra followed from an earlier FTIR study on Pediastrum (Sigee et al., Citation2002). Deposition and air-drying of phytoplankton was carried out as rapidly as possible (within 1 h of extraction from the water column) to minimize cell deterioration and chemical changes and the absence of any chemical treatment during preparation ensured that the FTIR spectra reflected, as far as possible, the molecular composition of the algal cells within the lake environment.
FTIR spectra for Anabaena and Aphanizomenon had well resolved bands, whose molecular assignment was based on published data and previous information from biochemical standards (Sigee et al., Citation2002). The problems encountered with identification and interpretation of these bands are similar to those for other whole-organism studies, such as those on bacteria (Naumann et al., Citation1996), in which individual molecular groups contribute to different bands; some bands are derived from several molecular sources, and other bands are attributable to just one molecular source. For example C–H stretching at 2,930 cm−1 (band 2) is attributable to both lipids and carbohydrates, while band 8 (1,151 cm−1) is only attributable to C–O stretching of carbohydrates. As with other complex biological samples (Naumann et al., Citation1996), band attributions follow a defined sequence, with characteristics in molecular vibration related to a series of wavenumber intervals. These include 4,000–3,100 cm−1 (O–H and N–H stretching), 3,100–2,800 cm−1 (C–H stretching), 1,700–1,500 cm−1 (amide I and amide II groups), 1,250–1,200 cm−1 (asymmetric >P=O stretching) and 1,200–900 cm−1 (polysaccharide C–O stretching).
In this study, correlation and PC analysis of discrete peak intensities provide useful supporting information. The molecular composition of both species is dominated by carbohydrates. Cyanobacteria have a mucopeptide rather than a carbohydrate cell wall, so that the carbohydrate bands identified in these spectra would be largely derived from intracellular deposits of ‘myxophycean’ starch (Lee, Citation1997) plus surface mucilage. In both Anabaena and Aphanizomenon, carbohydrates form the main correlated group (highly significant correlation coefficients) and are both determined by PC1.
In Anabaena, bands 1, 2 and 8–10 were all correlated, and also grouped together in the PC analysis. The grouping of bands 8–10 is due to their joint derivation from ν(C–O–C) stretching of polysaccharides. Band 2 (2,929 cm−1) is usually associated with δas(CH2) of methylene from lipids, but its correlation with bands derived from carbohydrates suggests that the major contribution to band 2 is not from lipids, but from the strong C–H vibrational modes of carbohydrates. The other grouping in the PC analysis contained bands derived from protein (4–6) together with band 7.
A different pattern was observed in Aphanizomenon, with bands 1 and 2 showing a strong correlation, and grouping together in the PC analysis, but neither band showing any correlation with bands derived from ν(C–O–C) stretching of polysaccharides. Assignment of band 2 in Aphanizomenon is therefore difficult, as there is no statistical link to either carbohydrates or lipids. However, bands attributable to carbohydrate 8–10 were grouped together in the PC analysis (together with band 7), as were bands with a strong protein derived component (4–6).
Differences in the correlation patterns and PCA plots may relate to the fact that Anabaena has abundant surface mucilage, while Aphanizomenon does not. The retention of surface water by mucilage may explain why band 1 (water, protein) is correlated with carbohydrate in Anabaena. Aphanizomenon does not have copious surface mucilage, and the infrared signal from carbohydrate in this alga is apparently derived largely from internal stores. There is no correlation with band 1 (residual water and protein) in this alga. The negative correlation of carbohydrate-derived bands with band 4 (protein) may reflect the fact that starch synthesis leads to a proportional decrease in protein (per unit dry weight).
The FTIR spectra of environmental isolates obtained in this study are similar to those in other published work on planktonic algae. Kansiz et al. (Citation1999) looked at five cyanobacterial taxa (laboratory cultures) and found a similar band pattern to those cyanobacteria observed in this study.
Differences occur, however, between these cyanobacteria and the green alga Pediastrum (Sigee et al., Citation2002) from the same lake environment. Unlike the cyanobacteria, Pediastrum showed distinct bands at 3,012 and 2,852 cm−1 (lipids) and at 1,739 cm−1 (ester functional groups primarily from lipids and fatty acids). Furthermore, within the υ(C–O–C) stretching region of polysaccharides (1,200–900 cm−1), Pediastrum exhibited a maximum absorbance at 1,077cm−1, while the maximum absorbance due to carbohydrate in the cyanobacteria was at 1,022cm−1.
Differences also occur with the marine diatom Chaetoceros muellerii (Giordano et al., Citation2001). Although a band pattern similar to this study was observed over the majority of the wavenumber range, the portion of the spectrum that contained υas(>P=O) stretching of nucleic acid (1,230cm−1), and the υ(C–O–C) stretching of polysaccharides (1,200–900cm−1), was obscured by the very strong band attributed to the Si–O stretching of the silica frustules. These differences suggest that major taxonomic differences in phytoplankton may be reflected in the band pattern of FTIR spectra.
Molecular heterogeneity within micropopulations
Intraspecific variation in band intensity gives a measure of population heterogeneity, indicating how intracellular concentrations of macromolecular components varied between algae taken from the same population. This intraspecific molecular heterogeneity is indicated by high coefficients of variation (CV) in band intensity, suggesting that colonies vary considerably in the concentrations of the different molecular groups.
In both species, bands 2, 8, 9 and 10 showed the highest variation (). As discussed earlier, all of these bands are probably derived from carbohydrate, and the high variation in band intensity suggests that the algal populations exhibit a high degree of variation in the amount of polysaccharide storage material within individual cells.
In Aphanizomenon, significantly lower levels of carbohydrate were observed in algae from the hypolimnion. However, high CV were observed in subpopulations from both the epilimnion and hypolimnion, suggesting that high variation in carbohydrate levels occurred at both depths.
Anabaena showed higher carbohydrate concentrations than Aphanizomenon, with lower coefficients of variation in the carbohydrate derived bands. It is possible that the higher concentrations are due to the presence of greater extracellular mucilage in Anabaena, and that the contribution of mucilage may mask any variation in intracellular concentrations. Slightly higher CV were noted in the hypolimnion, suggesting that the different conditions in the lower part of the lake may have contributed to increased heterogeneity in carbohydrate concentrations.
Other bands also showed high variation, with CV generally ranging between 20 and 40%. Band 4 showed the smallest CV in both algae. The small variation exhibited by this band (amide II) may be a result of the fact that the spectra were normalized to amide I, so that variations in band intensity of amide II were correspondingly reduced.
Similar intracellular chemical heterogeneity has been demonstrated in studies of elemental composition using X-ray microanalysis (XRMA) in a variety of lake cyanobacteria (El-Bestawy et al., Citation1996; Sigee et al. Citation1999b , Sigee & Levado, Citation2000). Both FTIR and XRMA studies thus indicate chemical heterogeneity within lake cyanobacteria.
Species comparisons
Interspecific comparison of the two algae was carried out for subpopulations from both the epilimnion and hypolimnion. Although the FTIR spectra of Anabaena and Aphanizomenon initially appeared to be similar in terms of band number, wavenumber position and molecular assignment, major differences emerged in relation to band intensities, and in relation to PC analysis of the spectral region 1,750–900 cm−1.
Interspecific differences were observed in the epilimnion, with bands due largely to protein (5, 6) and nucleic acid plus other P-containing compounds (7) being significantly different between the species, plus differences in carbohydrate concentration (peaks 9, 10). The PCA analysis also showed that the two species could be separated largely on the basis of differences in carbohydrate absorbance. Interspecific differences were also observed in the hypolimnion, where both band intensity and PC analysis again showed the difference to be largely due to carbohydrate. Thus, not only does carbohydrate show the greatest heterogeneity of the molecular groups, it also distinguishes between subpopulations in the epilimnion and hypolimnion. This may reflect differences in the amount of mucilage between the algae, or relate to local environmental conditions, or to the two species being at different growth stages.
Depth variation
During summer bloom formation in a eutrophic lake (such as Rostherne Mere), irradiance may vary from about 2,000 µmol photons m−2 s−1 at the lake surface to less than 1% of this value in the lower epilimnion (Hill, Citation1996). In bright sunlight, epilimnion and hypolimnion populations will thus differ markedly in terms of energy input and general physiology. In addition, populations will differ in relation to other local factors, such as external nutrient concentrations and temperature. In this study, FTIR comparison of epilimnion and hypolimnion samples suggests that Aphanizomenon occurs as subpopulations within the water column, with hypolimnion samples having significantly lower carbohydrate/protein ratios than epilimnion samples. Although cyanobacteria are known to undergo diurnal migration across the thermocline, the lower levels of carbohydrate seen in hypolimnion populations of Aphanizomenon are consistent with at least some of the colonies being retained as stable populations within the hypolimnion. Under the limiting light conditions that occur in this part of the water column, the algae would be expected to invest less of their photosynthetic energy into carbohydrate storage material (Geider & MacIntyre, Citation1996). The results observed in this study are therefore consistent with the physiological response of algae under poor growth conditions, when the synthesis of proteins increases and the synthesis of storage products such as carbohydrates is reduced (Maranon et al., Citation1995; Maranon and Gonzalez, Citation1997).
Anabaena showed a much poorer separation between epilimnion and hypolimnion populations. It may be that the physiological response of Anabaena to conditions within the hypolimnion (such as reduced irradiance) is not as marked as that exhibited by Aphanizomenon. Alternatively, as discussed earlier, any differences in the internal cellular concentrations of carbohydrate between epilimnion and hypolimnion populations may be masked by the high mucilage content associated with Anabaena colonies.
Conclusions
This paper demonstrates differences between micropopulations of cyanobacteria within a stratified lake, and shows that FTIR can be used to determine intraspecific differences in relation to variation in microenvironment within the water column, and interspecific differences between algal species sampled from the same environment. However, the authors acknowledge that caution must be shown when interpreting the causal mechanisms for these differences, since a whole range of factors could influence the molecular characteristics of cells. Observed interspecific differences in this study may be due to intrinsic characteristics (e.g. level of mucilage) or environmentally-determined differences. Alternatively, interspecific differences between the algal species may result from the algae being at different growth stages. As with other microanalytical studies on phytoplankton (e.g. Sigee et al., Citation1999a , Citation b ), the results obtained in this study provide information on algae within a small part of a particular lake environment. Although these data should not be automatically extrapolated to biota within the whole lake or to other lakes, they give some insight into molecular heterogeneity and environmental interactions within small samples of phytoplankton.
Acknowledgments
D.C.S. gratefully acknowledges the Central Laboratory of Research Councils, UK (Grant reference no. 34070). The authors also thank Dr M.J. Tobin (Daresbury Laboratory) for his technical assistance during FTIR analysis, and English Nature for permission to carry out sampling at Rostherne Mere and provision of boating facilities.
Related Research Data
References
- Benning , LG , Phoenix , VR , Yee , N and Tobin , MJ . 2004 . Molecular characterisation of cyanobacterial silification using synchrotron infrared micro-spectroscopy . Geochim. Cosmochim. Acta , 68 : 729 – 741 .
- Brandenburg , K and Seydel , U . 1996 . “ Fourier transform infrared spectroscopy of cell surface polysaccharides ” . In Infrared Spectroscopy of Biomolecules , Edited by: Mantsch , HH and Chapman , D . 203 – 278 . Chichester : Wiley .
- El-Bestawy , E , Bellinger , E and Sigee , DC . 1996 . Elemental composition of phytoplankton in a subtropical lake: X-ray micro-analytical studies on the dominant algae Spirulina and Cyclotella . Eur. J. Phycol. , 31 : 157 – 166 .
- Geider , RJ and MacIntyre , HL . 1996 . A dynamic model of photoadaptation in phytoplankton . Limnol. Oceanogr. , 41 : 1 – 15 .
- Giordano , M , Kansis , M , Heraud , P , Beardall , J , Wood , B and McNaughton , D . 2001 . Fourier transform infrared spectroscopy as a novel tool to investigate changes in intracellular macromolecular pools in the marine microalga Chaetoceros muellerii (Bacillariophyceae) . J. Phycol. , 37 : 271 – 279 .
- Guibal , E , Roulph , C and Lecloirec , P . 1995 . Infrared spectroscopic study of uranyl biosorption of fungal biomass and materials of biological origin . Environ. Sci. Technol. , 29 : 2496 – 2503 .
- Heraud , P , Wood , B , Beardall , J and McNaughton , D . 1999 . “ Physiological change in microalgae monitored using FT-IR spectroscopy ” . In Spectroscopy of Biological Molecules: New Directions , Edited by: Greve , J , Puppels , GJ and Otto , C . 449 – 450 . Dordrecht : Kluwer Academic Publishers .
- Hill , W . 1996 . “ Effects of light ” . In Algal Ecology , Edited by: Stevenson , R , Bothwell , M and Lowe , RL . 121 – 149 . New York : Academic Press .
- Holman , HN , Martin , MC , Blakely , EA , Bjornstad , K and McKinney , WR . 2000 . IR spectroscopic characteristics of cell cycle and cell death probed by synchrotron radiation based Fourier transform IR spectromicroscopy . Biopolymers , 57 : 329 – 335 .
- Kansiz , M , Heraud , P , Wood , B , Burden , F , Beardall , J and McNaughton , D . 1999 . FTIR spectroscopy as a tool to descriminate between cyanobacterial strains . Phytochemistry , 52 : 407 – 417 .
- Keller , RJ . 1986 . Sigma Library of FT-IR Spectra , St Louis, MO : Sigma Chemical Company .
- Lee , R . 1997 . Phycology , Cambridge : Cambridge University Press .
- Lewis , RN and McElhaney , RN . 1996 . “ Fourier transform infrared spectroscopy in the study of hydrated lipids and lipid bilayer membranes ” . In Infrared Spectroscopy of Biomolecules , Edited by: Mantsch , HH and Chapman , D . 159 – 202 . Chichester : Wiley .
- Liquier , J and Taillandier , E . 1996 . “ Infrared spectroscopy of nucleic acids ” . In Infrared Spectroscopy of Biomolecules , Edited by: Mantsch , HH and Chapman , D . 131 – 158 . Chichester : Wiley .
- Maranon , E , Fernandez , E and Anadon , R . 1995 . Patterns of macromolecular synthesis by natural phytoplankton assemblages under changing upwelling regimes: in situ observations and microcosm experiments . J. Exp. Mar. Biol. Ecol. , 188 : 1 – 28 .
- Maranon , E and Gonzalez , N . 1997 . Primary production, calcification and macromolecular synthesis in a bloom of the coccolithophore Emiliania huxleyi in the North Sea . Mar. Ecol. Prog. Ser. , 157 : 61 – 77 .
- Naumann , D , Schultz , CP and Helm , D . 1996 . “ What can infrared spectroscopy tell us about the structure and composition of intact bacterial cells? ” . In Infrared Spectroscopy of Biomolecules , Edited by: Mantsch , HH and Chapman , D . 279 – 310 . Chichester : Wiley .
- Sacksteder , C and Barry , BA . 2001 . Fourier transform infrared spectroscopy: a molecular approach to an organismal problem . J. Phycol. , 37 : 197 – 199 .
- Sigee , DC and Levado , E . 2000 . Cell surface elemental composition of Microcystis aeruginosa: high-Si and low-Si subpopulations within the water column of a eutrophic lake . J. Plankton Res. , 22 : 2137 – 2153 .
- Sigee , DC , Levado , E and Dodwell , AJ . 1999a . Elemental composition of depth samples of Ceratium hirundinella (Pyrrophyta) within a stratified lake: an X-ray microanalytical study . Aquat. Micr. Ecol. , 19 : 177 – 187 .
- Sigee , DC , Teper , J and Levado , E . 1999b . Elemental composition of the cyanobacterium Anabaena flos-aquae collected from different depths within a stratified lake . Eur. J. Phycol. , 34 : 477 – 485 .
- Sigee , DC , Dean , A , Levado , E and Tobin , MJ . 2002 . Fourier-transform infrared spectroscopy of Pediastrum duplex: characterisation of a micro-population isolated from a eutrophic lake . Eur. J. Phycol. , 37 : 19 – 26 .
- Stuart , B . 1997 . Biological Applications of Infrared Spectroscopy , Chichester : Wiley .
- Villareal , TA and Lipschultz , F . 1995 . Internal nitrate concentrations in single cells of large phytoplankton from the Sargasso Sea . J. Phycol. , 31 : 689 – 696 .
- Wetzel , DL , Eilert , AJ , Pietrzak , LN , Miller , SS and Sweat , JA . 1998 . Ultraspatially-resolved synchrotron infrared microspectroscopy of plant tissue in situ . Cell. Mol. Biol. , 44 : 145 – 167 .
- Wong , PTT , Wong , RK , Caputo , TA , Godwin , TA and Rigas , B . 1991 . Infrared spectroscopy of exfoliated human cervical cells: evidence of extensive structural changes during carcinogenesis . Proc. Natl. Acad. Sci., USA , 88 : 10988 – 10992 .