Abstract
Williams and Kociolek (Citation2007: Eur. J. Phycol., 42: 313–319) have presented an opinion paper in which they review some principles of classification and criticize the most recent classification of the diatoms by Medlin & Kaczmarska (Citation2004: Phycologia, 43: 245–270). In their critique of paraphyletic groups, they failed to consider one paraphyletic relationship that is most frequently revealed by molecular data, which in part justifies the recognition of paraphyletic taxa among certain diatom genera. In their criticism of the most recent classification system of the diatoms, they have misinterpreted and misrepresented much of the molecular data that they have used as evidence against this classification system and thus have made incorrect comparisons among published phylogenies of the diatoms.
The rejection of paraphyletic taxa
Williams & Kociolek (Citation2007) discuss the validity of paraphyletic groups and assert (p. 315) that ‘they should not be deliberately admitted into any classification system’). In , I present one paraphyletic relationship that they have not addressed but that has been recovered more than once in the molecular analyses of the diatoms and other microalgal groups, yet according to their statement above should not be admitted into any classification system. In , genus C has arisen as a monophyletic group from within genus B making that parent genus paraphyletic (B + B′). Applying the arguments presented in Williams & Kociolek (Citation2007), genus C would, de facto, have no right to exist. In the diatoms, molecular data (Lundholm, Citation2001; Kaczmarska et al., Citation2005; Bruder & Medlin, Citation2008; Medlin et al. Citation2008a ) have shown that a monophyletic Fragilariopsis has arisen from within Pseudo-nitzschia, monophyletic Seminavis and Pseudogomphonema have arisen from within Navicula s.s., a monophyletic Skeletonema has arisen from within Thalassiosira, and monophyletic Asterionella and Tabellaria have arisen from within Diatoma. Applying the criteria of Williams & Kociolek (Citation2007), the genera Asterionella, Tabellaria, Seminavis, Pseudogomphonema, Skeletonema and Fragilariopsis would have to cease to exist because they make their parent genus paraphyletic, even though they themselves appear to be monophyletic, albeit within a parent taxon. Nevertheless, all these are good morphological diatom genera that I believe even Williams and Kociolek would be reluctant to eliminate as recently derived genera because they make their parent genus paraphyletic. Obviously, an ideal solution to this problem would be to re-evaluate and rename the sublineages of the parent genus (B) to make B, B′ and C separate genera, with each sublineage being monophyletic. However, in the diatom examples that I have given above, the sublineages (B and B′) appear, in each case, to be good representatives of the parent genus (B) as currently defined. Thus, we are left with no other interpretation but that the parent genus is paraphyletic given its current morphological interpretation. In the case of Fragilariopsis, its sister group contains the type of Pseudo-nitzschia, so if these were all combined into one, then, as the younger genus, Fragilariopsis is invalid. In the case of Skeletonema, all Thalassiosira spp. would have to be transferred into Skeletonema because it is the older genus. Cox & Reid (Citation2004) presented a cladistic analysis that showed Gyrosigma and Pleurosigma to be paraphyletic and Pleurosigma and Toxoneidea to have arisen from within Gyrosigma. The new genus Shionodiscus was established on the basis of morphological evidence by Alverson et al. (Citation2006a ), but molecular evidence shows that it sits within Thalassiosira (Alverson et al., Citation2007), making it illegitimate according to Williams & Kociolek. Alverson et al. (Citation2007) did not acknowledge this but claimed that Thalassiosira should be redefined.
Fig. 1. Schematic drawing of novel lineage (C) arising from within the parental genus B. B′ denotes the sister taxon of B that must go extinct if C is to be considered monophyletic.
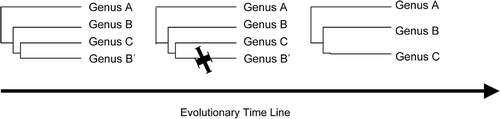
I believe that paraphyly has to exist for some period of time in the evolutionary history of any novel group until its sister taxa are extinct to render the novel lineage monophyletic. Thus, we will always recover some paraphyletic taxa because evolution is not finished but is work constantly in progress and we have sampled the species/genera only at one point in their evolutionary history. This point is discussed at length in Hörandl (Citation2006), Harlin (Citation1998a ,b, 1999), Sosef (Citation1997) and O’Hara (Citation1992). Therefore it is not a novel idea that paraphyletic taxa are often represented as stages in evolutionary scenarios. The following statement is found in Evolution Education Wiki from Wikipedia's chapter on cladistics (http://en.wikipedia.org/wiki/Cladistics) “… paraphyly is largely inevitable in our systematic analyses not least of the reasons being the limit of our taxonomic nomenclature to articulate the dynamic processes of evolution”. If the sister taxa to the new group can be redefined morphologically to make a separate taxon, rendering the new clade (B′ and C in ) into two new monophyletic groups, then so much the better, but if it cannot, then accepting this paraphyletic relationship as a stage in evolution is a more attractive option than to lose one of the genera. “Nature itself does not leave us a choice but to accept paraphyletic taxa” (Sosef Citation1997: 82). The classic example of paraphyly is that birds arose from within the reptiles, making the reptiles paraphyletic. Another good example is that, among the flowering plants, dicots are paraphyletic because they include the monocots. This phenomenon of incomplete separation of clades has repeatedly been found to be in the case in animals, where speciation in progress can be easily documented using molecular methods (Nosil et al., Citation2007).
Criticisms of the new classification system of the diatoms
The paraphyly of the centric diatom clades, which is the major focus of the criticisms of the new diatom classification by Williams & Kociolek (Citation2007), is a consequence of the type of analysis conducted, and in the next section I try to summarize and illustrate the factors that cause this grade of clades in the centric diatoms obtained by some other workers.
Factors affecting the outcome of phylogenetic analyses
There are many factors that can affect the results of a phylogenetic analysis, and if they vary among studies, then it is no wonder that relationships may differ from one analysis to another. A detailed summary of many of these factors can be found in Verbruggen & Theriot (Citation2008). But to sweep aside these differences without discussing or acknowledging that they have caused differences in the results, or why this has occurred, and to dismiss all analyses as being imperfect, is as unsatisfactory as not accepting the consistent relationships that have been recovered when certain features are held constant among the analyses.
Type of algorithm
The type of algorithm used to obtain the tree can produce dramatic differences. Maximum parsimony (MP) analysis has been considered one of the least reliable methods, especially if used without any weighting of the data (Hillis et al., Citation1994) and if sites are not evolving independently, as in the rRNA data set (Schöniger & von Haeseler, Citation1995). Maximum likelihood (ML) has been shown to be superior to neighbour-joining (NJ) and both are considered superior to weighted and unweighted parsimony (Hall, Citation2005; Tateno et al., Citation1994). Bayesian inference analyses (BI) are considered superior to ML analyses (Douady et al., Citation2003) because ML tries to find a single optimum (tree), whereas BI aims to generate a cloud of possibilities with high posterior probabilities from which a consensus tree is derived. Statistical support (bootstrap support; BS) for ML trees can be very computer intensive. Sequences whose sites do not evolve independently, e.g. rRNA sequences (see below), are particularly susceptible to incorrect analysis by MP (Schöniger & von Haeseler, Citation1995), and to a lesser extent in ML and BI, unless a doublet model is used where sites are weighted by their helix position. In Kaczmarska et al. (Citation2005) a comparison of MP, distance, ML and BI, and different models of evolution was presented to illustrate the differences that can be found in the diatom trees recovered by each method.
Other factors
Moving on to the interpretation of the molecular data, several factors will affect the outcome of the analysis: the alignment, number of ingroup taxa, number of outgroup taxa and their diversity, and the number of bases included in the analysis. Hillis & Huelsenbeck (Citation1992) provide extensive discussion, and examples showing the effect of adding more taxa and characters, on the resolution of any phylogenetic signal. When different combinations of factors are used, the results will vary, and this variation in results/methods prompted Sims et al. (Citation2006) to comment “whether or not clade 2a is monophyletic is unclear” (Kooistra et al., Citation2006). They did not discuss the reasons for this statement further, because factors that appear to affect the monophyly of the Coscinodiscophyceae and Mediophyceae had already been discussed (Medlin & Kaczmarska, Citation2004; Kooistra et al., Citation2006). Williams & Kociolek (Citation2007) have completely ignored the discussions on the reasons for the differences in the trees in these papers, and instead concentrated on the differences in the trees, without assessing why they are different. They ignored all variations that can cause the differences in trees and have compared the trees as if they were obtained in an identical fashion, which they were not.
I will discuss the above points systematically and show why the trees are different, and where Williams & Kociolek (Citation2007) have either ignored a tree or misinterpreted one, and consequently misrepresented their conclusions. I show not only my analyses, but also those of others, which support the new diatom classification.
1. Effect of secondary structure on the alignment and resultant trees
Most molecular analyses have been made using the 18S rRNA gene, so I will concentrate my comparison of analytical methods on these analyses. The ribosomal genes have a secondary structure () that must be maintained otherwise the molecule is non-functional. The alignment of species to one another must take account of this secondary structure, otherwise the rRNA sequence will violate a basic assumption that sites evolve independently. They do not, and because of the helix pairing, certain positions cannot change without the other side of the helix changing. This does happen and some positions change faster than others. Information on the evolution of the secondary structure of the rRNA molecule can be found in Higgs (Citation2000), Cataneo-Anolles (2002), Savill et al. (Citation2001), Smith et al. (Citation2004), Dutheil et al. (Citation2005) and Telford et al. (Citation2005). No one would think of analysing protein sequence data alone without translating primary data into amino acids, and a comparison of trees made by aligning DNA alone with those aligned by protein translation shows that, as one would expect, the translated aligned tree is better (Hall, Citation2005; Suyama et al., Citation2006). So there is no reason why the secondary structure of the rRNA molecule should be ignored in the alignment.
Fig. 2. Variability map of the 18S rRNA from http://bioinformatics.psb.ugent.be/webtools/rRNA/varmaps/Scer_ssu.html
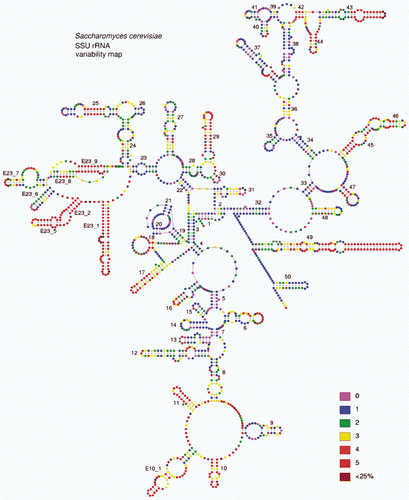
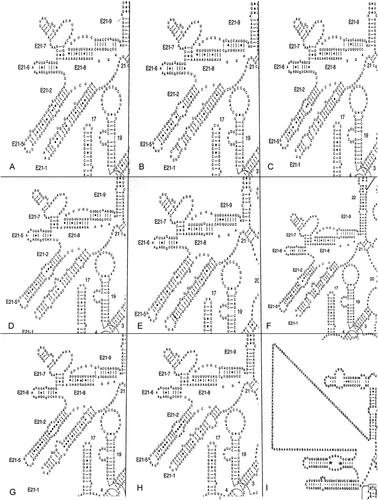
A simple clustal alignment aligns bases according to similarity and not on position in a helix. In a secondary structure alignment, bases must be aligned according to their position in the secondary structure. Reconstructions of the phylogenetic history of a group of organisms on both a global (Caetano-Annolles, Citation2002) and local (Billoud et al., Citation2000) scale have shown evolution in the structure of the rRNA molecule by coding stem lengths and position of loops as morphological characters. Lengthening, shortening or opening of a helix follows a set evolutionary path, and thus confers a phylogenetic signal, as does the path leading to compensatory base changes across the helix. The V4 region of the 18S rRNA gene is the most variable part of that molecule and the most difficult to align if one does not have a secondary structure as guide (see the upper left hand helices in ). In , I show this region from seven diatoms, plus one bolidomonad, using the van der Peer model in , and the same region from Toxarium (Alverson et al., Citation2006b ) using the Gutell model in which a large portion of the V4 region is unstructured and the alignment cannot be guided by secondary structure in this region (Fig, 3I). In the first loop E22 helix of Toxarium, two base pairs were missed by Alverson et al. (Citation2006b ), marked on this figure with an *. One can see similarities in the two diatoms in the Coscinodiscophyceae (), the three diatoms in the Mediophyceae () and the two diatoms in the Bacillariophyceae (). These are not the only structures for this region in the three classes but they are the dominant ones (data not shown). Thus, the secondary structure in this region of the rRNA gene confers a phylogenetic signal, which is lost, if no structure is recognized, as in the Gutell model (Alverson et al., Citation2006b ), or if it is aligned using clustal. Other species represent small variations on the main scheme. However, one will find only slight variations of the secondary structure for a class, and not find the dominant structure of one class in that of another. There is a general tendency for the stems to evolve to become shorter and less complex, which is evident in the secondary models shown in (compare the shorter length of helix 21-2 in of the outgroup plus the two Coscinodiscophyceae to of the pennate diatoms).
Fig. 3. Secondary structure of the V4 region from (A) Bolidomonas, (B) Stephanopyxis, (C) Rhizosolenia, (D) Porosira, (E) Cymatosira, (F) Ditylum, (G) Fragilaria, (H) Nitzschia and (I) Toxarium. Redrawn with permission from http://www.rna.ccbb.utexas.edu/DAT/3B/Standard/index.php?xysub=1&organism=Toxarium&seq_size=&rna_type=&orf=&rna_class=&from_gene=&structure=ALL&cell_loc=&ord=&xyac_info=m&xybegin=0&xyrange=50&xyco=yes&query_type=results.
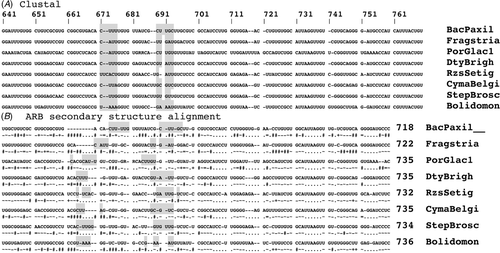
An alignment of the helices E21 and E22, which are the most variable helices in the rRNA molecule, is shown in . Alignment A is made using CLUSTAL and alignment B by secondary structure in the ARB program. I have coloured two regions to show how different the alignments are. Using the guides for base pairing (), it is easy to see how the secondary structure is maintained in the ARB alignment, how to place the bases in the correct position and when the secondary structure is broken by a base substitution, deletion, or misplacement.
Fig. 4. Alignment of the helices E21 and E22 using CLUSTAL (A) and a secondary structure model (B). Note there is an 18 base-pair shift in the base numbering in the secondary structure model. In the secondary structure alignment, the marks under the bases refer to the type of bond that base has in the helix. Key: ∼: strong Watson and Crick pairing, viz., C–G or A–T; -: weak Watson and Crick pairing, viz., G–A; =: weak Watson and Crick pairing, viz., G–U;.: loop no pairing; +: weak Watson and Crick pairing, viz., U–U; #:alignment breaks the secondary structure, this mark reveals a base in the wrong position and that base must be moved until the mark under the base reflects the best Watson and Crick pairing that can be obtained.
The ARB program does the alignment automatically when new sequences are inserted into the database, and one only needs to scan the alignment to check for minor errors for optimization. The database alignment never changes as more sequences are added to the original alignment. The only place where the ARB alignment will change is in the loops, where the addition of more taxa may improve this part of the alignment, the only regions aligned by primary sequence similarity.
There is a database tree within the ARB program to which new sequences are added by parsimony. This parsimony tree is not intended as the optimal tree because it is not possible to specify a model of evolution with parsimony methods and a subset of the taxa and the bases would normally be downloaded, depending on the filter used to select the bases from the alignment, for analysis with phylogenetic analysis packages with appropriate models of evolution. The database tree in ARB is maintained so that new species are added to an already existing tree without recalculating the tree which, for nearly 280 000 species, would be extremely computer intensive whenever a new species was added. Parsimony is the optimal method to achieve this in the ARB program. It is not designed to be the optimal tree but when sequences are aligned against a database background of thousands of species (currently nearly 280 000 full-length sequences and a database tree) the error of placement is reduced but the branch lengths may not be optimal.
shows NJ trees made from the two different alignments of the entire rRNA shown partially in . The CLUSTAL alignment produced a tree in which Porosira sits at the base of all diatoms, after which centrics are separated from pennates in a traditional sense. The secondary structure tree is completely different and shows monophyletic Coscinodiscophyceae, Mediophyceae and Bacillariophyceae. A comparison of clustal and secondary structure alignments and their resultant trees can also be found in Medlin et al. (Citation2008b ) using a larger data set (53 taxa) than in . The same result was obtained with the larger data set. The clustal alignment produced a grade of clades and the ARB alignment recovered monophyletic Coscinodiscophyceae, Mediophyceae and Bacillariophyceae (Medlin et al., Citation2008b ). Sörhannus (Citation2004) obtained a grade of clades for 126 taxa aligned by clustal and analysed by MP and direct optimization (DO). However, when another data set of 35 taxa, aligned by secondary structure (available already aligned from the European ribosomal RNA database), was analysed by two different methods (MP and direct optimization), MP analysis of the secondary structure alignment recovered the Mediophyceae as monophyletic, and the DO analysis recovered the Coscinodiscophyceae as monophyletic. These differences are not discussed in Sörhannus (Citation2004) and he chose the tree from the larger clustal-aligned data set as his optimal tree.
Fig. 5. Phylogenetic trees constructed with a neighbour joining method from the full 18S rRNA gene in alignment (A) and (B).
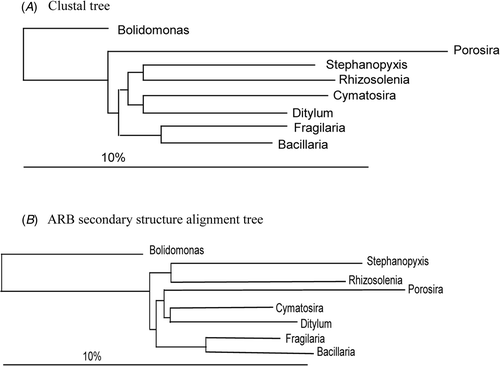
Thus, the effect of a clustal alignment vs a secondary structure alignment has to be considered as one of the primary differences affecting tree topology when the ribosomal genes are used. If we examine the trees made by other workers and evaluate them for comparable features, we find that very few of them use secondary structure alignment (); this is therefore the first major difference in the trees obtained by different workers. Such a difference in tree topology from different alignments was first shown by Medlin et al. (Citation1993). shows a tree produced by secondary structure alignment, and shows two trees from a clustal alignment of the same data set. In the clustal tree (produced by D. M. Williams) the Phaeophyceae and Xanthophyceae are sister to Nitzschia inside the diatoms, which must be an artefact of the alignment, whereas in the secondary structure tree, we find a monophyletic Coscinodiscophyceae, Mediophyceae and Bacillariophyceae.
Fig. 6. Clustal alignment trees reproduced from Medlin et al. (Citation1993). Tree made by D. M. Williams.
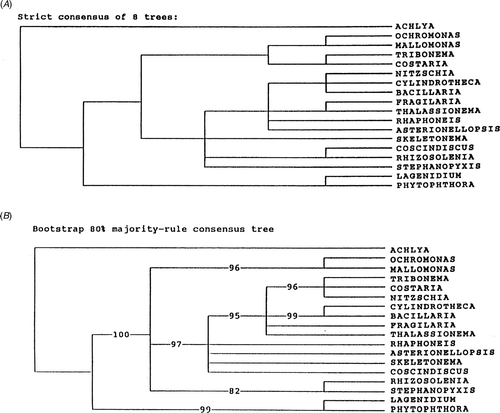
Fig. 7. Secondary structure tree reproduced from Medlin et al. (Citation1993). Tree made by L. K. Medlin.
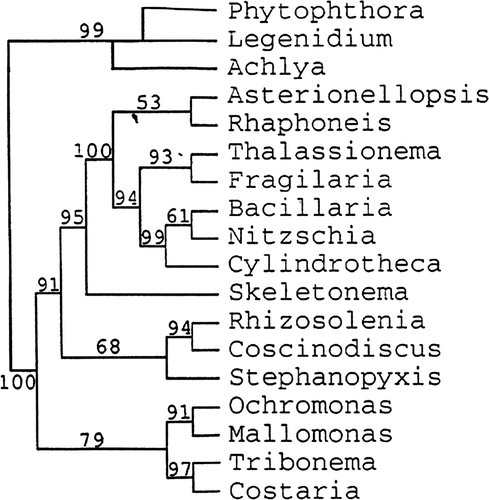
Table 1 Comparison of molecular phylogenetic studies assessing the monophyly of the revised classification system by Medlin and Kaczmarska (Citation2004).
In much the same way, the trees produced by Kooistra et al. (Citation2006) did not use secondary structure alignment and differ from those produced by Medlin and her co-workers. In all Kooistra's papers where trees differ from those of Medlin, the differences have been attributed to alignment differences. His result with his alignment was acknowledged in Sims et al. (Citation2006). Thus, there are only three laboratories () (apart from my own) that have produced diatom phylogenies using secondary structure for alignment, and of these, only Sinninghe-Damsté et al. (Citation2004) and Medlin have used the same secondary structure model in the ARB alignment. Therefore, these two trees were obtained using an identical, or nearly identical, alignment. Variations in the alignments can only be in the loop regions, where each has changed the alignment independently, because of additional data of new sequences to the original ARB alignment.
As mentioned above, there are various models and three different secondary structure alignments that are publicly available (RDP, European Ribosomal database and ARB). They are not the same. The trees produced by Sinninghe-Damsté et al. (Citation2004) and Medlin are very similar, but differ in the method used to create the tree (NJ vs MP) and in the number of outgroup and ingroup species. Both found the Coscinodiscaceae to be monophyletic, and in the Sinninghe-Damsté tree, the Mediophyceae comprise one major clade and a small clade containing Attheya spp.
2. Number of outgroup taxa
In , the only analyses that use outgroups outside the heterokonts are shown in bold. The influence of the number of outgroup taxa on the recovery of the monophyletic groups was discussed by Medlin & Kaczmarska (Citation2004) as a reason for the monophyletic clades in their , vs the grade of clades in their and . This explanation was ignored by Williams & Kociolek (2007), who also ignored Medlin & Kaczmarska's , concentrating only on their and , with a single outgroup species. was supported by BS analyses with a data set of 281 outgroup taxa, ranging from prokaryotes to eukaryotes. To perform the statistical tests to validate the stability of the clades requires more extensive computer time with more taxa in the ingroup or the outgroup. It took over 3 months for the ML tree (Medlin & Kaczmarska, Citation2004: ) to run, and 1 month for the BS analyses to run with the 281 outgroup taxa that produced the statistical support (Medlin & Kaczmarska, Citation2004: ). The initial ARB database tree (their ) used 8600 prokaryotic and eukaryotic outgroups and represents the tree maintained in the ARB database at that time. It is not always feasible to use many outgroups and to undertake complicated model-based analyses unless one has access to very powerful computers.
The tree presented in Sims et al. (Citation2006) used two parallel processors and ran for 1 month. There are seven times more ingroup taxa in this dataset than in that in Medlin & Kaczmarska (Citation2004). Perhaps with more outgroups and a more robust algorithm, Sinninghe-Damsté et al. (Citation2004) might have found Attheya included in the Mediophyceae. Sato (Citation2008) produced a phylogeny with four molecular markers and two different sets of outgroup taxa. One dataset had only bolidomonads as outgroup taxa; the second had multiple heterokont outgroup taxa. Only the latter recovered the Coscinodiscophyceae and the Mediophyceae as monophyletic using ML analyses. BI analysis did not do so because the outgroups were within the heterokonts.
3. Position variability weighting
Another point that varies among the analyses is whether or not the data are weighted by the frequency with which they change. Again we must refer to the secondary structure to understand this. Because secondary structure must be maintained at all times, some of the positions cannot vary, or if they do, then there must be a base change on the other side of the helix to maintain the secondary structure. These compensatory base changes should carry more weight than base changes that occur in the loops, where there is no restriction to mutation. In the early analysis by Hillis et al. (Citation1994), the weighted analysis of all methods tested produced the correct tree, but the number of nucleotides needed to obtain the correct tree varied with the method. This result has been repeatedly recovered (Hall, Citation2005). Van der Peer et al. (Citation1996) mapped the variability of the rRNA molecule () and performed analyses using a weighting mask that matches the variability of each position.
Misinterpretation and misrepresentation of data by other workers
Williams & Kociolek (Citation2007: 317) claim that none of the alternative trees produced by other workers “support the monophyly of either the Coscinodiscophytina (aceae) or the Mediophyceae”. They cite Sörhannus (2005–this was incorrectly cited and should be 2004), Sinninghe-Damsté et al. (Citation2004), Alverson & Theriot (Citation2005), Alverson et al. (Citation2006b ) and Cavalier-Smith & Chao (Citation2006) as workers who have not recovered the new diatom classes as monophyletic taxa. From their list, Alverson & Theriot (Citation2005) did not produce their own trees but instead reviewed trees by others, so they have produced no alternative trees and as such should not be included in this list.
The Coscinodiscophytina (-ceae) are monophyletic in Sinninghe-Damsté et al. (Citation2004), Sörhannus (Citation2004, ) and Cavalier-Smith & Chao (Citation2006) and the Mediophyceae are monophyletic in Sörhannus (Citation2004, ) and composed of only two clades (Sinninghe-Damsté et al., Citation2004: ; Cavalier-Smith & Chao, 2006). Because these are all examples of workers outside Medlin's lab who have recovered either the Coscinodiscophyceae or the Mediophyceae as monophyletic, or the Mediophyceae in only two clades rather than as a grade of clades, it cannot be true that none of the alternative trees produced by other workers “support the monophyly” of the new classes. Thus in three of the five references that Williams & Kociolek (Citation2007) used to support their claim that the classes are not monophyletic, trees can be found that find the classes to be monophyletic. I suggest that this constitutes serious misinterpretation of the data by Williams & Kociolek (Citation2007).
Furthermore, two additional sets of studies published recently also show that the Coscinodiscophyceae are monophyletic (Choi et al., Citation2008; Medlin et al., Citation2008b ) as well as the Mediophyceae (Medlin et al., Citation2008b ). shows an analysis of diatom phylogeny papers producing trees, including those using other genes, summarizing these major points discussed above. A more in-depth review of phylogenetic papers covering some aspects of diatom evolution can be found in Mann & Evans (2008).
Thus, on the basis of secondary structure alignment from the ARB database, using a Bayesian analysis with multiple distant outgroups, Medlin & Kaczmarska (2004) revised the classification of the diatoms. This recent classification has not been made without accompanying morphological support, so it is incorrect to infer that they have been made with “little thought or explanation as to what exactly those groups are indicating–if anything at all” (Williams & Kociolek, Citation2007: 313). A Latin description of morphological features is required to make any new taxon and this was done for each of the new taxa in the diatom classification; older taxa were emended as required. Thus, both thought and explanation went into the description of these taxa. In 1751, Linnaeus argued “Scias characterem non constituere genus, sed genus characterem. Characterem fluere e genere, non genus e charactere. Characterem non esse, ut genus fiat, sed ut genus noscatur.” Agassiz (Citation1859, p. 368) translated this text as: “Characters do not form a genus but the genus constitutes the characters. Characters are not there so that there should be a genus, but in order that the genus should be recognized.” Using our analysis with the most outgroups, we were able to recover the monophyly of the two centric classes, and on that basis we revised the diatom classification. We did not use the ML analysis, which recovered grades of clades as the basis for our decision to revise the taxonomy in Medlin & Kaczmarska (Citation2004), but instead used our database tree (over 8600 sequences at that time), which recovered our classes as monophyletic. Our decision was vindicated with the model-based tree published in Sims et al. (Citation2006) where BI analysis also recovered the classes as monophyletic. The type of auxospore (specialized zygote of the diatoms) has proven to be the most reliable feature defining the new classes of the diatoms and the arrangement of the Golgi body defines the new subdivisons.
On a final note, Williams & Kociolek (Citation2007) claimed that Medlin et al.'s alignments are not publicly available. This is also incorrect. Medlin originally used the RDP alignment that came with the Olsen sequence editor, which was published (Bhattacharya et al., Citation1992) before the alignment was made publicly available at the RDP website (http://rdp.cme.msu.edu/). In 2005, Medlin changed to the ARB alignment (http://www.arb-home.de/), and there is now an automatic alignment service with this database, with which one may upload sequences (up to 50) and the website performs the alignment (www.silva-arb.de). In that program, the current database has more than 280 000 full-length sequences and maintains a similar sized database tree. As new sequences are uploaded, they are aligned to the existing alignment, which does not change, and placed into the data base tree, without recalculation of that tree. There is no question that these alignments are publicly available. However, in order to reproduce analyses, one has to:
-
have the bases that were selected from the alignment for the analysis (these are in the Nexus files);
-
use the same analytical methods (these are in the material and methods of papers);
-
know and use any changes in the default functions in the programs (these are also in the material and methods section of papers) and
-
know any parameters added to the analysis from, for example, the model test program (these are also in the Nexus files).
Even with all this information, results can be slightly different because random additions are used in the molecular analyses, and different suboptimal islands of trees will be searched each time a random analysis is done. Such differences can be seen in the re-analysis of a Nexus file from Kooistra et al. (Citation2003 a) by Alverson et al. (Citation2006b ) in which Kooistra used the default option of seven random additions and Alverson et al. (Citation2006b ) used 100 random additions and obtained similar tree topology, but with a lower log likelihood score. Nexus files can be requested from any author or are supplied in supplementary data. Providing an alignment will not enable someone to duplicate any analysis, they must also have the Nexus file and any modifications to it. In the ARB program I used the bases selected by a 50% parsimony variability, which is built into the program, and thus the bases were not selected randomly but by parsimony. Unless one has experience with sequence analysis packages, one cannot read and understand all the subtleties in the material and methods. Nevertheless, in the spirit of good science, the results could be repeated.
There are of course still many open questions in diatom evolution that can only be solved by increased sequencing effort. These include such questions as: (i) How many distant outgroups/additional genes do you have to add to the dataset before the three classes are recovered as monophyletic in all types of analyses with good support? (ii) What are the relationships among the taxa at higher taxonomic levels such as orders? (iii) What is the correct position of the Eunotiales? (iv) How many cosmopolitan species are really species complexes? (v) How have cosmopolitan species complexes speciated?
One would hope that a consensus resolution to all of these questions could be reached without one type of analysis/conclusion being deemed inappropriate.
Acknowledgements
I wish to thank the reviewers for their comments that improved this manuscript.
References
- Agassiz , L . 1859 . An Essay on Classification , Cambridge, MA : Harvard University Press .
- Alverson , AJ , Cannone , JJ , Gutell , RR and Theriot , EC . 2006b . The evolution of elongate shape in diatoms . J. Phycol. , 42 : 655 – 668 .
- Alverson , AJ , Kang , SH and Theriot , EC . 2006a . Cell wall morphology and systematic importance of Thalassiosira ritscheri (Hustedt) Hale with a description of Shinodiscus gen . nov. Diatom Res. , 21 : 251 – 262 .
- Alverson , AJ and Theriot , E . 2005 . Comments on recent progress toward reconstruicting diatom phylogeny . Nanosci. Nanotech. , 5 : 57 – 62 .
- Alverson , AJ and Theriot , E . 2007 . Bridging the Rubicon: Phylogenetic analysis reveals repeated colonization of marine and fresh waters by thalassiosiroid diatoms . Mol. Phylog. Evol. , 45 : 193 – 210 .
- Bhattacharya, D., Medlin, L., Wainwright, P.O., Ariztia, E.V., Bibeau, C., Stickel, S.K. & Sogin, M.L. (1992). Algae containing chlorophylls a + c are paraphyletic: molecular evolutionary analysis of the Chromophyta. Evolution 46: 1808–1817; Errata. Evolution 47: 98.
- Billoud , B , Guerrucci , M-A , Masselot , M and Deuttsch , J . 2000 . Cirripede phylogeny using a novel approach: molecular morphometrics . Mol. Biol. Evol. , 17 : 1435 – 1445 .
- Bruder , K and Medlin , LK . 2008 . Molecular assessment of phylogenetic relationships in selected species/genera in the naviculoid diatoms. III. Hippodonta and Navicula sensu stricto . Diatom Res , 23 : 331 – 347 .
- Caetano-Annoles , G . 2002 . Tracing the evolution of RNA structure in ribosomes . N.A.R. , 30 : 2575 – 2587 .
- Cavalier-Smith , T and Chao , EE-Y . 2006 . Phylogeny and megasystematics of phagotrophic heterokonts (Kingdom Chromista) . J. Mol. Evol. , 62 : 388 – 420 .
- Choi , HG , Joo , HM , Jung , W , Hong , SS , Kang , JS and Kang , SH . 2008 . Morphology and phylogenetic relationships of some psychrophilic polar diatoms (Bacillariophyta) . Nova Hedwig., Beih. , 133 : 7 – 30 .
- Cox, E.J. & Reid, G.R. (2004). Generic relationships within the Naviculineae: a preliminary cladistic analysis. In Proceedings of the 17th International Diatom Symposium (Poulin, M. editor), 49–62, Biopress, Bristol, UK.
- Douady , CJ , Delsuc , F , Boucher , Y , Doolittle , WF and Douzery , EJO . 2003 . Comparison of Bayesian and Maximum Likelihood bootstrap measure of phylogenetic reliability . Mol. Biol. Evol. , 20 : 248 – 254 .
- Dutheil , J , Pupko , T , Jean-Marie , A and Galtier , N . 2005 . A model-based approach for detecting coevolving positions in a molecule . Mol. Biol. Evol. , 22 : 1919 – 1928 .
- Ehara , M , Inagaki , Y , Watanabe , KI and Ohama , T . 2000 . Phylogenetic analysis of diatom coxI genes and implications of a fluctuating GC content on mitochondrial genetic code evolution . Cur. Gen. , 37 : 29 – 33 .
- Fox , M and Sörhannus , U . 2004 . The usefulness of the Rpo mitochondrial gene in assessing diatom evolution . J. Euk. Microbiol. , 50 : 471 – 475 .
- Hall , BG . 2005 . Comparison of the accuracies of several phylogenetic methods using protein and DNA sequences . Mol. Biol. Evol. , 22 : 792 – 802 .
- Härlin , M . 1998a . Tree-thinking and nemertean systematics, with a systematization of the Eureptantia . Hydrobiologia , 365 : 33 – 46 .
- Härlin , M . 1998b . Taxonomic names of phylogenetic trees . Zoologica Scripta , 27 : 381 – 390 .
- Härlin , M . 1999 . The logical priority of the tree over characters and some of its consequences for taxonomy . Biol. J. Linn. Soc. , 68 : 497 – 503 .
- Higgs , PG . 2000 . RNA secondary structure: physical and computational aspects . Q. Rev. Biophys. , 30 ( 3 )
- Hillis , DM and Huelsenbeck , JP . 1992 . Signal, noise and reliability in molecular phylogenetic analysis . J. Hered. , 83 : 189 – 195 .
- Hillis , DM , Huelsenbeck , JP and Cunningham , CW . 1994 . Application and accuracy of molecular phylogenies . Science , 264 : 671 – 676 .
- Hörandl , E . 2006 . Paraphyletic vs monophyletic taxa–Evolutionary versus cladistic classifications . Taxon , 55 : 564 – 570 .
- Kaczmarska , I , Beaton , M , Benoit , AC and Medlin , LK . 2005 . Molecular phylogeny of selected members of the Order Thalassiosirales (Bacillariophyta) and evolution of the fultoportula . J. Phycol. , 42 : 121 – 138 .
- Kooistra , WHCF , Chepurnov , V , Medlin , LK , De Stefano , M , Sabbe , K and Mann , DG . 2006 . “ Evolution of the diatoms ” . In Plant Genome: Biodiversity and Evolutiion , Edited by: Sharma , AK and Sharma , A . Vol. 2B , 117 – 178 . Enfield, NH : Science Publishers .
- Kooistra , WHCF , De Stefano , M , Mann , DG , Salma , N and Medlin , LK . 2003a . The phylogenetic position of Toxarium, a pennate-like lineage within centric diatoms (Bacillariophyceae) . J. Phycol. , 39 : 185 – 197 .
- Kooistra , WHCF , Mann , DG and Medlin , LK . 2003b . “ The phylogeny of the Diatoms: A review ” . In Silica in Biological Systems , Edited by: Müller , W . 59 – 97 . Amsterdam : Elsevier Press .
- Kooistra , WHCF and Medlin , LK . 1996 . Evolution of the diatoms (Bacillariophyta): IV. A reconstruction of their age from small subunit rRNA coding regions and the fossil record . Mol. Phylog. Evol. , 6 : 391 – 407 .
- Linnaeus, C. (1751). Philosophia Botanica. Stockholm.
- Lundholm, N. (2001). What is Pseudo-nitzschia and what is Fragilariopsis? Chapter VII. In A Study of Pseudo-nitzschia Based on Morphology and Molecular Phylogeny–With Implications for the Systematics of Bacillariaceae. Ph.D. dissertation. University of Copenhagen.
- Mann , DG and Evans , KM . 2008 . “ Molecular genetics and the neglected art of diatomics ” . In Unravelling the Algae, the Past, the Present, and Future , Edited by: Lewis , J and Brodie , J . 231 – 265 . London : Elsevier .
- Medlin , LK , Gersonde , R , Kooistra , WHCF and Wellbrock , U . 1996a . Evolution of the diatoms (Bacillariophyta). II. Nuclear-encoded small-subunit rRNA sequence comparisons confirm a paraphyletic origin for the centric diatoms . Mol. Biol. Evol. , 13 : 67 – 75 .
- Medlin , L , Jung , I , Bahulikar , R , Mendgen , K , Kroth , P and Kooistra , WHCF . 2008a . Evolution of the Diatoms. VI. Assessment of the new genera in the araphids using molecular data . Nova Hedwig., Beih. , 133 : 81 – 100 .
- Medlin , LK and Kaczmarska , I . 2004 . Evolution of the diatoms: V. Morphological and cytological support for the major clades and a taxonomic revision . Phycologia , 43 : 245 – 270 .
- Medlin , LK , Kooistra , WHCF , Gersonde , R and Wellbrock , U . 1996b . Evolution of the diatoms (Bacillariophyta). III. Molecular evidence for the origin of the Thalassiosirales . Nova Hedwig. , 11 : 221 – 234 .
- Medlin , LK , Kooistra , WHCF , Potter , D , Saunders , GW and Anderson , RA . 1997 . Phylogenetic relationships of the ‘golden algae’ (haptophytes, heterokonts, chrysophytes) and their plastids . Pl. Sys. Evol. (Supplement) , 11 : 187 – 210 .
- Medlin , LK , Kooistra , WHCF and Schmid , AMM . 2000 . “ A review of the evolution of the diatoms–a total approach using molecules, morphology and geology ” . In The Origin and Early Evolution of the Diatoms: Fossil, Molecular and Biogeographical Approaches , Edited by: Witkowski , A and Sieminska , J . 13 – 35 . Cracow, , Poland : Szafer Institute of Botany, Polish Academy of Science .
- Medlin , LK , Sato , S , Mann , DG and Kooistra , WCHF . 2008b . Molecular evidence confirms sister relationship of Ardissonea, Climacosphenia and Toxarium within the bipolar centric diatoms (Mediophyceae, Bacillariophyta) . J. Phycol. , 44 : 1340 – 1348 .
- Medlin , LK , Williams , DM and Sims , PA . 1993 . The evolution of the diatoms (Bacillariophyta). I. Origin of the group and assessment of the monophyly of its major divisions . Eur. J. Phycol. , 28 : 261 – 275 .
- Nosil , P . 2007 . Divergent host plant adaptation and reproductive isolation between ecotypes of Timenema cristinae walking sticks . Am. Nat. , 169 : 151 – 162 .
- Nübel , U , Garcia-Ppichel , F , Clavero , E and Muyzer , G . 2000 . Matching molecular diversity and ecophysiology of benthic cyanobacteria and diatom in communities along a salinity gradient . Env. Microbiol. , 2 : 217 – 226 .
- O’Hara , RJ . 1992 . Telling the tree: narrative representation and the study of evolutionary history . Biology and Philosophy , 7 : 135 – 160 .
- Sato, S. (2008). Phylogeny of araphid diatoms, inferred from morphological and molecular data. PhD dissertation, University of Bremen
- Savill , NJ , Hoyle , DC and Higgs , PG . 2001 . RNA sequence evolution with secondary structure constraints: comparison of substitution rate models using Maximum-Likelihood methods . Genetics , 157 : 399 – 411 .
- Schöniger , M and von Haeseler , A . 1995 . Performance of the Maximum Likelihood, Neighbor Joining, and Maximum Parsimony analyses when sequence sites are not independent . Syst. Biol. , 44 : 533 – 547 .
- Sims , PA , Mann , DG and Medlin , LK . 2006 . Evolution of the diatoms: Insights from fossil, biological and molecular data . Phycologia , 45 : 361 – 402 .
- Sinninghe-Damsté , JS , Muyzer , G , Abbas , B , Rampen , SW , Masse , G , Allard , WG , Belt , ST , Robert , J-M , Rowland , SJ Moldowan , JM . 2004 . The rise of the rhizosolenoid diatoms . Science , 304 : 584 – 587 .
- Smith , AD , Lui , TWH and Tillier , ERM . 2004 . Empirical models for substitution in ribosomal RNA . Mol. Biol. Evol. , 21 : 419 – 427 .
- Sörhannus , U . 2004 . Diatom phylogenetics inferred based on direct optimization of nuclear-encoded SSU rRNA sequences . Cladistics , 20 : 487 – 497 .
- Sörhannus , U . 2007 . A nuclear-encoded small-subunit ribosomal RNA timescale for diatom evolution . Mar. Micropaleont. , 65 : 1 – 12 .
- Sosef , MSM . 1997 . Hierarchical models, reticulate evolution and the inevitability of paraphyletic supraspecific taxa . Taxon , 46 : 75 – 85 .
- Suyama , M , Torrents , D and Peer Bork , P . 2006 . PAL2NAL: robust conversion of protein sequence alignments into the corresponding codon alignments . NAR. , 34 : 609 – 612 .
- Tanteno , Y , Takezaki , N and Nei , M . 1994 . Relative efficiencies of the maximum-likelihood, neighbor-joining and maximum-parsimony method when substitution rate varies with site . Mol. Biol. Evol. , 11 : 261 – 277 .
- Telford , MJ , Wise , MJ and Gowri-Shankar , V . 2005 . Consideration of RNA secondary structure significantly improves likelihood-based estimates of phylogeny: examples from the Bilateria . Mol. Biol. Evol. , 22 : 1129 – 1136 .
- Van de Peer , Y , van der Auwera , G and de Wachter , R . 1996 . The evolution of stramenopiles and alveolates as derived by substitution rate calibration of small ribosomal subunit RNA . J. Mol. Evol. , 42 : 201 – 210 .
- Verbruggen , H and Theriot , EC . 2008 . Building trees of algae: some advances in phylogenetic and evolutionary analysis . Eur. J. Phycol. , 43 : 229 – 252 .
- Von Stosch , HA . 1950 . Oogamy in a centric diatom . Nature , 165 : 531 – 532 .
- Williams , DM and Kociolek , JP . 2007 . The rejection of paraphyletic taxa . Eur. J. Phycol. , 42 : 313 – 319 .