
Abstract
This study aimed to reveal the dynamics of inducible anti-herbivory traits in the brown seaweed Fucus vesiculosus, in response to grazing by the isopod Idotea baltica. As the molecular basis of defence induction in seaweeds is poorly understood, a transcriptomic approach was used to gain insight into cellular processes underlying defence induction and thus promote the mechanistic understanding of anti-herbivory responses in seaweeds. In a 27 day feeding-assayed induction experiment, temporal patterns of the induced anti-herbivory resistance of F. vesiculosus were assessed under laboratory conditions. Feeding assays were performed at three day intervals, using fresh and reconstituted food. Microarray hybridizations investigating the expression of genes 3 days before, as well as at the same time as, feeding assays revealed a decreased palatability of previously grazed F. vesiculosus pieces compared with non-grazed control pieces. Despite permanent exposure to grazers, F. vesiculosus palatability varied over time. Non-grazed F. vesiculosus pieces were significantly preferred to grazed pieces after 18 and again after 27 days of previous grazing, while their relative palatability for isopods was comparable at all other times during the experiment. Relative to controls, 562/402 genes were ≥ 1.5-fold up-/down-regulated in seaweed pieces that were grazed for 18 days, i.e. when induction of defences was detected in feeding assays. Massive reprogramming of the regulatory expression orchestra (translation, transcription) as well as up-regulation of genes involved in lipid and carbohydrate metabolism, intracellular trafficking, defence and stress response was found. At the same time, down-regulation of photosynthesis was observed in grazed seaweed pieces. This study suggests a high level of temporal variability in induced anti-herbivory traits of F. vesiculosus and reveals increased expression of genes with putative defensive functions in conjunction with the reallocation of resources from primary to secondary metabolism.
Introduction
Seaweeds fulfil numerous important functions in benthic ecosystems. For instance, together with seagrasses, they account for 5% of global primary production (Smith, Citation1981), maintain nutrient and energy cycling (Mann, Citation1982), function as a CO2 sink (Ritschard, Citation1992) and provide food and shelter for grazers and various other organisms (Brawley, Citation1992). Marine herbivores in turn profoundly reduce producer abundance (Poore et al., Citation2012) and have been shown to affect species composition of seaweed communities in temperate habitats (Duffy & Hay, Citation2000). To persist in benthic communities, traits have evolved in seaweeds to avoid, tolerate or deter herbivory (reviewed in Hay & Fenical, Citation1988). Seaweed defences are either continuously expressed (constitutive defence) or induced, i.e. produced on demand (Tollrian & Harvell, Citation1999). In seaweeds, brown algae especially respond to grazing with the induction of chemical defences, i.e. with the production of toxic or palatability-/digestibility-reducing compounds that affect herbivore fitness and/or survivorship (Toth & Pavia, Citation2007).
Plant resistance to grazers is considered to be costly (e.g. Zangerl et al., Citation1997; Mauricio, Citation1998; Dworjanyn et al., Citation2006). Costs can arise e.g. when resistance traits (such as secondary metabolites) are toxic not only to herbivores, but also to the producer and therefore have to be stored and deployed in a way that prevents autotoxicity (Baldwin & Callahan, Citation1993). Resistance costs also include allocation costs, since resources have to be diverted away from concurrent needs, such as growth and reproduction (Strauss et al., Citation2002). However, costs may be reduced by auxiliary functions of secondary metabolites (Neilson et al., Citation2013) or by expressing resistance only when it is needed (inducible defence; Agrawal, Citation2005).
Previous induction experiments showed that differences in palatability between previously grazed and non-grazed seaweed pieces occurred within 9–14 days after onset of herbivory (Rohde et al., Citation2004; Rohde & Wahl, Citation2008; Yun et al., Citation2012) and were reduced within 2–4 days when grazing stopped (Rohde & Wahl, Citation2008). Thus, grazing pressure and seaweed responses may generally be promptly coupled. For example, a reduction of seaweed palatability and, thus, consumption by herbivores could lead to a cessation of anti-herbivory defences (see cost-benefit model by Karban et al., Citation1999). Consequently, cessation of defences should increase grazing pressure and, thus, lead to renewed induction of defences. However, data on temporal dynamics of inducible anti-herbivory defences in seaweeds are scarce. Flöthe & Molis (Citation2013) reported that the palatability of knotted wrack (Ascophyllum nodosum) varied in response to continuous grazing pressure by the isopod Idotea granulosa, but this pattern has not been demonstrated for other marine algae as yet.
Although the ability of seaweeds to induce defences in response to herbivory is well established (Toth & Pavia, Citation2007), molecular mechanisms underlying these complex responses have largely remained elusive. Several genomic studies have provided insight into internal regulative processes in seaweeds, but these investigations were mainly focused on genes involved in carbohydrate synthesis (e.g. Zhou & Ragan, Citation1995), resistance to toxic metals (Owen et al., Citation2012) or epiphytes (Weinberger et al., Citation2011a) and acclimation to abiotic stresses (Dittami et al., Citation2009; Pearson et al., Citation2010; Heinrich et al., Citation2012b) (but see Cosse et al., Citation2009; de Oliveira et al., Citation2012). In contrast, cellular processes underlying the induction of anti-herbivory defences have been studied in detail for vascular plants. Wound- and herbivore-specific elicitors activate various signalling pathways, leading to a fine-tuned metabolic reconfiguration and the coordinated expression of numerous defence-related genes (reviewed by Kessler & Baldwin, Citation2002). As a next step, seaweed-herbivore interactions should be investigated at the molecular level to assess how environmental processes modulate the expression of seaweed genes. Increasing knowledge of the genes and cellular processes underlying defence induction will contribute significantly to the understanding of algal ecology and evolution.
In this study, small-scale temporal changes in seaweed palatability and cellular processes that occur during the induction of seaweed anti-herbivory defences were revealed using the common perennial brown alga Fucus vesiculosus L. and its crustacean grazer Idotea baltica (Pallas). Fucus vesiculosus is of great ecological importance as one of the main habitat-forming components of the shallow coastal zone of North Atlantic shores and can potentially affect diversity and abundance of associated species (Wikström & Kautsky, Citation2007; Valdivia et al., Citation2012). Furthermore, the ability to induce anti-herbivory traits in response to grazing by mesoherbivores has been repeatedly shown for different F. vesiculosus populations (e.g. Hemmi et al., Citation2004; Rohde et al., Citation2004; Long et al., Citation2007; Yun et al., Citation2007; Yun et al., Citation2012).
With a combination of a feeding-assayed laboratory induction experiment and microarray hybridizations, the present study aimed (1) to reveal the dynamics of inducible anti-herbivory traits in the brown seaweed Fucus vesiculosus in response to grazing by the isopod Idotea baltica, (2) to assess underlying cellular processes for the first time, in order to improve the understanding of the anti-herbivory response and to facilitate more in-depth investigations at the molecular scale in seaweeds, and (3) to suggest potential candidate genes underlying defence induction, providing new tools with which to address further questions regarding seaweed-herbivore interactions.
Materials and methods
Collection site and organisms
The brown seaweed F. vesiculosus was collected during low tide in the mid rocky intertidal of the moderately wave-exposed Augusta Mole, Helgoland, NE Atlantic (54°10′70′′ N, 7°53′52′′ E) where it is one of the dominant seaweed species, together with Fucus serratus and the red macroalga Mastocarpus stellatus.
The isopod Idotea baltica is a littoral mesograzer species (Orav-Kotta & Kotta, Citation2004), but is also abundant among drift Fucus and Ascophyllum thalli (Franke et al., Citation2007). All isopods used for this study were taken from an I. baltica culture fed with A. nodosum and customary fish food and maintained in a constant temperature room at 15°C in an aerated 200 l flow-through tank with a 12/12 h light/dark cycle. Every year, new individuals from drift algae collected in the Helgoland Bight were introduced into the culture.
The present study was conducted in compliance with the legal requirements of the Schleswig-Holstein state act of 24 April 1981 (classification number 791-4-37) that declared the rocky shores below the high tide limit of Helgoland Island a nature reserve and allows ecologists to access sites to accomplish field research.
Experimental set-up and design
A bio-assayed induction experiment was run in a laboratory of the Biologische Anstalt Helgoland using transparent plastic aquaria (25 l volume; 480 × 230 × 260 mm) which were supplied with cotton-filtered water from the nearby North Sea.
The experiment started on 2 July 2010 and was run with 10 replicates. In total, 960 apical seaweed pieces were cut from 120 F. vesiculosus individuals at Augusta Mole. An algal individual was defined as the tissue stemming from a single holdfast. Eight apical pieces (mean ± SD wet mass of 2.07 ± 0.81 g) lacking visual feeding scars were cut from each of these individuals. All algal pieces were transported to the laboratory, in < 30 min, where macroscopic epibionts were gently removed with a soft sponge. Furthermore, F. vesiculosus pieces were marked with coloured threads in order to identify genetically identical pieces, i.e. pieces that were cut from the same individual. For a single replicate, four genetically identical pieces of each of 12 specimens were allocated to a control aquarium. The other four pieces of each specimen were placed in a treatment aquarium (). In this manner, 12 × 4 (= 48) Fucus pieces were allocated to each aquarium (i.e. 2 × 48 = 96 pieces per replicate). Quadruplets of genetically identical pieces were used at each of twelve feeding assay dates to avoid confounding feeding preferences with potential intra-individual differences in seaweed palatability. To prevent seaweed pieces floating they were separately fixed with cable ties (width 1.8 mm) to a green polyethylene mesh (mesh size 2 mm) that rested at the bottom of each aquarium. Mean (± SD) flow rate of seawater through each of the 20 individual aquaria was 184 (± 17) ml min−1 at a mean (± SD) water temperature of 19.7 (± 1.0) °C (HOBO Pendant Temperature/Light Data Logger, Onset Computer Corporation, Cape Cod, USA). Effluent pipes were covered with black polystyrene mosquito mesh (mesh size 1.5 mm) to avoid animal escapes from the set-up. Light was provided by fluorescent tubes (Osram Lumilux Daylight L 36 W/865, Osram, Munich, Germany), which were mounted above the aquaria in a light/dark cycle of 12/12 h. As fluorescent tubes promoted the warming of the seawater within the aquaria, a lower mean (± SD) photon flux of 121.1 (± 2.9) µmol m−2 s−1 (photosynthetically active irradiance PAR) was applied than the average (± SD) ambient PAR that we had measured at 2 m water depth in July (490 ± 14 µmol photons m−2 s−1) and August (410 ± 14 µmol photons m−2 s−1) using a LI-1400 data logger with a LI-192 underwater quantum sensor (LI-COR, Lincoln, Nebraska, USA).
Fig. 1. Schematic illustration showing the allocation of Fucus vesiculosus pieces (small rectangles) for a single replicate at one of 12 points in time. Induction aquaria contained 48 pieces (only 4 shown) at the beginning of the experiment from which 4 were allocated to feeding arenas (circles) or gene expression analysis at each of the 12 points in time. Stippled and solid lines indicate containers with and without grazers, respectively. Letters and numbers indicate ungrazed and grazer-exposed pieces of F. vesiculosus, respectively. Reconstituted food items (pentagons) used for feeding assays (subscript a) and corresponding autogenic controls (subscript b) were derived from the same previously grazed or ungrazed seaweed piece.
The experiment was divided into three sequential phases: acclimation, induction and reduction. Firstly, all algal pieces were kept for acclimation without grazers for 4 days to recover from cutting and putative induction of anti-herbivory defences caused by previous grazing in the field. According to Rohde & Wahl (Citation2008), 2–4 days are sufficiently long to reduce defensive traits in F. vesiculosus. Afterwards, wet masses of the F. vesiculosus pieces were determined by carefully blotting them dry with paper towels for 20 s and weighing them to the nearest 0.001 g (Sartorius CPA323S, Sartorius, Göttingen, Germany). This was the standard procedure to measure wet mass of all fresh and reconstituted seaweed pieces in this study.
Secondly, a 27 day induction phase started on day 5 of the experiment by adding three male and three female I. baltica (= inducers) to each of the 10 treatment aquaria; inducers were absent from the remaining 10 control aquaria. The treatment and control aquaria of each replicate were paired and the pairs randomly arranged in the set-up. Every 3 days during the induction phase, four randomly chosen, genetically identical F. vesiculosus pieces were removed from each control and treatment aquarium of all replicates (). One of the four pieces was transferred to a feeding arena with a naïve grazer (= consumer, see subsection ‘feeding assays’ for details). The second piece was allocated to a feeding arena without a consumer to determine autogenic wet mass changes during feeding assays. The third piece was stored at −80°C and used within 4 weeks in feeding assays using artificial food pellets (see subsection ‘reconstituted food’ for details). The fourth piece was immediately shock frozen in liquid nitrogen and stored at −80°C for subsequent gene expression analysis (frozen samples were processed within 5 months). The treatment and corresponding control seaweed pieces originated from the same F. vesiculosus individual in the field to make sure that expression differences between both pieces were not due to inter-individual variation. Furthermore, every 6 days one isopod was withdrawn from each treatment aquarium to maintain a constant grazing pressure throughout the induction phase.
To monitor herbivore consumption during the induction phase, the wet mass of eight F. vesiculosus pieces from each aquarium was measured at the beginning and the end of 3 day intervals. These eight pieces were chosen randomly for each 3 day period. Means were calculated from the eight pieces from each aquarium as a replicate measure of consumption for statistical analysis (formula used for calculation of consumption is given in subsection ‘feeding assays’).
Thirdly, inducers were removed from the aquaria at the end of the induction phase to start the reduction phase. Three and 6 days later, pieces of F. vesiculosus were removed from all aquaria and allocated as described for the induction phase ().
Feeding assays
Fresh algae
Consumption by I. baltica was measured every 3 days in 72 h two-choice feeding assays throughout the induction and the reduction phases. Transparent plastic aquaria (8 l volume; 325 × 175 × 185 mm) were used as feeding arenas, in which one male I. baltica (0.358 ± 0.109 g wet mass, mean ± SD) could choose between a previously grazed and a genetically identical non-grazed piece of F. vesiculosus. To avoid grazer adaptations, naïve consumers that were taken from the culture maintained on A. nodosum, i.e. isopods that had not been in contact with F. vesiculosus previously, were used in feeding assays. Fucus vesiculosus pieces in feeding arenas (= assayed alga) were weighed at the beginning and the end of the feeding assays. In addition, a second F. vesiculosus piece was removed from the same aquarium from where the assayed pieces originated. This piece was used to correct the consumption rates of the assayed seaweed piece for non-feeding related (autogenic) wet mass changes. Furthermore, the risk of underestimating the error variance of autogenic controls was reduced by using the same number of autogenic controls and assayed algae (Roa, Citation1992). The consumption of each assayed algal piece was then calculated using the following formula (adapted from Cronin & Hay, Citation1996):
Reconstituted food
Additional feeding assays with reconstituted food were used to test whether grazing by isopods induced chemical, rather than morphological, grazer-deterrent seaweed traits. Reconstituted food was prepared from F. vesiculosus pieces that were stored at −80°C. Pieces were freeze-dried for 24 h at −30°C and 0.37 mbar (Christ Beta 1-8 LD plus, Martin Christ Gefriertrocknungsanlagen, Osterode am Harz, Germany) before they were ground separately to a homogeneous powder with mortar and pestle. Subsequently, 0.4 g of the algal powder was mixed with 3.6 ml of molten agar (a blend of 0.02 g agar per ml of boiling distilled water). To minimize thermal destruction of bioactive chemical compounds in the algal powder, the agar was allowed to cool to 45°C before mixing. Afterwards, this mixture was poured on a mosquito net (mesh size 1.5 mm) and flattened between two PVC panels coated with wax paper (method adapted from Hay et al., Citation1994). A 1 mm plastic template placed between the PVC panels created reconstituted food pellets of consistent thickness. Two food items of 2 × 2 cm area were cut from each pellet after solidification. One food item was used in a two-choice feeding assay, while the other item was used as an autogenic control. Each of the two food items was placed in a glass Petri dish (Ø 10 cm, 2 cm height) and transferred to different transparent plastic aquaria (= feeding arenas). Each feeding arena contained two Petri dishes, one with a food item made from a previously grazed and one with a food item made from a previously ungrazed piece of F. vesiculosus. Placing food items in Petri dishes within feeding arenas permitted a correct allocation of pieces, which were occasionally broken off by grazer activities, to original food items. At the beginning of a feeding assay, both food items were weighed before one male I. baltica was introduced to the feeding arena; no consumers were added to feeding arenas assessing autogenic wet mass changes. After 3 days or when ≥ 50% of one food item was consumed, whichever came first, feeding assays were terminated and food items reweighed. Consumption of food items was computed using the above formula.
Gene expression analysis
RNA extraction
Microarray hybridizations were not performed for all points in time due to financial constraints. As results from feeding assays suggested a strong decline in F. vesiculosus palatability from day 15 to day 18, only F. vesiculosus pieces that were collected directly after the acclimation phase (T0) and seaweed pieces that were exposed for 15 and 18 days to I. baltica grazing and their corresponding controls (T15/T18 and C15/C18, respectively) were chosen to analyse gene expression patterns. Differentially expressed genes induced by isopod grazing were identified by comparing previously grazed F. vesiculosus pieces with the corresponding control pieces at the given points in time (day 15 and day 18).
Frozen F. vesiculosus pieces were ground in liquid nitrogen with mortar and pestle and transferred to 2.0 ml Eppendorf tubes (Eppendorf, Hamburg, Germany). Total RNA was isolated with a modified CTAB (cetyl trimethylammonium bromide) method. One ml extraction buffer (2% CTAB, 1 M NaCl, 100 mM Tris pH 8, 50 mM EDTA pH 8; adapted from Heinrich et al., Citation2012b) and 25 µl dithiothreitol 2 M were added to the ground tissue and mixed well on a vortex mixer. The mixture was incubated at 45°C for 15 min. Afterwards two consecutive chloroform extractions were performed as described by Pearson et al. (Citation2006). Subsequently, total RNA was extracted using the Qiagen Plant Mini Kit (Qiagen, Hildesheim, Germany) according to the manufacturer’s protocol for RNA extraction, including on-column DNA digestion to ensure as little contamination with DNA as possible due to sensitivity of downstream applications. Concentration and purity of the extracted RNA were determined with the NanoDrop ND-1000 spectrometer (PeqLab Biotechnologie, Erlangen, Germany) and total RNA integrity was verified with the 2100 Bioanalyzer (Agilent Technologies, Palo Alto, California, USA) using a RNA 6000 Nano Chip.
Microarray hybridizations
80 ng of total RNA were amplified, reverse transcribed and labelled using the ‘Two-color Low Input Quick Amp Labeling Kit’ (Agilent) according to the manufacturer’s protocol. RNA from control and previously grazed F. vesiculosus pieces from days 15 and 18 was labelled with cyanine-3 (Cy3), while cyanine-5 (Cy5) was used to label RNA from seaweed pieces that were collected at day 0. As a minor modification, random hexamers with attached T7 promoter were added due to the presence of long 3′UTR sequences in brown seaweeds (Apt et al., Citation1995). Afterwards, cRNA concentration and dye incorporation rates (Cy3 and Cy5) were measured with the NanoDrop ND-1000 spectrometer (PeqLab). Prior to labelling, RNA Spike-In Mix was added to RNA samples to serve as an internal standard and benchmark for hybridization performance (Agilent). Hybridization was performed onto 4 × 44 k microarray slides which were designed with the Agilent eArray online platform. Slides contained oligonucleotide 60mers designed from a F. vesiculosus cDNA library containing transcripts of grazed F. vesiculosus (data available on request). 24 927 transcripts were represented by either one or two individual probes.
Total RNA of previously ungrazed and previously grazed F. vesiculosus pieces from days 15 and 18 was hybridized against pooled RNA from four F. vesiculosus individuals that were collected before grazers were added to induction aquaria (day 0). Hybridizations were carried out in biological triplicates, i.e. three hybridizations were performed per point in time (day 15 or 18) and treatment (control or grazed) with RNA extracted from three different F. vesiculosus pieces. The four replicates of F. vesiculosus collected at day 0 as well as the three replicates from the days 15 and 18 were randomly selected from the 10 replicates of the induction experiment. Microarray slides were placed in Agilent SureHyb hybridization chambers and incubated in an Agilent Microarray Hybridisation Oven at 65°C for 17 hours. Afterwards, microarrays were washed according to the manufacturer’s instructions (Agilent) and scanned with a High-Resolution Microarray Scanner at 5 μm resolution (Agilent G2565AA Microarray scanner system).
Statistical analyses
Consumption of inducers during induction phase
Consumption by isopods during the induction phase was analysed by resampling without replacement, using a Monte Carlo analysis with 10 000 permutations (Bärlocher, Citation1999).
Feeding assays
A repeated-measures analysis of variance (RM-ANOVA) tested for the effect of isopod grazing (within-subjects measure: 2 levels, fixed) on the palatability of F. vesiculosus pieces at different points in time during the induction phase (between-subjects measure: 9 levels, fixed) and reduction phase (between-subjects measure: 2 levels, fixed). RM-ANOVA was used as treatments were not independent and standard ANOVA cannot be properly applied when two food types are simultaneously offered to the same individual consumer (Peterson & Renaud, Citation1989). As the within-subject factor had only two levels, testing for sphericity is not applicable (Quinn & Keough, Citation2002). Due to ambiguous selection of an appropriate error term for post-hoc tests involving within-subject by between-subject interactions, no post-hoc tests were computed for time × grazing interactions (Winer et al., Citation1991). Instead, one-tailed paired t-tests (due to experimental confirmation by Yun et al. (Citation2010) that I. baltica induces anti-herbivory defences in F. vesiculosus) were performed for each time separately, to reveal indirectly which combination of treatment and time caused significant interactions. Normal distribution of differences in the consumption of previously grazed and non-grazed pieces was confirmed using the Kolmogorov–Smirnov test. No Bonferroni correction was calculated, as the probability of finding the number of significant t-tests by chance was always ≤ 5% (Moran, Citation2003).
Microarray hybridizations
Microarray raw data was extracted from scanned images using the Agilent Feature Extraction Software (version 10.7.31). Array quality was monitored using the Agilent QC tool with the metric set GE2_QCMT_Sep09. LOWESS normalized expression values were analysed with the Agilent GeneSpring GX software (Version 11) to identify genes differentially regulated relative to day 0. Average intensity values across replicates were used for statistical analysis by two-way ANOVA with treatment (2 levels, fixed) and time (3 levels, fixed) as main factors. An ANOVA P value of 0.01 was chosen to indicate statistical significance. Subsequently, fold change analysis with a cut-off of 1.5 was performed on genes that were found to be differentially expressed from the statistical analysis. The option ‘pairs of conditions’ was used to perform pairwise comparisons of microarray data from two conditions (e.g. control vs. treatment at each time point). A 1.5-fold cut-off was chosen to avoid underestimation of the extent of up- or down-regulation, since a minute change in the transcriptional abundance (e.g. of a transcription factor) could also lead to a considerable biological effect (Reymond et al., Citation2004). Afterwards, expression values of controls (i.e. control day 15 vs. day 0 and control day 18 vs. day 0) were subtracted from corresponding treatment values (i.e. treatment day 15 vs. day 0 and treatment day 18 vs. day 0) at each time point to obtain only grazing-related changes in gene expression.
Transcripts were annotated through BLAST against NCBI sequence database, Swiss-Prot protein knowledgebase, Clusters of eukaryotic orthologous groups (KOG) and Pfam protein families database with an e-value cut-off of 10−7. Microarray design, raw data and normalized data have been deposited in NCBI’s Gene Expression Omnibus and are accessible through GEO Series accession number GSE47975 (http://www.ncbi.nlm.nih.gov/geo/query/acc.cgi?acc=GSE47975).
Results
Fucus vesiculosus palatability
Consumption by isopods did not vary significantly at different times during the induction phase (resampling: P = 0.607; ). However, 95% CIs overlapping with the zero-line of no consumption between days 19 to 21 and 25 to 27 () indicate that absolute consumption was not significantly different from zero on these days, while significant amounts of F. vesiculosus biomass were consumed in the remaining time of the induction phase.
Fig. 2. Fucus vesiculosus consumption by Idotea baltica during 3 day intervals in the induction phase (n = 10). Data are shown as means and 95% confidence intervals (CI). Intervals at which CIs overlap with stippled line indicate times when consumption was not significantly different from the null hypothesis of no consumption. Intervals with non-overlapping CIs show significant differences in seaweed consumption. Arrows mark times when feeding assays suggest induction of anti-herbivory defences.
Feeding assays
At the end of the acclimation phase, the palatability of F. vesiculosus pieces in control and treatment aquaria was not significantly different when tested in assays using fresh algae (one-tailed paired t-test: t9 = 1.78, P = 0.055) or reconstituted food (one-tailed paired t-test: t8 = −1.34, P = 0.108). One replicate was lost in feeding assays using reconstituted food due to the disintegration of one of the two food pellets.
Overall, consumers significantly preferred fresh control pieces over previously grazed pieces (RM-ANOVA: F1,81 = 12.42, P < 0.001) during the subsequent induction phase. In addition, a significant interaction between isopod grazing and time was found in assays using fresh F. vesiculosus pieces (RM-ANOVA: F8,81 = 2.97, P = 0.006) (supplementary Table S1). Fresh non-grazed F. vesiculosus pieces were significantly more consumed than previously grazed pieces 18 and 27 days after the start of the induction phase (, ).
Table 1. Results of one-tailed paired t-tests comparing controls and previously grazed seaweed pieces. Consumption of consumers (Idotea baltica) was assessed in feeding assays using either fresh or reconstituted food pieces of Fucus vesiculosus (n = 10). Time = days after start of the induction phase. Day 0 to 27 = induction phase. Day 30 to 33 = reduction phase. Significant P values, i.e. α ≤ 0.05, in bold.
Fig. 3. Fucus vesiculosus consumption by Idotea baltica in two-choice feeding assays using fresh seaweed pieces. Mean ± SE (n = 10) isopod consumption of Fucus vesiculosus pieces that were previously grazed (dark grey bars) or were not exposed to grazing before (controls; light grey bars). Asterisks indicate significant results of one-tailed paired t-tests comparing distribution of differences between control and grazed pieces against the null-hypothesis of no difference.
Consumers did not prefer reconstituted food made from previously ungrazed pieces of F. vesiculosus over reconstituted food made from previously grazed pieces (RM-ANOVA: F1,81 = 2.05, P = 0.156) during the induction phase (supplementary Table S1). However, one-tailed paired t-tests, that analysed feeding preferences at each time, were performed to test whether the temporal pattern of feeding preferences that was observed in assays with fresh F. vesiculosus pieces could be confirmed with feeding assays using reconstituted food. The t-tests revealed that I. baltica significantly preferred reconstituted food made from previously ungrazed F. vesiculosus to reconstituted food made from F. vesiculosus pieces that were grazed in induction phase for 18 and 27 days (, ).
Fig. 4. Fucus vesiculosus consumption by Idotea baltica in two-choice feeding assays using reconstituted food. Mean ± SE (n = 10) isopod consumption of food pellets made from Fucus vesiculosus pieces that were previously grazed (dark grey bars) or were not exposed to grazing before (controls; light grey bars). Interpretation of symbols as in .
In the reduction phase, isopod consumption was not significantly different between F. vesiculosus pieces that were or were not grazed in the previous induction phase in feeding assays using both fresh (RM-ANOVA: F1,18 = 2.48, P = 0.132) and reconstituted food (RM-ANOVA: F1,18 = 0.66, P = 0.428; supplementary Table S1).
Microarray hybridizations
Analyses of microarrays covering 24 927 F. vesiculosus genes demonstrated differential gene expression in response to grazing by I. baltica compared with controls. Of these, altogether 1148 genes were differentially expressed among F. vesiculosus pieces that were previously grazed compared with non-grazed seaweed pieces that were collected directly after acclimation at day 0 (). Between days 15 and 18 the number of up-/down-regulated genes increased from 318/287 to 562/402. Altogether, 247/258 up-/down-regulated genes were similarly expressed at days 15 and 18. After 15 days of isopod grazing, 71/29 genes were uniquely up-/down-regulated, whereas 315/144 genes were uniquely up-/down-regulated after 18 days. Altogether about 23% of all regulated genes could be functionally annotated (supplementary Table S2) and assigned to KOG categories ().
Fig. 5. Number of responsive Fucus vesiculosus genes 15 and 18 days after onset of grazing. Differentially expressed genes were identified by microarray hybridizations and evaluated by two-way ANOVA combining biological replicates. Genes were considered to be differentially expressed when P values were < 0.01 and calculated fold changes were ≥ 1.5. Expression values of controls (i.e. control day 15 vs. day 0 and control day 18 vs. day 0) were subtracted from corresponding treatment values (i.e. treatment day 15 vs. day 0 and treatment day 18 vs. day 0) at each time point to obtain only grazing-related changes in gene expression. Genes that were differentially expressed between days 15 and 18 are also shown (T18 vs. T15). T18 vs. T15 fold changes were calculated by dividing the values of T18 vs. T0 by the values of T15 vs. T0. T0 = start of induction phase; T15 and T18 = grazed F. vesiculosus 15 and 18 days after start of induction phase, respectively. Overlaps display the numbers of genes regulated at multiple points in time. ↑ = up-regulated, ↓ = down-regulated.
Fig. 6. KOG category distributions of differentially expressed genes as identified by microarray hybridizations. Colour intensity corresponds to the number of genes per group, calculated as percentage of all regulated genes. The category ‘Metabolism’ includes amino acid, carbohydrate, lipid and nucleotide transport and metabolism. Identification of differentially expressed genes as described for . T0 = start of induction phase; T15 and T18 = grazed F. vesiculosus 15 and 18 days after start of induction phase, respectively.
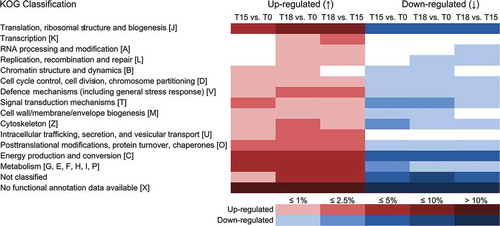
Genes regulated 15 and 18 days after onset of grazing
Fifteen and 18 days after onset of grazing, most up-regulated genes were assigned to one of the following KOG categories: ‘Energy production and conversion’, ‘Translation, ribosomal structure and biogenesis’, and ‘Metabolism’ (). Genes assigned to the category ‘Energy production and conversion’ coded for features of the respiratory chain (e.g. ubiquinone, cytochrome c, glycerol-3-phosphate dehydrogenase) as well as some photosynthesis-related features (e.g. fucoxanthin) and showed an approximate 2-fold increase in expression. At both points in time, genes related to translation mainly coded for ribosomal proteins. The category ‘Metabolism’ was mainly represented by genes related to lipid and carbohydrate metabolism. Up-regulated genes involved in lipid transport and metabolism included genes coding for enzymes involved in both fatty acid biosynthesis (e.g. fatty acid elongase 3-ketoacyl-CoA synthase 1) and degradation (e.g. hydroxyacyl-CoA dehydrogenase, phytanoyl-CoA dioxygenase). Genes coding for enzymes involved in fatty acid biosynthesis were found to increase only moderately in expression (fold change between 1.5 and 1.8), while genes coding for enzymes relevant for fatty acid degradation showed almost 4-fold increase in expression. Concerning carbon metabolism, up-regulation of a gene involved in both the Calvin cycle and gluconeogenesis (fructose-1,6-bisphosphatase) was found (supplementary Table S2). In addition, the abundance of genes coding for proteins related to the ‘Intracellular trafficking, secretion, and vesicular transport’ group was found to be increased (e.g. Ypt/Rab-specific GTPase-activating protein GYP1, the coatomer protein complex subunit delta, as well as a v-SNARE (SNARE = soluble N-ethylmaleimide-sensitive factor adaptor protein receptor; Levine, Citation2002) and a protein containing a vesicle membrane anchored SNARE region). The change in expression ranged from 1.6- to 6.3-fold (supplementary Table S2).
Genes relevant for the defence response were of particular interest in this study. Since herbivore attack can be considered as a stress situation (Wahl et al., Citation2011), where the seaweed may be expected to up-regulate stress response genes rather than switching them off, genes involved in both defence and stress response were taken together in the category ‘defence mechanisms and stress response’. In this category the following genes were found to be up-regulated both 15 and 18 days after the start of induction: a lipoxygenase (LOX), the defence-related protein SCP, as well as the cytochrome P450 (). These genes showed a 2.2- to 12.2-fold change in expression.
Table 2. Regulation of genes involved in defence mechanisms and stress response in Fucus vesiculosus after 15 and 18 days of grazing. Identification of regulated genes was based on microarray hybridizations and evaluated with a two-way ANOVA combining biological replicates. Genes were considered to be differentially expressed when P values were < 0.01 and calculated fold changes (FCs) were ≥ 1.5. Expression values of controls (i.e. control day 15 vs. day 0 and control day 18 vs. day 0) were subtracted from corresponding treatment values (i.e. treatment day 15 vs. day 0 and treatment day 18 vs. day 0) at each time point to obtain grazing-related changes in gene expression. Genes that were differentially expressed between days 15 and 18 are also shown (T18 vs. T15). T18 vs. T15 fold changes were calculated by dividing the values of T18 vs. T0 by the values of T15 vs. T0. T0 = start of induction phase; T15 and T18 = grazed F. vesiculosus 15 and 18 days after start of induction phase, respectively. Positive FCs indicate an increase in the expression level in previously grazed F. vesiculosus pieces relative to controls, while negative FCs indicate a decrease in the expression level.
Table 3. Regulation of genes involved in photosynthesis in Fucus vesiculosus after 15 and 18 days of isopod grazing. Identification of differentially expressed genes as well as calculation and interpretation of fold changes (FCs) as described for . T0 = start of induction phase; T15 and T18 = grazed F. vesiculosus 15 and 18 days after start of induction phase, respectively.
Genes that were down-regulated both 15 and 18 days after onset of grazing were mainly assigned to the KOG categories ‘Translation, ribosomal structure and biogenesis’ and ‘Energy production and conversion’. Genes relevant for ‘Translation, ribosomal structure and biogenesis’ mainly coded for ribosomal proteins, which were different from the up-regulated features assigned to this category. Among genes assigned to ‘Energy production and conversion’, those coding for an ATP synthase and various photosynthesis-related genes such as photosystem II complex subunit Ycf12, photosystem II CP47 chlorophyll apoprotein, photosystem II 4 kDa reaction centre component and D2 reaction centre protein of photosystem II were observed. These genes showed strong down-regulation, ranging from 6-fold to 32-fold ().
Genes regulated only 18 days after onset of grazing
Eighteen days after onset of grazing, several other genes involved in carbon metabolism were up-regulated. These included genes coding for an enzyme involved in glycolysis (glyceraldehyde-3-phosphate dehydrogenase) and for an enzyme related to the pentose phosphate pathway (PPP; 6-phosphogluconate dehydrogenase). These genes showed an approximate 2-fold increase in expression level (supplementary Table S2).
In the category ‘defence mechanisms and stress response’ the following features were found to be up-regulated only 18 days after onset of grazing: papain family cysteine protease, peroxidase 34 (PRX34), alkyl hydroperoxide reductase, the FeS assembly protein SufD, methionine sulfoxide reductase, glutathione S-transferase (GST), γ-glutamyl transpeptidase and a multidrug/pheromone exporter (ABC superfamily). The respective genes showed a 1.5- to 6.2-fold increase in expression ().
Genes with unknown function
In addition to the abovementioned genes, several other genes without assigned functional annotations showed the strongest up- or down-regulation induced by isopod consumption. Compared with controls these genes showed up to 222-fold change in expression ().
Table 4. List of 15 Fucus vesiculosus genes that showed strong up-regulation 15 and/or 18 days after onset of grazing. Identification of differentially expressed genes as well as calculation and interpretation of fold changes (FCs) as described for . T0 = start of induction phase; T15 and T18 = grazed F. vesiculosus 15 and 18 days after start of induction phase, respectively. Genes with strong responses 18 days, but not 15 days, after onset of grazing printed in bold.
Discussion
Dynamics in anti-herbivory defences
Palatability of previously grazed F. vesiculosus was significantly reduced 18 and 27 days after the start of induction. A decrease in palatability of previously grazed F. vesiculosus in feeding assays may have been caused by a significant removal of nutritious tissue during the induction phase. However, this seems implausible for at least two reasons. Firstly, I. baltica consumed relatively small amounts, on average 10%, of F. vesiculosus biomass until day 18 of the induction phase and 2% more during the next 9 days. Secondly, I. baltica consumed, in most feeding assays, equal amounts of F. vesiculosus pieces that were or were not grazed for longer than 18 days in the induction phase. Thus, sufficient amounts of preferred tissue were still available in previously grazed F. vesiculosus beyond day 18. It is therefore most likely that I. baltica preferred non-grazed over grazed F. vesiculosus because of an induction of anti-herbivory defences in grazed seaweed pieces. This explanation is supported by the interval-wise analysis of results of feeding assays using reconstituted food. Reconstituted food made from previously grazed F. vesiculosus was consumed less than food made from non-grazed pieces at exactly the same times when the same feeding preferences were detected in assays using fresh F. vesiculosus pieces (18 and 27 days after onset of grazing). As potential morphological differences between previously grazed and non-grazed F. vesiculosus pieces were eliminated in artificial food pellets, isopod feeding preferences in reconstituted food assays can be attributed to chemical differences in food quality (see also Rohde et al., Citation2004; Long et al., Citation2007).
Defences were first detectable 18 days after onset of grazing. This timing differs from an isopod grazing period of 9–14 days that was required to induce defences in F. vesiculosus in previous studies (Rohde et al., Citation2004; Rohde & Wahl, Citation2008; Yun et al., Citation2012). Rohde & Wahl (Citation2008) suggested the induction of defences was triggered by biomass loss rather than by the duration of grazing and proposed that a loss of 5–10% wet mass represents the threshold at which benefits of protection against grazing may outweigh defence costs in F. vesiculosus. In this study, 10.2% wet mass was lost after 18 days of grazing, which may have caused the delayed induction of defences.
Furthermore, defences were detected at two different time points during the induction phase, suggesting alternations in the palatability of continuously grazed seaweed pieces. The observed changes in F. vesiculosus palatability seemed to be inversely correlated with consumption during the induction phase (e.g. no consumption between days 19–21 and 25–27, ). Fucus vesiculosus seemed to turn defences on when grazing was intense (day 18) and turn them off again when grazing pressure was reduced (day 21). Increasing seaweed palatability and, thus, increasing consumption after day 21 possibly induced defences again at day 27. This study indicates that grazing pressure and induced seaweed responses are closely coupled and supports findings by Flöthe & Molis (Citation2013), who reported comparable dynamics in the palatability of the closely related knotted wrack (Ascophyllum nodosum) that was continuously exposed to periwinkles (Littorina obtusata). However, more seaweed species must be tested to assess the generality of temporally variable induced defences and longer induction experiments should be run to test whether such fluctuations occur repeatedly as a permanently pulsating defence. Dynamic defence traits may be favourable to seaweeds for different reasons. Temporal variation in palatability may increase feeding dispersal and reduce average meal size, reducing the risk of losing larger thallus fragments as a consequence of localized grazing (Hemmi et al., Citation2004). Furthermore, short-term changes in the defence status may allow F. vesiculosus to counter temporary isopod attacks, whose grazing pressure varies locally within hours to days (Rohde & Wahl, Citation2008), with reduced putative costs of defence (reviewed in Karban et al., Citation1999). Moreover, dynamic anti-herbivory traits may complicate physiological grazer adaptations and may hamper coevolution in seaweed-grazer interactions (Whitham, Citation1983).
Gene expression patterns
Microarray hybridizations revealed differential expression of 1148 genes in isopod-grazed F. vesiculosus compared with non-grazed controls. Because stress has sweeping ramifications on seaweed physiology (Wahl et al., Citation2011), it seems plausible that a large number of genes were differentially regulated. The number of differentially expressed genes increased with time from day 15 to day 18, which seems reasonable since effective defences were first detected 18 days after the start of the induction phase. Unfortunately, the timing of our microarray analysis does not provide information about gene regulation in the first few hours following herbivore attack. However, 15 days after onset of grazing approximately 600 genes were already differentially expressed specific to grazing. Thus, the time span of 15 days (in which a mean biomass loss of 10% was not yet reached) may be considered as an ‘early’ defence phase during which defences were not expressed, but the defence machinery has been primed. Nevertheless, the large number of identical genes found 15 and 18 days after the onset of grazing indicates that most of these ‘early’ induced processes were still activated and/or suppressed at the time when defences were present in feeding assays. The genes involved and the corresponding processes, such as up-regulation of catabolic processes and down-regulation of photosynthesis (), may be seen as a general stress- or grazing response.
Fig. 7. Model showing grazing-induced changes in photosynthesis, carbohydrate and lipid metabolism, and defences in Fucus vesiculosus. Grazing by Idotea baltica results in down-regulation of photosynthesis that would lead to a reduced availability of energy, reducing power and precursors (dashed arrows). At the same time, grazing results in the activation of glycolysis, pentose phosphate pathway (PPP) and β-oxidation, leading to the accumulation of energy, reducing equivalents and precursors that may then be used to induce defence mechanisms, such as reactive oxygen species (ROS), secondary metabolites and cysteine proteases (solid arrows).
Around 450 genes () were regulated only 18 days after the onset of grazing, i.e. at a point in time when defences were detected in feeding assays, which suggests a more specific defence response at this stage. Furthermore, several genes showed a significant difference in gene expression only between days 15 and 18. These genes and the corresponding processes are most probably involved in the defence response of F. vesiculosus to Idotea grazing. For example, several functional groups of genes related to the basal metabolism of F. vesiculosus showed a considerable change in expression between day 15 and day 18 (KOG categories ‘Metabolism’, ‘Energy production and conversion’, ‘Translation, ribosomal structure and biogenesis’ and ‘Transcription’). It is known that the induction of plant anti-herbivory defences requires functional reorganization that also involves primary metabolic processes, since increased requirements for energy, reducing equivalents and precursors have to be covered by these processes (Hermsmeier et al., Citation2001). Fatty acid metabolism was up-regulated, including several genes involved in fatty acid degradation () which showed a four-fold increase in expression. Beta-oxidation generates acetyl-CoA that will enter the tricarboxylic acid cycle (TCA cycle), which generates energy, precursors and reducing equivalents for numerous biochemical reactions (Bolton, Citation2009). Likewise, several genes relevant for carbon metabolism, e.g. glycolysis, showed a two-fold increase in expression 18 days after onset of grazing. Glycolysis gains ATP by converting glucose to pyruvate, which will subsequently enter the TCA cycle as acetyl-CoA (Bolton, Citation2009). Another major source of reducing power and precursors that may be used in the biosynthesis of various metabolites is the pentose phosphate pathway (Bolton, Citation2009), which was also up-regulated in grazed F. vesiculosus (). In line with these findings, two-fold up-regulation of genes involved in energy generation via the respiratory chain was observed at 15 days and was even more pronounced 18 days after the start of grazing. Breakdown of fats and carbohydrates may be assumed to be a cost associated with the induced grazing-response.
In contrast, photosynthesis was up to 32-fold down-regulated after 15 and 18 days of I. baltica grazing (). The expression of genes coding for enzymes involved in photosynthetic processes and the induction of plant defence mechanisms have been shown to be inversely correlated in the past (Bilgin et al., Citation2010 and references therein). The suppression of photosynthesis and the reallocation of resources from primary to secondary metabolism may be necessary for an effective defence response. Furthermore, a controlled shut-down of photosynthesis may minimize the oxidative damage that arises when photoautotrophic organisms are exposed to abiotic and/or biotic stresses (Arora et al., Citation2002). Moreover, the primary CO2 storage compound of photosynthesis in F. vesiculosus is mannitol, which was shown to be a feeding cue for the isopod I. baltica (Bidwell et al., Citation1972; Weinberger et al., Citation2011b). Strong down-regulation of photosynthesis may have resulted in reduced mannitol content and, thus, a reduced attractiveness of F. vesiculosus for isopods ().
Both 15 and 18 days after onset of grazing, genes involved in intracellular trafficking, secretion and vesicular transport were up-regulated (1.6- to 6.3-fold). The intracellular trafficking system is responsible for the transport of most macromolecules within the cell and may be essential for the transport of secondary metabolites between cell compartments and the delivery of newly synthesized secondary metabolites to their final destinations and/or secretion out of the cell (Grotewold, Citation2004; Yazaki, Citation2006). In addition, the intracellular vesicle trafficking network of plants seems to be linked to many signal transduction pathways and may be involved in the general response to environmental stresses (e.g. Levine, Citation2002).
Genes allocated to the ‘defence mechanisms and stress response’ group were found to be up to 12-fold up-regulated primarily 18 days after onset of herbivory (). These included a lipoxygenase, involved in the biosynthesis of jasmonic acid (JA), which is part of the signal transduction pathway and leads to the induction of direct and indirect plant defence responses (e.g. Bell et al., Citation1995). JA and its derivate methyl jasmonate may also modulate defence behaviour in F. vesiculosus (Arnold et al., Citation2001); however, their role in seaweed defence is under debate (Wiesemeier et al., Citation2008). In addition, genes homologous in sequence to papain were up-regulated in grazed F. vesiculosus. Konno et al. (Citation2004) showed that papain-containing artificial diets are toxic for silkworm larvae, indicating a key role in plant defence. Likewise, papain-like cysteine proteases may play a crucial role in seaweed–herbivore interactions by reducing grazer fitness and/or survivorship. The cell wall peroxidase 34 (PRX34), which was also found to be up-regulated in this study, is involved in accumulation of reactive oxygen species (ROS) in Arabidopsis thaliana (O’Brien et al., Citation2012), and plays a role in plant defence against herbivores (Leitner et al., Citation2005). Production of ROS has also been reported in response to pathogen elicitors in marine macroalgae (Bouarab et al., Citation1999; Weinberger & Friedlander, Citation2000; Küpper et al., Citation2001) and may play a role in resistance of F. vesiculosus against pathogens which could enter at wounding sites caused by herbivore attack. However, since ROS production can also harm host plant cells, the activation of protective mechanisms is necessary (Apel & Hirt, Citation2004). In this context, up-regulation of several genes encoding for enzymes with antioxidant protective functions (e.g. alkyl hydroperoxide reductase) that have already been found in the brown seaweed Ectocarpus siliculosus (Cock et al., Citation2010), was observed in previously grazed F. vesiculosus.
Unfortunately, the genes which showed the highest up- or down-regulation after 15 and especially 18 days of grazing (up to 222-fold change in expression) were those with unknown function (). Although it is not possible to draw any concrete conclusions about their role in herbivore resistance, these genes may be ecologically annotated as ‘defence-related genes’ (Pavey et al., Citation2012) due to their strong response to isopod grazing. In general, annotation success is < 50% for brown algal genomic studies (e.g. Roeder et al., Citation2005; Wong et al., Citation2007; Pearson et al., Citation2010; Heinrich et al., Citation2012a) due to long 3′UTR sequences (Apt et al., Citation1995) and the evolutionary distance between heterokonts and available sequence data from other taxa used for comparisons (Pearson et al., Citation2010). The limited annotation success makes it difficult to identify candidate genes for defence induction, in particular since F. vesiculosus is a non-model organism without whole-genome sequencing. However, the observed strongly regulated genes are interesting candidates for further, more in-depth, investigations into identifying key genes in the anti-herbivory response of F. vesiculosus.
This study strongly suggests a finely adjusted response of F. vesiculosus to isopod attack by using a temporally variable defence pattern, which is similar to the dynamics of palatability in the related brown alga Ascophyllum nodosum. Using several short defence pulses to repel herbivores may improve the seaweed’s cost/benefit ratio, particularly since the deterrence of herbivores involves redistribution of metabolism from growth and primary metabolism towards defence. In this regard, gene expression analysis revealed the degradation of storage compounds in order to provide the required energy for defence induction, while photosynthesis was strongly down-regulated (). These findings hint at possible costs for defence induction and achieve a more comprehensive understanding of cellular processes underlying seaweed–herbivore interactions.
Supplementary information
The following supplemental material is available for this article, accessible via the Supplementary Content tab on the article’s online page at http://dx.doi.org/10.1080/09670262.2014.946452.
Table S1. Results of the 2-factorial RM-ANOVA for the induction and reduction phase, comparing feeding rates affected by treatment (control/grazed) and time. Consumption was assessed in two-choice feeding assays using either fresh or reconstituted Fucus vesiculosus (n = 10).
Table S2. Complete list of Fucus vesiculosus genes that were differentially regulated between seaweed pieces that were previously grazed by I. baltica for 15 and 18 days, and non-grazed control pieces.
Table S3. Complete annotation list of the F. vesiculosus cDNA library.
Supplementary material
Download Zip (3.5 MB)Acknowledgements
Financial support was provided by the PACES research program of the Alfred-Wegener-Institut (AWI) Helmholtz-Zentrum für Polar- und Meeresforschung. Microarray development and protocol adjustments for Fucus vesiculosus were supported by a grant of The Future Ocean Cluster of Excellence (Project ‘Model Macroalga’, CP0746-6) and a Marie Curie International Reintegration Grant of the EU to I.K. (Call: FP7-PEOPLE-2007-4-3-IRG; Project ‘IDA’, 208801). C.R.F. was financially supported by the Rosa Luxemburg Foundation. We thank Lisa Güntner for lab assistance and Shauna Murray for the language check of this manuscript.
References
- Agrawal, A.A. (2005). Future directions in the study of induced plant responses to herbivory. Entomologia Experimentalis et Applicata, 115: 97–105.
- Apel, K. & Hirt, H. (2004). Reactive oxygen species: metabolism, oxidative stress, and signal transduction. Annual Review of Plant Biology, 55: 373–399.
- Apt, K.E., Clendennen, S.K., Powers, D.A. & Grossman, A.R. (1995). The gene family encoding the fucoxanthin chlorophyll proteins from the brown alga Macrocystis pyrifera. Molecular and General Genetics, 246: 455–464.
- Arnold, T.M., Targett, N.M., Tanner, C.E., Hatch, W.I. & Ferrari, K.E. (2001). Evidence for methyl jasmonate-induced phlorotannin production in Fucus vesiculosus (Phaeophyceae). Journal of Phycology, 37: 1026–1029.
- Arora, A., Sairam, R. & Srivastava, G. (2002). Oxidative stress and antioxidative system in plants. Current Science, 82: 1227–1238.
- Baldwin, I. & Callahan, P. (1993). Autotoxicity and chemical defense: nicotine accumulation and carbon gain in solanaceous plants. Oecologia, 94: 534–541.
- Bärlocher, F. (1999). Biostatistik. Thieme, Stuttgart.
- Bell, E., Creelman, R.A. & Mullet, J.E. (1995). A chloroplast lipoxygenase is required for wound-induced jasmonic acid accumulation in Arabidopsis. Proceedings of the National Academy of Sciences USA, 92: 8675–8679.
- Bidwell, R.G.S., Percival, E. & Smestad, B. (1972). Photosynthesis and metabolism of marine algae. VIII. Incorporation of 14C into the polysaccharides metabolized by Fucus vesiculosus during pulse labeling experiments. Canadian Journal of Botany, 50: 191–197.
- Bilgin, D.D., Zavala, J.A., Zhu, J.I.N., Clough, S.J., Ort, D.R. & DeLucia, E.H. (2010). Biotic stress globally downregulates photosynthesis genes. Plant Cell and Environment, 33: 1597–1613.
- Bolton, M.D. (2009). Primary metabolism and plant defense – fuel for the fire. Molecular Plant-Microbe Interactions, 22: 487–497.
- Bouarab, K., Potin, P., Correa, J. & Kloareg, B. (1999). Sulfated oligosaccharides mediate the interaction between a marine red alga and its green algal pathogenic endophyte. The Plant Cell Online, 11: 1635–1650.
- Brawley, S.H. (1992). Mesoherbivores. In Plant–Animal Interactions in the Marine Benthos (John, D.M., Hawkins, S.J. & Price, J.H., editors), 235–263. Clarendon Press, Oxford.
- Cock, J.M., Sterck, L., Rouze, P., Scornet, D., Allen, A.E., Amoutzias, G., Anthouard, V., Artiguenave, F., Aury, J.M., Badger, J.H., Beszteri, B., Billiau, K., Bonnet, E., Bothwell, J.H., Bowler, C., Boyen, C., Brownlee, C., Carrano, C.J., Charrier, B., Cho, G.Y., Coelho, S.M., Collen, J., Corre, E., Da Silva, C., Delage, L., Delaroque, N., Dittami, S.M., Doulbeau, S., Elias, M., Farnham, G., Gachon, C.M., Gschloessl, B., Heesch, S., Jabbari, K., Jubin, C., Kawai, H., Kimura, K., Kloareg, B., Kupper, F.C., Lang, D., Le Bail, A., Leblanc, C., Lerouge, P., Lohr, M., Lopez, P.J., Martens, C., Maumus, F., Michel, G., Miranda-Saavedra, D., Morales, J., Moreau, H., Motomura, T., Nagasato, C., Napoli, C.A., Nelson, D.R., Nyvall-Collen, P., Peters, A.F., Pommier, C., Potin, P., Poulain, J., Quesneville, H., Read, B., Rensing, S.A., Ritter, A., Rousvoal, S., Samanta, M., Samson, G., Schroeder, D.C., Segurens, B., Strittmatter, M., Tonon, T., Tregear, J.W., Valentin, K., von Dassow, P., Yamagishi, T., Van de Peer, Y. & Wincker, P. (2010). The Ectocarpus genome and the independent evolution of multicellularity in brown algae. Nature, 465: 617–621.
- Cosse, A., Potin, P. & Leblanc, C. (2009). Patterns of gene expression induced by oligoguluronates reveal conserved and environment-specific molecular defense responses in the brown alga Laminaria digitata. New Phytologist, 182: 239–250.
- Cronin, G. & Hay, M. (1996). Within-plant variation in seaweed palatability and chemical defenses: optimal defense theory versus the growth-differentiation balance hypothesis. Oecologia, 105: 361–368.
- de Oliveira, L., Gregoracci, G., Silva, G., Salgado, L., Filho, G., Alves-Ferreira, M., Pereira, R. & Thompson, F. (2012). Transcriptomic analysis of the red seaweed Laurencia dendroidea (Florideophyceae, Rhodophyta) and its microbiome. BMC Genomics, 13: 487.
- Dittami, S.M., Scornet, D., Petit, J.L., Segurens, B., Da Silva, C., Corre, E., Dondrup, M., Glatting, K.H., Konig, R., Sterck, L., Rouze, P., Van de Peer, Y., Cock, J.M., Boyen, C. & Tonon, T. (2009). Global expression analysis of the brown alga Ectocarpus siliculosus (Phaeophyceae) reveals large-scale reprogramming of the transcriptome in response to abiotic stress. Genome Biology, 10: R66.
- Duffy, J.E. & Hay, M.E. (2000). Strong impacts of grazing amphipods on the organization of a benthic community. Ecological Monographs, 70: 237–263.
- Dworjanyn, S.A., Wright, J.T., Paul, N.A., De Nys, R. & Steinberg, P.D. (2006). Cost of chemical defence in the red alga Delisea pulchra. Oikos, 113: 13–22.
- Flöthe, C.R. & Molis, M. (2013). Temporal dynamics of inducible anti-herbivory defenses in the brown seaweed Ascophyllum nodosum (Phaeophyceae). Journal of Phycology, 49: 468–474.
- Franke, H.D., Gutow, L., & Janke, M. (2007). Flexible habitat selection and interactive habitat segregation in the marine congeners Idotea baltica and Idotea emarginata (Crustacea, Isopoda). Marine Biology, 150: 929–939.
- Grotewold, E. (2004). The challenges of moving chemicals within and out of cells: insights into the transport of plant natural products. Planta, 219: 906–909.
- Hay, M.E. & Fenical, W. (1988). Marine plant-herbivore interactions: the ecology of chemical defense. Annual Review of Ecology and Systematics, 19: 111–145.
- Hay, M.E., Kappel, Q.E. & Fenical, W. (1994). Synergisms in plant defenses against herbivores: interactions of chemistry, calcification, and plant quality. Ecology, 75: 1714–1726.
- Heinrich, S., Frickenhaus, S., Glöckner, G. & Valentin, K. (2012a). A comprehensive cDNA library of light- and temperature-stressed Saccharina latissima (Phaeophyceae). European Journal of Phycology, 47: 83–94.
- Heinrich, S., Valentin, K., Frickenhaus, S., John, U. & Wiencke, C. (2012b). Transcriptomic analysis of acclimation to temperature and light stress in Saccharina latissima (Phaeophyceae). PloS One, 7: e44342.
- Hemmi, A., Honkanen, T. & Jormalainen, V. (2004). Inducible resistance to herbivory in Fucus vesiculosus: duration, spreading and variation with nutrient availability. Marine Ecology Progress Series, 273: 109–120.
- Hermsmeier, D., Schittko, U. & Baldwin, I.T. (2001). Molecular interactions between the specialist herbivore Manduca sexta (Lepidoptera, Sphingidae) and its natural host Nicotiana attenuata. I. Large-scale changes in the accumulation of growth- and defense-related plant mRNAs. Plant Physiology, 125: 683–700.
- Karban, R., Agrawal, A.A., Thaler, J.S. & Adler, L.S. (1999). Induced plant responses and information content about risk of herbivory. Trends in Ecology and Evolution, 14: 443–447.
- Kessler, A. & Baldwin, I.T. (2002). Plant responses to insect herbivory: the emerging molecular analysis. Annual Review of Plant Biology, 53: 299–328.
- Konno, K., Hirayama, C., Nakamura, M., Tateishi, K., Tamura, Y., Hattori, M. & Kohno, K. (2004). Papain protects papaya trees from herbivorous insects: role of cysteine proteases in latex. Plant Journal, 37: 370–378.
- Küpper, F.C., Kloareg, B., Guern, J. & Potin, P. (2001). Oligoguluronates elicit an oxidative burst in the brown algal kelp Laminaria digitata. Plant Physiology, 125: 278–291.
- Leitner, M., Boland, W., & Mithöfer, A. (2005). Direct and indirect defences induced by piercing-sucking and chewing herbivores in Medicago truncatula. New Phytologist, 167: 597–606.
- Levine, A. (2002). Regulation of stress responses by intracellular vesicle trafficking? Plant Physiology and Biochemistry, 40: 531–535.
- Long, J.D., Hamilton, R.S. & Mitchell, J.L. (2007). Asymmetric competition via induced resistance: specialist herbivores indirectly suppress generalist preference and populations. Ecology, 88: 1232–1240.
- Mann, K.H. (1982). Ecology of Coastal Waters: A Systems Approach. University of California Press, Berkeley.
- Mauricio, R. (1998). Costs of resistance to natural enemies in field populations of the annual plant Arabidopsis thaliana. American Naturalist, 151: 20–28.
- Moran, M.D. (2003). Arguments for rejecting the sequential Bonferroni in ecological studies. Oikos, 100: 403–405.
- Neilson, E.H., Goodger, J.Q.D., Woodrow, I.E. & Møller, B.L. (2013). Plant chemical defense: at what cost? Trends in Plant Science, 18: 250–258.
- O’Brien, J.A., Daudi, A., Finch, P., Butt, V.S., Whitelegge, J.P., Souda, P., Ausubel, F.M. & Bolwell, G.P. (2012). A peroxidase-dependent apoplastic oxidative burst in cultured Arabidopsis cells functions in MAMP-elicited defense. Plant Physiology, 158: 2013–2027.
- Orav-Kotta, H. & Kotta, J. (2004). Food and habitat choice of the isopod Idotea baltica in the northeastern Baltic Sea. Hydrobiologia, 514: 79–85.
- Owen, J.R., Morris, C.A., Nicolaus, B., Harwood, J.L. & Kille, P. (2012). Induction of expression of a 14-3-3 gene in response to copper exposure in the marine alga Fucus vesiculosus. Ecotoxicology, 21: 124–138.
- Pavey, S.A., Bernatchez, L., Aubin-Horth, N. & Landry, C.R. (2012). What is needed for next-generation ecological and evolutionary genomics? Trends in Ecology and Evolution, 27: 673–678.
- Pearson, G., Lago-Leston, A., Valente, M. & Serrão, E. (2006). Simple and rapid RNA extraction from freeze-dried tissue of brown algae and seagrasses. European Journal of Phycology, 41: 97–104.
- Pearson, G.A., Hoarau, G., Lago-Leston, A., Coyer, J.A., Kube, M., Reinhardt, R., Henckel, K., Serrao, E.T., Corre, E. & Olsen, J.L. (2010). An expressed sequence tag analysis of the intertidal brown seaweeds Fucus serratus (L.) and F. vesiculosus (L.) (Heterokontophyta, Phaeophyceae) in response to abiotic stressors. Marine Biotechnology, 12: 195–213.
- Peterson, C. & Renaud, P. (1989). Analysis of feeding preference experiments. Oecologia, 80: 82–86.
- Poore, A.G., Campbell, A.H., Coleman, R.A., Edgar, G.J., Jormalainen, V., Reynolds, P.L., Sotka, E.E., Stachowicz, J.J., Taylor, R.B., Vanderklift, M.A. & Duffy, J.E. (2012). Global patterns in the impact of marine herbivores on benthic primary producers. Ecology Letters, 15: 912–922.
- Quinn, G.G.P. & Keough, M.J. (2002). Experimental Design and Data Analysis for Biologists. Cambridge University Press, Cambridge.
- Reymond, P., Bodenhausen, N., Van Poecke, R.M.P., Krishnamurthy, V., Dicke, M., & Farmer, E.E. (2004). A conserved transcript pattern in response to a specialist and a generalist herbivore. The Plant Cell Online, 16: 3132–3147.
- Ritschard, R.L. (1992). Marine algae as a CO2 sink. Water Air and Soil Pollution, 64: 289–303.
- Roa, R. (1992). Design and analysis of multiple-choice feeding-preference experiments. Oecologia, 89: 509–515.
- Roeder, V., Collén, J., Rousvoal, S., Corre, E., Leblanc, C. & Boyen, C. (2005). Identification of stress gene transcripts in Laminaria digitata (Phaeophyceae) protoplast cultures by expressed sequence tag analysis. Journal of Phycology, 41: 1227–1235.
- Rohde, S. & Wahl, M. (2008). Temporal dynamics of induced resistance in a marine macroalga: time lag of induction and reduction in Fucus vesiculosus. Journal of Experimental Marine Biology and Ecology, 367: 227–229.
- Rohde, S., Molis, M. & Wahl, M. (2004). Regulation of anti-herbivore defence by Fucus vesiculosus in response to various cues. Journal of Ecology, 92: 1011–1018.
- Smith, W.O., Jr. (1981). Marine macrophytes as a global carbon sink. Science, 211: 838–840.
- Strauss, S.Y., Rudgers, J.A., Lau, J.A. & Irwin, R.E. (2002). Direct and ecological costs of resistance to herbivory. Trends in Ecology and Evolution, 17: 278–285.
- Tollrian, R. & Harvell, C.D. (1999). The Ecology and Evolution of Inducible Defenses. Princeton University Press, Princeton.
- Toth, G.B. & Pavia, H. (2007). Induced herbivore resistance in seaweeds: a meta-analysis. Journal of Ecology, 95: 425–434.
- Valdivia, N., Golléty, C., Migné, A., Davoult, D. & Molis, M. (2012). Stressed but stable: canopy loss decreased species synchrony and metabolic variability in an intertidal hard-bottom community. PloS One, 7: e36541.
- Wahl, M., Jormalainen, V., Eriksson, B.K., Coyer, J.A., Molis, M., Schubert, H., Dethier, M., Karez, R., Kruse, I., Lenz, M., Pearson, G., Rohde, S., Wikstrom, S.A. & Olsen, J.L. (2011). Stress ecology in Fucus: abiotic, biotic and genetic interactions. Advances in Marine Biology, 59: 37–105.
- Weinberger, F. & Friedlander, M. (2000). Response of Gracilaria conferta (Rhodophyta) to oligoagars results in defense against agar-degrading epiphytes. Journal of Phycology, 36: 1079–1086.
- Weinberger, F., Lion, U., Delage, L., Kloareg, B., Potin, P., Beltran, J., Flores, V., Faugeron, S., Correa, J. & Pohnert, G. (2011a). Up-regulation of lipoxygenase, phospholipase, and oxylipin-production in the induced chemical defense of the red alga Gracilaria chilensis against epiphytes. Journal of Chemical Ecology, 37: 677–686.
- Weinberger, F., Rohde, S., Oschmann, Y., Shahnaz, L., Dobretsov, S. & Wahl, M. (2011b). Effects of limitation stress and of disruptive stress on induced antigrazing defense in the bladder wrack Fucus vesiculosus. Marine Ecology Progress Series, 427: 83–94.
- Whitham, T.G. (1983). Host manipulation of parasites: within-plant variation as a defense against rapidly evolving pests. In Variable Plants and Herbivores in Natural and Managed Systems (Denno, R.F. & McClure, M.S., editors), 15–41. Academic Press, New York.
- Wiesemeier, T., Jahn, K. & Pohnert, G. (2008). No evidence for the induction of brown algal chemical defense by the phytohormones jasmonic acid and methyl jasmonate. Journal of Chemical Ecology, 34: 1523–1531.
- Wikström, S.A. & Kautsky, L. (2007). Structure and diversity of invertebrate communities in the presence and absence of canopy-forming Fucus vesiculosus in the Baltic Sea. Estuarine Coastal and Shelf Science, 72: 168–176.
- Winer, B.J., Brown, D.R. & Michels, K.M. (1991). Statistical Principles in Experimental Design, 3rd edition. McGraw-Hill, New York.
- Wong, T.K.M., Ho, C.L., Lee, W.W., Rahim, R.A. & Phang, S.M. (2007). Analyses of expressed sequence tags from Sargassum binderi (Phaeophyta). Journal of Phycology, 43: 528–534.
- Yazaki, K. (2006). ABC transporters involved in the transport of plant secondary metabolites. FEBS Letters, 580: 1183–1191.
- Yun, H.Y., Cruz, J., Treitschke, M., Wahl, M. & Molis, M. (2007). Testing for the induction of anti-herbivory defences in four Portuguese macroalgae by direct and water-borne cues of grazing amphipods. Helgoland Marine Research, 61: 203–209.
- Yun, H.Y., Rohde, S., Linnane, K., Wahl, M. & Molis, M. (2010). Seaweed-mediated indirect interaction between two species of meso-herbivores. Marine Ecology Progress Series, 408: 47–53.
- Yun, H.Y., Engelen, A.H., Santos, R.O. & Molis, M. (2012). Water-borne cues of a non-indigenous seaweed mediate grazer-deterrent responses in native seaweeds, but not vice versa. PloS One, 7: e38804.
- Zangerl, A.R., Arntz, A.M. & Berenbaum, M.R. (1997). Physiological price of an induced chemical defense: photosynthesis, respiration, biosynthesis, and growth. Oecologia, 109: 433–441.
- Zhou, Y.-H. & Ragan, M. (1995). Cloning and characterization of the nuclear gene and cDNAs for triosephosphate isomerase of the marine red alga Gracilaria verrucosa. Current Genetics, 28: 317–323.