
Abstract
Strong ocean current systems characterize the Southern Ocean. The genetic structure of marine phytoplankton species is believed to depend mainly on currents. Genetic estimates of the relatedness of populations of phytoplankton species therefore should provide a proxy showing to what extent different geographic regions are interconnected by the ocean current systems. In this study, spatial and temporal patterns of genetic diversity were studied in the circumpolar prymnesiophyte Phaeocystis antarctica Karsten using seven nuclear microsatellite loci. Analyses were conducted for 86 P. antarctica isolates sampled around the Antarctic continent between 1982 and 2007. The results revealed high genetic diversity without single genotypes recurring even among isolates within a bloom or originating from the same bucket of water. Populations of P. antarctica were significantly differentiated among the oceanic regions. However, some geographically distant populations were more closely related to each other than they were to other geographically close populations. Temporal haplotype turnover within regions was also suggested by the multilocus fingerprints. Our data suggest that even within blooms of P. antarctica genetic diversity and population sizes are large but exchange between different regions can be limited. Positive and significant inbreeding coefficients hint at further regional substructure of populations, suggesting that patches, once isolated from one another, may not reconnect. These data emphasize that even for planktonic species in a marine ecosystem that is influenced by strong currents, significant breaks in gene flow may occur.
Introduction
The Southern Ocean (SO), spanning over 20 degrees of latitude, has a unique current system () and is the only ocean that connects the Atlantic, Pacific and Indian Oceans. The Antarctic Circumpolar Current (ACC, West Wind Drift; Deacon, Citation1937) has no existing continental barriers and therefore forms a continuous, circumpolar current system (Thompson, Citation2008). The ACC shows a high variability caused by tides (5–10 cm s−1), mesoscale eddies (35–50 cm s−1) and near-inertial motion (10 cm s−1), which can be forced by changes in the large-scale wind stress (25 cm s−1) (Sarukhanyan, Citation1985; Smith et al., Citation2013) and by climate change (Böning et al., Citation2008). The Antarctic Coastal Current (ACoC, East Wind Drift; Deacon, Citation1937), a counter current to the ACC, flows westward, parallel and close to the Antarctic coastline; its flow is partially constrained by the Antarctic Peninsula (Tchernia, Citation1981; Grelowski & Pastuszak, Citation1984; Gyory et al., Citation2003). Between these current systems, hydrographic circulations form well-defined gyres, the two largest being the Weddell Gyre and the Ross Gyre. Both gyres exhibit seasonal changes in their extensions from surface to depth (Dellnitz et al., Citation2009). This seasonality of the current pattern, the advection of cells by the currents and the currents themselves may therefore also promote gene flow among planktonic populations that live in this system or act as strong barriers to gene flow between population that inhabit different current systems if patches develop, and do not or only occasionally reconnect. Local extinctions can occur, or populations can become inbred. Therefore, strong genetic differentiation could be expected even for phytoplankton species. Galand et al. (Citation2009) and Agogue et al. (Citation2011) have shown that bacterial assemblages within the same water mass can be similar over thousands of kilometres, though between different water masses they can vary across hundreds of metres (Wilkins et al., Citation2013).
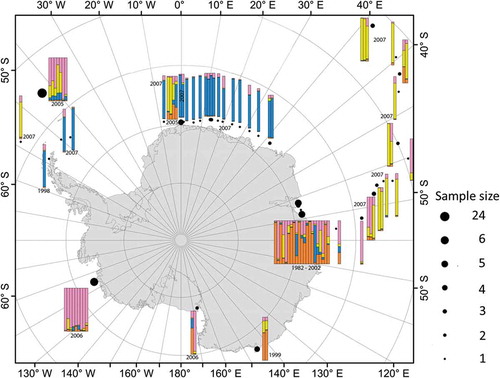
Fig. 1. Sampling sites of P. antarctica (white dots) and current systems in the Southern Ocean (redrawn from Rintoul et al., Citation2001). White arrows indicate the Antarctic Coastal Current (ACoC), acting as counter-current of the ACC.
The Antarctic phytoplankton is dominated by diatoms and phytoflagellates, which bloom under different ecological conditions (Smetacek et al., Citation2004). Diatoms act as background species, i.e. those species that are there in small numbers, but never bloom like the fast-growing, boom-and-bust, carbon sinkers of iron-replete regions or the slower growing, persistent silica sinkers from the iron-limited ACC (Assmy, Citation2004). Among the phytoflagellates, Phaeocystis antarctica Karsten is a keystone species that dominates the phytoplankton standing stock in certain regions of the SO and thus contributes significantly to primary production in the Antarctic pelagic system (El-Sayed et al., Citation1983; Bodungen et al., Citation1986; Arrigo et al., Citation1999; Nöthig et al., Citation2009).
The three major life cycle strategies of phytoplankton: diploid (viz., diatoms), haploid (viz., dinoflagellates) and haplo-diploid (viz., prymnesiophytes), probably represent different keystone taxa because each group reproduces sexually at different stages of their blooms and with different temporal frequencies (Assmy, Citation2004; Schoemann et al., Citation2005; Peperzak, Citation2006; Rokitta et al., Citation2011). The prymnesiophyte haplo-diploid life cycle has an alternation of generations between the two ploidy levels (Edvardsen et al., Citation2011), and there is some evidence that the two stages flourish under different environmental conditions (Peperzak, Citation2002; Noël et al., Citation2004; Rokitta et al., Citation2011). The haploid flagellate stage is difficult to document because the life cycle of Phaeocystis contains various flagellate stages, which can either be the haploid gametophyte that completes the haplo-diploid life cycle or a diploid zoospore that reproduces the diploid colony. The dominant colonial stage of Phaeocystis is diploid (Rousseau et al., Citation2007).
Both flagellate stages can reproduce vegetatively and appear to have a different morphology (Peperzak et al., Citation2000; Rousseau et al., Citation2007; Zingone et al., Citation2011; Peperzak & Gäbler-Schwarz, Citation2012). Both stages of Phaeocystis can bloom (Schoemann et al., Citation2005) and different nutrient environments may perpetuate one stage over the other. The presence of the presumed zygote stage (attached aggregate) as a resting cell on the setae of Chaetoceros spp. each spring suggests that sexual reproduction and the transition from one stage to another could take place at least annually (Gäbler-Schwarz et al., Citation2010). Both haploid and diploid flagellates are parasitized by viruses, whereas the colonial stage is not (Brussard et al., Citation2007). The implications of this for the genetic diversity of the colonial stage, where sexual reproduction occurs, are unknown.
Relatively few species play such a fundamental role in the trophic structure and biogeochemical cycles of the SO as does P. antarctica (Smetacek et al., Citation2004). Its blooms dominate both at depth (Arrigo et al., Citation1999) and in shallow mixed layers in the SO (Bodungen et al., Citation1986). Generally a phytoplankton bloom can be defined as ‘a high concentration of phytoplankton in an area, caused by increased reproduction; [this] often produces discolouration of the water’ (Garrison, Citation2005). Phaeocystis globosa, sister species of P. antarctica, has the same effect in temperate waters and its massive blooms directly affect microplankton diversity during its bloom (Monchy et al., Citation2012). The peculiar physiology of this microalga can profoundly influence tropho-dynamics, community composition and biogeochemical carbon and sulphur cycles in the SO (Davidson & Marchant, Citation1992).
ITS sequence analysis of P. antarctica recovered clades that correspond to different geographic regions in the SO (Lange et al., Citation2002). In comparison with P. globosa, which diverged at the same time from the cold-water species (30 mya) and has two different ITS genotypes, sometimes even in the same strain (Lange et al., Citation2002; Medlin & Zingone, Citation2007), P. antarctica has only one major ITS genotype in all of the isolates studied to date and minor base changes recover clades from different water masses around the Antarctic. Limited flow cytometry analysis of its genome size did not indicate any differences in ploidy level among selected genetically distinct strains (Gäbler-Schwarz et al., Citation2010). Thus P. antarctica is, based on existing evidence, a single species, whereas both P. globosa and P. pouchetii are probably species complexes (see the interpretation of sibling species In Ditylum brightwellii (Koester et al., Citation2010)).
In view of the results of past ITS studies (Lange et al., Citation2002) and strong coastal currents, populations of P. antarctica within the ACoC can be expected to be well-mixed (Medlin & Zingone, Citation2007; Dellnitz et al., Citation2009). Homogeneous population structure as a result of currents has been documented in several other eukaryotes with free-swimming life stages around Antarctica (Fraser et al., Citation2009; Nikula et al., Citation2010; Raupach et al., Citation2010; Bortolotto et al., Citation2011). In other studies of population structure of marine phytoplankton (Rynearson & Armbrust, Citation2000, Citation2004, Citation2005; Iglesias-Rodriguez et al., Citation2006; Rynearson et al., Citation2006; Alpermann et al., Citation2009; Casteleyn et al., Citation2010; Härnström et al., Citation2011), distinct population structure has been recovered both on a local scale and on a global scale. Although current patterns in the SO sharply delimit specific oceanic regions, P. antarctica may be regionally different and diverse despite ongoing gene flow as a result of local adaptations to respective ecological conditions. The commonly used gene markers (ITS, 18S) may not be sufficiently variable to uncover this (but see the preliminary study by Lange et al., Citation2002). Several studies have hypothesized that isolation by physical and/or ecological barriers is an important driver in allopatric processes, even in high-dispersal marine microbes, such as phytoplankton, which have large population sizes (see references in Casteleyn et al., Citation2010). Casteleyn et al. (Citation2010) point out that ‘persistent, restricted gene flow between geographically separated populations can, given the right geographic and environmental conditions, lead to population differentiation and high diversity in planktonic organisms, despite the dampening effect of large population sizes’. In addition, despite planktonic organisms frequently having huge census populations sizes (Nc), recent evidence suggests that the effective population size may in fact be up to 12 orders of magnitude smaller than expected (see Watts et al., Citation2013 and references therein).
To gain deeper insights into the population structure of P. antarctica, polymorphic microsatellites (MS) were developed (Aggrawal et al., Citation2010), and we used these microsatellites to address the following questions: (1) How diverse are populations of P. antarctica, which are known to form massive blooms in the SO? Do we find a dominant genotype as in other planktonic species, or instead many genetically different individuals? (2) To what degree are populations of P. antarctica around Antarctica genetically interconnected? Are isolates sampled from a distinct current system more similar than those sampled from outside that current system? (3) Is there a strong association of allele and genotype frequencies of P. antarctica populations in different years?
Materials and methods
Culture sampling
Phaeocystis antarctica was sampled with a phytoplankton hand net (55 µm) or by skimming the surface water with a bucket on several RV Polarstern cruises (ANT XXII-4, ANT XXIII-2, ANT XXIII-4, ANT XXIII-9) and at Antarctic research stations between 2005 and 2007. Altogether 586 cultures of colonies of P. antarctica were established, but because of very low survival rates (c. 40%), only 230 colonial cultures from various regions in the SO are currently maintained at the Alfred Wegener Institute, Helmholtz Centre for Polar and Marine Research, Bremerhaven, Germany. Isolations were done on board the research vessels via mouthpipetting to isolate colonies (1 isolate = 1 colony), or back in the lab. Isolates had to be reisolated several times because of contamination, especially from diatoms, before they were clean and accepted for incorporation into the strain collection. While the isolates were kept in culture, in some instances, flagellate cells appeared in the cultures, which could be either haploid (gametes) or diploid (zoospores). Regardless of the ploidy level of the flagellates in the culture, some colonial stages persisted in all cultures and these diploid cells were genotyped. In this study, we genotyped 110 clonal isolates sampled from different expeditions all around the Antarctic continent (, Supplementary Table 1); 27 P. antarctica isolates of the 110 investigated in this study were isolated by Dr Andrew Davidson from 1982 to 2002 (see Supplementary Table 1 for more detailed information) and provided from Australian Antarctic Division, CSIRO Division of Fisheries, Hobart, Tasmania, Australia.
Table 1. Number of alleles (Na) and effective number of alleles (EffNa), observed heterozygosity (Ho), expected heterozygosity (He, genetic diversity), inbreeding coefficient (Gis) and percentage of missing data per locus.
Cultures and culture conditions
Only unialgal isolates were used for the study; therefore 110 cultures of the prymnesiophyte P. antarctica were grown at 0–2°C in a 12:12 h light/dark regime, with photosynthetically active radiation levels (PAR) of 30 µmol photons m−2 s−1 in sterile filtered GP5 media (33 psu, Loeblich & Smith, Citation1968; Loeblich, Citation1975). Cultures contained both flagellate and colonial stages of P. antarctica. In each case, isolates from the same region (longitude/latitude) originated from the same population and bloom (if a bloom was present), respectively, and even the same bucket of water. To define a bloom we refer to Garrison (Citation2005; see Introduction for definition).
Harvesting and DNA extraction
To yield the maximum DNA concentration at least 250 ml culture (aged 3 weeks) were harvested. Harvesting was done by several centrifugation steps at 2500 rpm to 3100 rpm for 4 min (depending on the properties of the sample) and the pellet washed with cold (0–5°C) sterile-filtered Antarctic water. Samples were kept on ice or at 4°C at all times. After a final centrifugation at 4000 rpm for 6 min, the pellet was frozen in liquid nitrogen and stored at −20°C until further processing. Total DNA from these 110 clonal P. antarctica isolates was isolated using the EZNA Plant DNA Kit (Peqlab Biotechnologie GmbH) with the following modifications: (1) using Qiagen RNase instead of the EZNA RNase because of better results, (2) additional washing steps were conducted and (3) 50 µl elution buffer was used to increase yield.
PCR and genotyping
Eight microsatellite (MS) loci for P. antarctica (Aggrawal et al., Citation2010) were applied to assess the genetic diversity of this species around Antarctica. The 20 µl PCR reactions contained 10 mM F and R primers (Thermo-Fisher Scientific, Germany), 2.0 µl 5 M Betaine, 2.0 µl 2 mM dNTPs, 1.0 µl 10× BSA, 2.0 µl 10× HotMaster Taq-buffer with 25 mM Mg2+, HotMaster Taq-polymerase (5 U µl−1) (Eppendorf, Germany) and 10–20 ng DNA template. The forward primer was labelled with FAM/HEX. Cycling conditions on an epigradient thermocycler (Eppendorf) were an initial denaturation at 94°C for 1 min followed by 50 cycles of 94°C for 15 s, annealing (Ta) for 20 s, and extension of 70°C for 30 s; followed by a final extension of 70°C for 10 min and 4°C on hold (see full text to primer note at http://tomato.biol.trinity.edu/). PCR products were checked on 2% TBE agarose gels, diluted 1–10 fold with Fluka water (Sigma), and then 1 µl of the diluted product was denatured with 14.7 µl HI-DI formamide with 0.3 µl GeneScan ROX 500 size standard (Applied Biosystems). Fragments were analysed on an ABI 3130xl sequencer, and genotyping was performed manually using the software GENEMAPPER 4.0 (Applied Biosystems) and carried out by two people independently.
Data analysis
Multilocus microsatellite fingerprints were generated for all 110 isolates. Microsatellite locus 8 did not amplify successfully in more than 50% of the isolates so was not used for these analyses. Furthermore, we filtered the data set to contain only isolates for which at least four microsatellites could be genotyped. Therefore only 86 isolates were used in the final analysis. Because one specimen had no precise information on the sampling year, we excluded it from the temporal STRUCTURE analyses. For two other isolates, no precise information for the sampling day and/or longitude/latitude data were available so these were excluded from partial Mantel test analyses (see below).
Tests for deviations from Hardy–Weinberg proportions (HWP) and for linkage disequilibrium (LD) were performed on the complete data set using the software GenoDive (Meirmans & van Tinderen, Citation2004). Size ranges and number of alleles per locus were retrieved for all MS loci using GENALEX v6.2 (Peakall & Smouse, Citation2006, Citation2007) and GenoDive. Here, the number of similar and distinct genotypes was also compared to estimate the genetic diversity of the populations.
Genetic variation and differentiation
Because only one or few isolates were available from the same location (i.e. geographically defined population), we could not perform isolation by distance analyses based on pairwise population divergence. Therefore, we calculated pairwise genetic distances among individuals and performed partial Mantel tests using the software zt version 1.1 (Bonnet & Van de Peer, Citation2002). First, we tested for the correlation between genetic distance and geographic distance controlling for time (third matrix). Subsequently, we tested for a correlation between genetic distance and temporal distance controlling for sampling sites (third matrix). To assess the robustness of the correlation, we used five commonly used genetic distance measures, calculated using GenoDive (Chord, Smouse & Peakall, Manhattan and inverted kinship distance).
We used the Bayesian clustering program STRUCTURE Version 2.3.4 (Pritchard et al., Citation2000; Falush et al., Citation2003) to infer simultaneously population structure and assign individuals to populations in a predefined range of possible population clusters (K = 1 to K = 12). For the P. antarctica data set, the most likely number of populations was first inferred without a priori information on population origin and sampling time. Ten independent runs were performed for each inference of K. After checking for convergence of mcmc runs, a burn-in of 50 000 was used and analyses were run for a further 100 000 mcmc steps. STRUCTURE HARVESTER (Earl & von Holdt, Citation2012) was used to estimate the most likely number of K. The software CLUMPP (Jakobsson & Rosenberg, Citation2007) was used for random permutations of the five data sets and the analysis of a consensus admixture plot of the independent analyses. The resulting admixture proportions were visualized using the software DISTRUCT (Rosenberg Citation2004). An explicit test for pairwise differentiation between geographically defined populations was only performed for samples from the ACC and the ACoC because they were from the same year (2007) and had almost sufficient numbers of isolates (n = 18 each). We estimated standardized Fst values using GenoDive.
Results
Microsatellites were extremely polymorphic with the number of alleles ranging from Na = 26 (Locus 4) to Na = 59 (Locus 2) for the 86 isolates (Supplementary Table 1). In addition, all investigated clones had unique genotypes, differing in at least two of the seven loci analysed (). The number of alleles, number of effective alleles, observed heterozygosity, expected heterozygosity (genetic diversity), inbreeding coefficient (Gis) and missing data per locus are given in . Observed heterozygosity (HO) ranged from 0.52 (locus 4) to 0.78 (Locus 2). For the pooled data set, only locus 5 was in HWP. Because of the pooling of the samples (spatially and temporally) and the specific life cycle, these results are expected. No LD between loci was observed after Bonferroni correction. The length range of alleles was extremely broad for locus 7 (70 bp to 404 bp). Nevertheless, alleles could be scored reliably because one or two alleles without stutter were always clearly present. All isolates differed in at least two of the loci. The values for Gis were positive () and overall significant (P < 0.001, 999 permutations).
Fig. 2. Number of unique genotypes when considering from one and up to seven microsatellites of the data set. Whereas all isolates shared genotypes for at least two loci, no isolate shared more than five of the analysed seven microsatellites indicating the great variation even within isolates from a single bucket of seawater.
The results of the first partial Mantel tests consistently revealed highly significant and positive correlations between the genetic distance between isolate pairs and the respective geographic distances for all five genetic matrices (). Comparatively small values for the coefficient of regression r (0.118–0.178) are largely caused by the enormous variance of the small but hypervariable data set. The results of the second partial Mantel tests testing for correlation between genetic and temporal distance revealed less pronounced patterns. However, for three of the five genetic estimators, a small but significant positive correlation with time was found. This suggests that, in particular, physical distance and time explain patterns of variation in P. antarctica.
Table 2. Results of partial Mantel tests.
Population assignment
The results of the STRUCTURE analysis, without a prior on population origin or time, revealed that K = 4 is the most likely number of population clusters (data not shown). The proportions of these clusters showed a distinct geographic pattern (). Samples in the ACC, north of the 60°S, had high proportions of either the yellow cluster (‘typical ACC’) or the pink cluster (primarily found in the Amundsen Sea). Samples from Prydz Bay from various years showed variable proportions of membership genotypes, but primarily orange and pink genotypes were found. Samples from off Queen Maud Land (south of 60°S, longitude: 10°W to 45°E) grouped into two distinct clusters. All samples from 2007 showed high membership coefficients to the blue cluster and from 2005 to the yellow cluster indicating temporal changes in allele and genotype frequencies. Samples from the Peninsula and the Scotia Arc showed both a temporal and a geographic signature. Samples from 2007 had pink and yellow genotypes dominating and were found to the north of the 60° of southern latitude. Samples around the tip of the Antarctic Peninsula from 1998 and 2007 showed high membership proportions to the blue population cluster. High membership proportions to the pink cluster predominated in the Amundsen Sea and in one of the two individuals from the Ross Sea. The other individual from the Ross Sea, as well as samples from the Mertz Glacier, had genotypes resembling those from Prydz Bay (primarily orange with yellow, pink and blue admixture proportions).
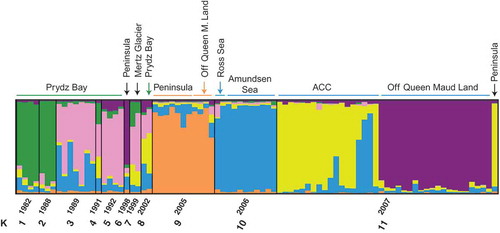
Fig. 3. Assignment of individuals (coloured bars) to populations using full data set excluding two for which no sampling time information was available (86 isolates, see Supplementary Table 1) and the program STRUCTURE with population ‘time’ prior (npops = 11). Run parameters: 10 independent runs, burn-in 50 000 generations, MCMC 100 000 generations. In the diagrams below, the likelihood of the dataset for a given K (right) and Delta K, with the most likely number of K for the data set following Evanno et al. (Citation2005) is shown. Both Delta K and the average likelihood for a given K were highest for K = 6 from the 10 independent runs.
The results of the STRUCTURE analysis with the sampling year as a population prior (11 different years) revealed K = 6 as the most likely number of clusters (). Samples from Prydz Bay from six different years fell into three different subgroups (years 1982 and 1988 were similar, years 1989, 1991 and 1992 were similar, and the two isolates from 2002 were different). All samples from the year 2005 and 2006 constituted rather homogeneous clusters (orange for 2005, blue for 2006). For 2005, all samples, with the exception of one, were collected around the Antarctic Peninsula. The only isolate from off Queen Maud Land fell within this cluster. The samples from 2006 were all collected in the Amundsen or Ross Sea. Samples from the year 2007 clustered into three subgroups: (1) isolates predominantly sampled in the Antarctic Circumpolar Current and one from the Antarctic Peninsula (yellow); (2) isolates from off Queen Maud Land (Prydz Bay Transect); and (3) three individuals that were assigned with high admixture proportions to the 2006 samples from the Ross Sea (). The single isolate from the Antarctic Peninsula from the year 1998 was assigned to samples from off Queen Maud Land from 2007, and the two isolates from the Mertz Glacier had higher similarities to the Prydz Bay isolates from 1989, 1991 and 1992.
Fig. 4. Assignment of individuals (coloured bars) to populations using full data set (with the exception of those where no sampling date was given, i.e. 85 isolates) and the program STRUCTURE without prior on population origin/time. Run parameters: 10 independent runs, burn-in 50 000 generations, MCMC 100 000 generations. Following the correction method of Evanno et al. (Citation2005), the highest likelihood for a given K was for K = 4. Colours refer to the proportions of cluster for each genotype found.
We tested explicitly for regional population subdivision between isolates from the two major current systems (ACC and ACoC) for isolates collected in the year 2007 to avoid pooling different temporal samples. The samples from the ACC north of the 60°S between 40°E and 90°E longitude (n = 18) and from the coastal region (ACoC, PB-T in Supplementary Table 1, also n = 18) south of the 60°S latitude and between 10°W and 45°E were significantly differentiated as indicated by high and significant standardized Fst value (F’st = 0.585, P<0.01).
Discussion
Observations of high genetic diversity within and evidence of gene flow among populations of P. antarctica isolates from the Scotia Sea, Weddell Sea, Prydz Bay and areas in the ACC from a multilocus fingerprinting approach (amplified fragment length polymorphism, AFLP) led us to design a microsatellite analysis of P. antarctica populations to gain deeper insights into genetic diversity and population structure of this polar key species (Gäbler et al., Citation2007).
Microsatellite studies have been conducted in a limited number of phytoplankton populations, primarily because of sampling logistics and the obligate requirement to make single cell isolations into culture for analysis. Nevertheless, most studies have shown planktonic populations to be fragmented with limited gene flow between adjacent areas. Rynearson and co-workers (Rynearson & Armbrust, Citation2000, Citation2004, Citation2005; Rynearson et al., Citation2006; Koester et al., Citation2010) studied the genetic diversity of the diatom Ditylum brightwellii in the Puget Sound estuary, Washington, USA, and identified four genetically distinct and highly diverse populations with distinct physiological characteristics that differed in their distribution and abundance in time and space. For the diatom Pseudo-nitzschia pungens isolation by distance from Belgium to New Zealand has been shown, which to date is the only phytoplankton species with a cosmopolitan distribution that has been documented to be a single species, using both a molecular and a biological species concept (Casteleyn et al., Citation2010). On the other hand the global cosmopolitan, highly diverse coccolithophore Emiliania huxleyi (Iglesias-Rodriguez et al., Citation2006) has disjunct global populations and little gene flow between populations in close geographic proximity (e.g. North Atlantic and Norwegian fjords). Data for Norwegian fjords resampled c. 10 years apart showed that only one genotype was shared by the population sampled in 1992 and the population sampled c. 10 years later. Mesocosm studies of mixture of five genotypes of E. huxleyi exposed to environmental manipulations designed to force microevolution in this species have demonstrated that mutations in microsatellites can occur within ecological time scales, viz., in 500 generations (Lohbeck et al., Citation2012). From the Hardy Plankton recorder Ripley et al. (Citation2008) discovered that the genotype of E. huxleyi dominant in the samples from 1974 to 1984 disappeared from 1994 to 2001 but has now reappeared.
These data suggest that despite their enormous census population sizes, the long-term effective population size Ne might be much smaller. Precise estimates, however, are difficult. In a recent study of a protist, Watt et al. (Citation2013) showed that Ne is up to possibly 12 orders of magnitude smaller than Nc. Other studies on microsatellites in phytoplankton have shown consistently high levels of genetic diversity and no differentiation: 100-year-old resting cells of Skeletonema marinoi were regenerated and microsatellite analysis showed no differentiation between these ‘fossil’ populations and modern ones (Härnström et al., Citation2011). For the freshwater diatom, Sellaphora capitata (in the S. pupula species complex), only a small number of alleles from water bodies in Scotland, England, Belgium and Australia could be found in all isolates (Evans et al., Citation2009), indicating limited dispersal between populations, although all isolates could still interbreed. At ocean basin levels, West Atlantic (Bay of Fundy), East Atlantic (North Sea) and West Pacific (Hiroshima Bay) populations of the dinoflagellate Alexandrium tamarense (toxic North American clade) (Alpermann et al., Citation2009) showed high genetic and toxin diversity as well as significant genetic differences among these regions and proposed that significant genetic structure within subpopulations was a result of different year classes of cysts (zygotes) that had hatched to form these subpopulations. The flagellate Heterosigma akashiwo around Japan was composed of distinct populations, with little evidence for gene flow between them even though tidal currents would permit natural dispersal of the cells from one area to another (Nagai et al., Citation2007).
Our microsatellite analysis of P. antarctica populations was designed to determine if they belong to a single population and, if not, how the genetic diversity was distributed between and among the various water masses sampled. The final analysis was processed using a filtered data set containing 86 isolates. This is a low sampling number, but reflects the typical challenge in planktonic research in general – to get large enough amounts of material from the organism of interest. Although the limited size of our data set constrains detailed analyses on fine-scale structure, our data suggest that genetic variation is not homogeneously distributed among Antarctic populations of P. antarctica. Isolates sampled in the year 2007 from the ACoC (Off Queen Maud Land) were significantly different from isolates sampled in the ACC the same year. The results of STRUCTURE identify an isolate from the Antarctic Peninsula that shares a similar genotype with the ACC isolates (yellow bar, ). Furthermore the results indicate that isolates within regions are mostly similar in their genotypes. A prominent exception to this rule is the prominent change in alleles at Prydz Bay over time (), showing that annual turnover in different regions may be high. More samples will be needed to prove the underlying principles.
As is the case for all phytoplankton, the distribution of P. antarctica is primarily controlled by current patterns, which should, in principle, allow gene flow between regions (Patarnello et al., Citation1996; Fraser et al., Citation2009; Raupach et al., Citation2010; Bortolotto et al., Citation2011). The Weddell Gyre and the Ross Gyre, formed by the ACC and its counter-current (ACoC), show seasonal changes in their depth extensions. During spring and summer, the Weddell Gyre is far deeper at about 4000 m depth, whereas in autumn and winter, its main structure is subsurface, only extending to about 2000–3000 m depth. This is also seen for the Ross Gyre, because its extent shrinks considerably between autumn and winter (Dellnitz et al., Citation2009). The pattern and intensity of the unique current regime of the Southern Ocean undoubtedly influence the distribution and connectivity of its planktonic populations (McManus & Woodson, Citation2012; Woodson et al., Citation2012). The average time a particle (e.g. a cell) will stay within the Weddell Gyre is dependent on the season and therefore also the mean residence time of water (MRTW) is seasonally dependent (Dellnitz et al., Citation2009). If we compare the entire structure of the Weddell Gyre ‘body’ sensu Dellnitz et al. (Citation2009), then the composition of MRTW declines quickly towards the ocean surface, because of upwelling driven by surface divergence, and is completely changed from summer to spring. So the MRTW over the whole gyre depth in summer/autumn/winter ranges from 0 to 11 years, whereas in spring it only ranges from 1 to 8 years. The MRTW in the top surface layer at approximately −100 m is about 3 years in spring/summer, whereas in autumn/winter, the average time is about 0–2 years.
The partial Mantel tests provide evidence that geographic distance is a relevant predictor of genetic diversity patterns and this has been supported in other planktonic studies (see references above). Samples separated in time are more divergent, indicating significant temporal changes in allele frequencies (similar to the above studies on E. huxleyi).
All isolates investigated had unique genotypes and differed in at least two of the microsatellites (). This suggests that even at locations where multiple isolates were taken, no single clone dominated the population, which could have been the case if a bloom situation was present. Furthermore, allele size ranges of the microsatellites were much greater than that known from other species. Both observations hint at a rather large present population size of P. antarctica, which limits analysis of population structure based upon few isolates and loci. Similar findings have been reported for the red alga Chondrus crispus from France (Krueger-Hadfield et al., Citation2011) and for Emiliania huxleyi from several ocean basins (Iglesias-Rodriguez et al., Citation2006).
If we examine only the data from 2007 (), we see a prominent geographic and latitudinal structure: the specimens from the ACC in the Scotia Sea and between 40°W and 90°E share similar genotype membership coefficients (yellow), whereas the isolates from near the coast (off Queen Maud Land) have rather similar genotypes (purple). This distinction is supported by the high and significant Fst values and could be explained by the current systems. While the ACC encircles the Antarctic continent eastward, the ACoC flows westwards near to the Antarctic continent (). Thus, members of P. antarctica in the ACC share alleles even over long distances but are distinct from members from off Queen Maud Land, which disperse via the ACoC to the tip of the Antarctic Peninsula. The similarities in the membership proportions of the samples collected in 2005 from the Scotia Sea and the Eastern Weddell Sea (orange cluster 9 in ) might originate from the ACC transporting water masses eastwards and the Weddell Gyre westwards. But because of the limited number of isolates analysed, we can only speculate as to the cause of these patterns.
If we suppose that populations of Amundsen Sea/Ross Sea, Antarctic Peninsula/Scotia Arc and Prydz Bay are steadily entrained into the ACC, then the ACC may act as a vehicle for dispersing specimens and could explain allele sharing among populations from geographically distant regions. Similar observations have been made for macroalgal species or organisms that can raft on such species (Waters, Citation2008; Leese et al., Citation2010) or species with pelagic life stages (Raupach et al., Citation2010), and several (but not all) notothenioid fish species (see Matschiner et al., Citation2009, table 3 for an overview). The obvious difference between these examples and Phaeocystis is the genetic heterogeneity in space and time observed in the latter. This could be a feature of its life cycle, the environmental triggers necessary to switch from one stage to the other, the occurrence of sexual reproduction, sampling time or rather low sample size (Gäbler-Schwarz et al., Citation2010).
The complex life cycles with haploid and diploid generations probably have different environmental requirements for growth and different environmental cues that induce the change from one life cycle stage to another. For the data set, most loci were not all in HWP, indicating population structure or an influence of clonal reproduction that can quickly distort HWP (Black & Johnson, Citation1979). The extremely wide length range of alleles for several loci, in particular locus 7, indicates that mutations other than expansions and contractions of a single reported core motif (Aggrawal et al., Citation2010) have contributed to the size differences, i.e. several interrupted repeat motifs probably occur. There is no information on the frequency of sexual reproduction, but it is assumed that sexual reproduction occurs at least annually at the collapse of the bloom when the colonial stages disintegrate. However, because flagellated stages (of unknown ploidy) can appear at least in culture at any time, there is always a possibility that sexual reproduction could occur multiple times in a year. Consequently we expected deviations from HWP in P. antarctica because (1) the entire data set does not represent a geographically and temporal homogeneous pool of isolates and (2) the frequency changes between the haplo-diploid stages of P. antarctica are an unknown. Different haploid/diploid life cycles (heteromorphic and isomorphic) are observed among brown algae (e.g. Undaria pinnatifida, Scytosiphon lomentaria, Dictyota dichotoma), green algae (Derbesia marina, Bryopsis plumosa, Ulva pertusa) and red algae (Palmaria palmata, Porphyra yezoensis, Gelidium elegans Hori, Citation1993; Yoshida, Citation1998; Ohno, Citation2004), and their phylogenetic distribution suggests that these differences in life cycles could have evolved many times within distinct groups of species. They may be a result of adaptation to the environment, rather than evolutionarily preserved traits. This variety of life cycles observed may reflect adaptations to seasonally changing environments (Bessho & Iwasa, Citation2009).
The results of our two STRUCTURE analyses highlight, in particular, that P. antarctica isolates do not resemble a single population, with few dominating genotypes, but this has also been a feature recovered in other phytoplankton taxa (Rynearson & Armbrust, Citation2000, Citation2004; Igelisas et al., 2006; Rynearson et al., Citation2006; Alpermann et al., Citation2009). The slightly different results for the two analysed sets highlight the limited signal inherent in the data because of the enormous allelic richness () and the limited number of isolates per population. This is also supported by the two partial Mantel tests (). Therefore, temporal patterns may have had a structuring effect on the gene pool in regions as shown in and . Alpermann et al. (Citation2009) proposed that their finding significant genetic structure within subpopulations of A. tamarense was a result of different year classes of cysts (zygotes) that had hatched to form these subpopulations. Recalling the life cycle of P. antarctica with a proposed overwintering stage (zygote, Gäbler-Schwarz et al., Citation2010), this might also explain why the two isolates around the tip of the Antarctic Peninsula show the same high membership proportions to the blue population cluster, although they have been sampled nine years apart ().
Because the data set consists of different isolates from different points in time and space (1982 to 2007), we also cannot systematically test for selection in different regions/times given the extremely variable markers. Therefore, the question as to what extent local adaptation further influences the observed pattern of genetic structure has to be addressed with a larger sample size than we have to date. Our sampling programme was not uniquely designed just for Phaeocystis but was integrated into regular cruise tracks designed to sample other biological, geological or physical phenomena, and thus we cannot predict ahead of time if a bloom or a population of Phaeocystis will be encountered in any sampling programme. It is just as likely that blooms could be missed and only remnants of blooms remain that could affect clonal survival. We have no control over the success of clonal isolation even if the clones are isolated from bloom conditions, and clonal survival is the key factor controlling our sample size from any location. However, the results of our study reveal genetic differentiation among P. antarctica populations with the currents and possibly adaptation to local conditions playing an important role in their structure. Analyses of genetic structure indicate that patterns of the geographic distribution of polymorphisms are more complex and restricted among several sampling sites than expected for a pelagic system with strong currents. The distinct gyres and current systems may hence even act as an isolating barrier between locally adapted populations (), probably because patches of phytoplankton have been formed that do not reconnect, either spatially or temporally. Bacterial assemblages within the same water mass have been found to be similar over thousands of kilometres; between water masses they can vary across hundreds of metres (Galand et al., Citation2009; Agogue et al., Citation2011; Wilkins et al., Citation2013). Wilkins et al. (Citation2013) showed that microbial communities in the SO that are more closely connected via advection are more similar and this ‘effect exists even when environment and distance effects are controlled for’. So advection boosts chances for colonization instead of transporting huge cell amounts around and therefore predominantly shapes microbial community structure (Wilkins et al., Citation2013).
We also have preliminary evidence that populations in each gyre, regardless of their genetic relatedness to populations in other gyres, react in a similar fashion to environmental conditions. We tested the salinity tolerance of five different isolates from three different locations around the Antarctic to determine if genetic differences were correlated with phenotypic differences (Gäbler-Schwarz, Citation2009). Genetically close isolates (as determined by AFLP analysis) did not respond similarly to the salinity conditions tested. Rather, there was a geographic-based response, and we concluded that certain ecotypic responses predominate over genotypic differences in each geographic region sampled. Each phytoplankton patch could have developed a highly diverse and frequently sexually reproducing population (thereby generating the mandatory genetic variation and recombination), and this diversity provided the populations in each ecosystem with the ability to respond to the environmental parameters of that ecosystem.
Local environmental selection of broadly dispersed species primarily controls community structure and this has been shown both in geological and real time (Ceramo & Falkowsky, Citation2009). One would assume that this also operates at the population level to prevent gene flow, and when coupled with circulation patterns, populations can become fragmented.
Returning to the three questions originally proposed, we can respond to these as follows:
Bloom-forming populations of P. antarctica are composed of genetically very different individuals. In no case did we find the same genotype in the 86 isolates studied with seven microsatellites, although many isolates originated from the same region (or bucket of water). In addition, allelic variation and length ranges of microsatellites were great, strongly suggesting a rather large effective population size of P. antarctica. However, further studies are needed to confirm this.
Phaeocystis antarctica populations are not strictly isolated within the oceanic regimes that they inhabit, but many alleles are shared among populations. The ACC provides a dispersal mechanism among populations to all other oceanographic regimes of the SO. However, our results show that these regimes still maintain significantly distinct populations. Possibly, there might be further substructuring within regions, which can only be assessed with more material and loci.
At least in the population sampled off Queen Maud Land, we see strong differences between the 2005 and 2007 isolates. Furthermore, the 2007 isolates sampled near the Antarctic Peninsula were genetically more similar to those from 2007 off Queen Maud Land. This suggests that current systems can aid gene flow over long distances within one year, but also that strong turnover of genotypes can occur, i.e. small long-term effective population sizes.
Our study affords valuable insights into geographic and temporal patterns structuring populations of one of the major keystone taxa in Antarctic pelagic ecosystem functioning. The results support a central role of current patterns in mediating and restricting gene flow among P. antarctica populations in different regions, although we cannot disentangle the relative importance of local adaptation based on the limited data available. Changes in genetic diversity within Phaeocystis assayed by microsatellites will be useful in examining the stability of its populations through time as climate changes and we see its effects on the biomass (Boyce et al., Citation2010) and we can expect changes in the genetic diversity of its species.
As a general remark, one could ask if our results, based upon cultured organisms, reflect the natural situation. Only to a limited extent are we able to observe phytoplankton populations in their natural ecosystem, e.g. by means of in situ observations, by performing process studies in defined ocean areas, by using mesocosm experiments or by collecting fresh specimens from the field and studying them immediately. However, precise information about how phytoplankton respond to defined changing environmental factors and the analysis of the genetic basis for such responses can only be obtained from individuals cultured under specified abiotic and biotic conditions, sometimes over periods of years and decades (but see Lohbeck et al., 2011) for ecological timescale genetic responses under mesocosm conditions). A phytoplankton strain is not a static snapshot of a natural algal population, but rather a dynamic, ever-changing laboratory population, and thus it may change over time (Lakeman et al., Citation2009). Therefore it is necessary to analyse a strain very soon after isolation to prevent possible genetic alterations. Molecular analyses on board research vessels could quickly screen a large number of cells picked and transferred to culture media. However, this has not yet been possible, and we can only interpret the results in view of the limited number of isolates that survived in culture. In general, we would expect a higher level of clonality because of genetic drift in small culture populations, but our results do not support this because of the finding of enormous diversity and the absence of clonality.
In agreement with these examples of the partitioning of genetic polymorphisms in phytoplankton, we conclude that populations represented by clonal isolates of P. antarctica in this study show a high genetic diversity. We hypothesize that frequent sexual reproduction facilitates local adaptation to different regimes occurring within an isolated patch of phytoplankton, which can act as a further inflation of genetic differences between populations. In the future, the application of more samples with genome-wide markers, such as restriction-site associated DNA sequencing (RAD), may further help to elucidate the relative importance of local adaptation and physical isolation by currents in P. antarctica.
Supplementary information
The following supplementary material is accessible via the Supplementary Content tab on the article’s online page at http://10.1080/09670262.2014.998295
Supplementary Table 1. Information on the isolates analysed, sampling details and prior assignments to populations based on sampling site (‘region’) and sampling time (‘time’).
Supplementary Table 1
Download MS Word (29.9 KB)Acknowledgements
The work reported here was supported by DFG ME 1480/2. SGS is presently supported by DFG SM22/11 and GA1896/1-2 and FL is supported by DFG grant LE 2323/2-1.
References
- Aggrawal, R.K., Allainguillaume, J., Bajay, M.M., Barthwal, S., Bertolino, P., Chauhan, P., Consuegra, S., Croxford, A., Dalton, D.L., den Belder, E., Diaz-Ferguson, E., Douglas, M.R., Drees, M., Elderson, J., Esselink, G.D., Fernandez-Manjarres, J.F., Frascaria-Lacoste, N., Gäbler-Schwarz, S., de Leaniz, C.G., Ginwal, H.S., Goodisman, M.A.D., Guo, B.L., Hamilton, M.B., Hayes, P.K., Hong, Y., Kajita, T., Kalinowski, S.T., Keller, L., Koop, B.F., Kotze, A., Lalremruata, A., Leese, F., Li, C.H., Liew, W.Y., Martinelli, S., Matthews, E.A., Medlin, L.K., Messmer, A.M., Meyer, E.I., Monteiro, M., Moyer, G.R., Nelson, R.J., Nguyen, T.T.T., Omoto, C., Ono, J.Y., Pavinato, V.A.C., Pearcy, M., Pinheiro, J.B., Power, L.D., Rawat, A., Reusch, T.B.H., Sanderson, D., Sannier, J., Sathe, S., Sheridan, C.K., Smulders, M.J.M., Sukganah, A., Takayama, K., Tamura, M., Tateishi, Y., Vanhaecke, D., Vu, N.V., Wickneswari, R., Williams, A.S., Wimp, G.M., Witte, V. & Zucchi, M.I. (2010). Permanent Genetic Resources added to Molecular Ecology Resources Database 1 August 2010–30 September 2010. Molecular Ecology Resources, 11: 219–222.
- Agogue, H., Lamy, D., Neal, P.R., Sogin, M.L. & Herndl, G.J. (2011). Water mass specificity of bacterial communities in the North Atlantic revealed by massively parallel sequencing. Molecular Ecology, 20: 258–274.
- Alpermann, T.J., Beszteri, B., John, U., Tillmann, U. & Cembella, A.D. (2009). Implications of life history transitions on the population genetic structure of the toxigenic marine dinoflagellate Alexandrium tamarense. Molecular Ecology, 18: 2122–2133.
- Arrigo, K.R., Robinson, D.H., Worthen, D.L., Dunbar, R.B., DiTullio, G.R., VanWoert, M. & Lizotte, M.P. (1999). Phytoplankton community structure and the drawdown of nutrients and CO2 in the Southern Ocean. Science, 283: 365–367.
- Assmy, P. (2004). Temporal development and vertical distribution of major components of the plankton assemblage during an iron fertilization experiment in the Antarctic Polar Frontal Zone, PhD thesis, University Bremen. hdl:10013/epic.21160.
- Bessho, K. & Iwasa, Y. (2009). Heteromorphic and isomorphic alternations of generations in macroalgae as adaptations to a seasonal environment. Evolution and Ecological Resources, 11: 691–711.
- Black, R. & Johnson, M.S. (1979). Asexual vivipary and population genetics of Actinia tenebrosa. Marine Biology, 53: 27–31.
- Bodungen, von B., Smetacek, V., Tilzer, M.M. & Zeitzschel, B. (1986). Primary production and sedimentation during spring in the Antarctic Peninsula region. Deep-Sea Research, 33: 177–194.
- Boning, C.W., Dispert, A., Visbeck, M., Rintoul, S.R. & Schwarzkopf, F.U. (2008). The response of the Antarctic Circumpolar Current to recent climate change. Nature Geosciences, 1: 864–869.
- Bonnet, E. & Van de Peer, Y. (2002). Zt: a software tool for simple and partial Mantel tests. Journal of Statistical Software, 7: 1–12.
- Bortolotto, E., Bucklin, A., Mezzavilla, M., Zane, L. & Patarnello, T. (2011). Gone with the currents: lack of genetic differentiation at the circum-continental scale in the Antarctic krill Euphausia superba. BMC Genetics, 12: 32.
- Boyce, D.G., Lewis, M.R. & Worm, B. (2010). Global phytoplankton decline over the past century. Nature, 466: 591–596.
- Brussard, P.D., Bratbak, G., Baudoux, A.C. & Ruardij, P. (2007). Phaeocystis and its interaction with viruses. Biogeochemistry, 83: 201–215.
- Cermeno, P. & Falkowski, P.G. (2009). Controls on diatom biogeography in the ocean. Science, 325: 1539.
- Casteleyn, G., Leliaert, F., Backeljau, T., Debeer, A., Kotaki, Y., Rhodes, L., Lundholm, N., Sabbe, K. & Vyvermann, W. (2010). Limits to gene flow in a cosmopolitan marine planktonic diatom. Proceedings of the National Academy of Sciences of the USA, 107: 12952–12957.
- Davidson, A.T. & Marchant, H.J. (1992). The biology and ecology of Phaeocystis (Prymnesiophyceae). In Progress in Phycological Research, Vol. 8 (Round, F.E. & Chapman, D.J., editors), 1–46. Biopress, Bristol.
- Deacon, G.E.R. (1937). A general account of the hydrology of the Southern Ocean. Discovery Reports, 15: 125–152.
- Dellnitz, M., Froyland, G., Horenkamp, C., Padberg-Gehle, K. & Sen Gupta, A. (2009). Seasonal variability of the subpolar gyres in the Southern Ocean: a numerical investigation based on transfer operators. Nonlinear Processes in Geophysics, 16: 655–663.
- Earl, D.A. & von Holdt, B.M. (2012). STRUCTURE HARVESTER: a website and program for visualizing STRUCTURE output and implementing the Evanno method. Conservation Genetics Resources, 4: 359–361.
- Edvardsen, B., Eikrem, W., Throndsen, J., Sáez, A.G., Probert, I. & Medlin, L.K. (2011). Ribosomal DNA phylogenies and a morphological revision provide the basis for a revised taxonomy of the Prymnesiales (Haptophyta). European Journal of Phycology, 46: 202–228.
- El-Sayed, S.Z., Biggs, D.C. & Holm-Hansen, O. (1983). Phytoplankton standing crop, primary productivity, and near-surface nitrogenous nutrient fields in the Ross Sea, Antarctica. Deep-Sea Research, 30: 871–886.
- Evans, K.M., Chepurnov, V.A., Sluiman, H.J., Thomas, S.J., Spears, B.M. & Mann, D.G. (2009). Highly differentiated populations of the freshwater diatom Sellaphora capitata suggest limited dispersal and opportunities for allopatric speciation. Protist, 160: 386–396.
- Evanno, G., Regnaut, S. & Goudet, J. (2005). Detecting the number of clusters of individuals using the software STRUCTURE: a simulation study. Molecular Ecology, 14: 2611–2620.
- Falush, D., Stephens, M. & Pritchard, J.K. (2003). Inference of population structure using multilocus genotype data: linked loci and correlated allele frequencies. Genetics, 164: 1567–1587.
- Fraser, C.I., Spencer, H.G. & Waters, J.M. (2009). Glacial oceanographic contrasts explain phylogeography of Australian bull kelp. Molecular Ecology, 18: 2287–2296.
- Galand, P.E., Potvin, M., Casamayor, E.O. & Lovejoy, C. (2009). Hydrography shapes bacterial biogeography of the deep Arctic Ocean. Nature, 4: 564–576.
- Gäbler, S., Hayes, P.K. & Medlin, L.K. (2007). Methods used to reveal genetic diversity in the colony forming prymnesiophytes Phaeocystis antarctica, P. globosa and P. pouchetii – preliminary results. Biogeochemistry, 83: 19–27.
- Gäbler-Schwarz, S. (2009). Estimation of genetic diversity in the colony forming polar prymnesiophyte species Phaeocystis antarctica. PhD thesis, University of Bremen. hdl:10013/epic.33807.
- Gäbler-Schwarz, S., Davidson, A.T., Assmy, P., Henjes, J. & Medlin, L.K. (2010). A new cell stage in the colony forming haptophyte Phaeocystis antarctica. Journal of Phycology, 46: 1006–1016.
- Garrison, T. (2005). Oceanography: An Invitation to Marine Science. 5th ed. Belmont, CA: Thomson Brooks/Cole.
- Grelowski, A. & Pastuszak, M. (1984). Preliminary determination of the occurrence and movement of water masses in the regions of South Georgia Island, the Scotia Sea and the Antarctic Peninsula. Oceanologia/Oceanology, 14: 87–111.
- Gyory, J., Cangialosi, J., Jo, I., Mariano, A.J. & Ryan, E.H. (2003). The Antarctic Coastal Current. Ocean Surface Currents. http://oceancurrents.rsmas.miami.edu/southern/antarctic-coastal.html.
- Härnström, K., Ellegaard, M., Andersen, T.J. & Godhe, A. (2011). Hundred years of genetic structure in a diatom population. Proceedings of the National Academy of Sciences of the USA, 108: 4252–4257.
- Hori, T. (1993). An Illustrated Atlas of the Life History of Algae, Vol. 1. Uchida Rokkakuho, Tokyo.
- Iglesias-Rodriguez, M.D., Schofield, O.M., Batley, P.J., Medlin, L.K. & Hayes, P.K. (2006). Extensive intraspecific genetic diversity in the marine coccolithophore Emiliania huxleyi: the use of microsatellite analysis in marine phytoplankton population studies. Journal of Phycology, 42: 526–536.
- Jakobsson, M. & Rosenberg, N.A. (2007). CLUMPP: a cluster matching and permutation program for dealing with label switching and multimodality in analysis of population structure. Bioinformatics, 23: 1801–1806.
- Koester, J.A., Swalwell, J.E., von Dassow, P. & Armbrust, V.E. (2010). Genome size differentiates co-occurring populations of the planktonic diatom Ditylum brightwellii (Bacillariophyta). BMC Evolutionary Biology, 10: 1. doi:10.1186/1471-2148-10-1.
- Krueger-Hadfield, S.A., Collén, J., Daguin-Thiébaut, C. & Valero, M. (2011). Genetic population structure and mating system in Chondrus crispus (Rhodophyta). Journal of Phycology, 47: 440–450.
- Lakeman, M.B., von Dassow, P. & Cattolico, R.A. (2009). The strain concept in phytoplankton ecology. Harmful Algae, 8: 746–758.
- Lange, M., Chen, Y.-Q. and Medlin, L.K. (2002). Molecular genetic delineation of Phaeocystis species (Prymnesiophyceae) using coding and non-coding regions of nuclear and plastid genomes. European Journal of Phycology, 37: 77–92.
- Leese, F., Agrawal, S. & Held, C. (2010). Long-distance island hopping without dispersal stages: transportation across major zoogeographic barriers in a Southern Ocean isopod. Naturwissenschaften, 97: 583–594.
- Loeblich, A.R. (1975). A seawater medium for dinoflagellates and the nutrition of Cachonina niei. Journal of Phycology, 11: 80–86.
- Loeblich, A.R. & Smith, V.E. (1968). Chloroplast pigments of the marine dinoflagellate Gymnodinium resplendens. Lipids, 3: 3–15.
- Lohbeck, K.T., Riebesell, U. & Reusch, T.B.H. (2012). Adaptive evolution of a key phytoplankton species to ocean acidification. Nature Geosciences, 5: 346–351.
- Matschiner, M., Hanel, R. & Salzburger, W. (2009). Gene flow by larval dispersal in the Antarctic notothenioid fish Gobionotothen gibberifrons. Molecular Ecology, 18: 2574–2587.
- McManus, M.A. & Woodson, C.B. (2012). Review: Plankton distribution and oceanic dispersal. Journal of Experimental Biology (Special Issue: Biophysics, Bioenergetics, and the Mechanistic Approach to Ecology), 215: 1008–1016.
- Medlin, L.K. & Zingone, A. (2007). A taxonomic review of the genus Phaeocystis. Biogeochemistry, 83: 3–18.
- Meirmans, P.G. & Van Tienderen, P.H. (2004). GENOTYPE and GENODIVE: two programs for the analysis of genetic diversity of asexual organisms. Molecular Ecology Notes, 4: 792–794.
- Monchy, S., Grattepanche, J.-D., Breton, E., Meloni, D., Sanciu, G., Chabé, M., Delhaes, L., Viscogliosi, E., Sime-Ngando, T. & Christaki, U. (2012). Microplanktonic community structure in a coastal system relative to a Phaeocystis bloom inferred from morphological and tag pyrosequencing methods. PLoS ONE, 7: e39924. doi:10.1371/journal.pone.0039924.
- Nagai, S., Lian, C., Yamaguchi, S., Hamaguchi, M., Matsuyama, Y., Itakura, S., Shimada, H., Kaga, S., Yamauchi, H., Sonda, Y., Nishikawa, T., Kim, C.H. & Hogetsu, T. (2007). Microsatellite markers reveal population genetic structure of the toxic dinoflagellates (Dinophyceae) in Japanese coastal waters. Journal of Phycology, 43: 43–54.
- Nikula, R., Fraser, C.I., Spencer, H.G. & Waters, J.M. (2010). Circumpolar dispersal by rafting in two subantarctic kelp-dwelling crustaceans. Marine Ecology Progress Series, 405: 221–230.
- Noël, M.H., Kawachi, M. & Inouye, I. (2004). Induced dimorphic life cycle of a coccolithophorid, Calyptrosphaera sphaeroidea (Prymnesiophyceae, Haptophyta). Journal of Phycology, 40: 112–129.
- Nöthig, E.M., Assmy, P., Klaas, C. & Scharek, R. (2009). Phyto- and protozooplankton in polar waters. In Biological Studies in Polar Oceans – Exploration of Life in Icy Waters (Hempel, G. & Hempel, I., editors), 65–73. Wirkschaftvlg. Nordwest.
- Ohno, M. 2004. Biology and Technology of Economic Seaweeds. Uchida Rokkakuho, Tokyo.
- Patarnello, T., Bargelloni, L., Varotto, V. & Battaglia, B. (1996). Krill evolution and the Antarctic ocean currents: evidence of vicariant speciation as inferred by molecular data. Marine Biology, 126: 603–608.
- Peakall, R. & Smouse, P.E. (2006). GENALEX 6: genetic analysis in Excel. Population genetic software for teaching and research. Molecular Ecology Notes, 6: 288–295.
- Peakall, R. & Smouse, P.E. (2007). GenAlEx 6.1 – Appendix 1 – Methods and Statistics. The Australian National University, Canberra.
- Peperzak, L. (2002). The wax and wane of Phaeocystis globosa blooms. PhD thesis, University of Groningen, the Netherlands.
- Peperzak, L. (2006). Below the Kolmogorov scale: the non-turbulent sex life of phytoplankton. African Journal of Marine Science, 28: 261–264.
- Peperzak, L., Colijn, F. & Peeters, J.C.H. (2000). Observations of flagellates in colonies of Phaeocystis globosa (Prymnesiophyceae); a hypothesis for their position in the life cycle. Journal of Plankton Research, 22: 2181–2203.
- Peperzak, L. & Gäbler-Schwarz, S. (2012). Review: Current knowledge of the life cycles of Phaeocystis globosa and Phaeocystis antarctica (Prymnesiophyceae). Journal of Phycology, 48: 514–517.
- Pritchard, J.K., Stephens, M. & Donnelly, P. (2000). Inference of population structure using multilocus genotype data. Genetics, 155: 945–959.
- Raupach, M.J., Thatje, S., Dambach, J., Rehm, P., Misof, B. & Leese, F. (2010). Genetic homogeneity and circum-Antarctic distribution of two benthic shrimp species of the Southern Ocean, Chorismus antarcticus and Nematocarcinus lanceopes. Marine Biology, 157: 1783–1797.
- Ripley, S.J., Baker, A.S., Miller, P.I., Walne, A.W. & Schroeder, D.C. (2008). Development and validation of a molecular technique for the analysis of archived formalin-preserved phytoplankton samples permits retrospective assessment of Emiliania huxleyi communities. Journal of Microbiological Methods, 73: 118–124.
- Rintoul, S., Hughes, C. & Olbers, D. (2001). The Antarctic Circumpolar Current System. In Ocean Circulation and Climate (Siedler, G., Church, J. & Gould, J., editors), 271–302. Academic Press, New York.
- Rosenberg, N.A. (2004). DISTRUCT: a program for the graphical display of population structure. Molecular Ecology Notes, 4: 137–138.
- Rokitta, S.D., de Nooijer, L.J., Trimborn, S., de Vargas, C., Rost, B. & John, U. (2011). Transcriptome analyses reveal differential gene expression patterns between the life-cycle stages of Emiliania huxleyi (Haptophyta) and reflect specialization to different ecological niches. Journal of Phycology, 47: 829–838.
- Rousseau, V., Chrétiennot-Dinet, M.J., Jacobsen, A., Verity, P. & Whipple, S. (2007). The life cycle of Phaeocystis: state of knowledge and presumptive role in ecology. Biogeochemistry, 83: 29–47.
- Rynearson, T.A. & Armbrust, E.V. (2000). DNA fingerprinting reveals extensive genetic diversity in a field population of the centric diatom Ditylum brightwellii. Limnology and Oceanography, 45: 1329–1340.
- Rynearson, T.A. & Armbrust, E.V. (2004). Genetic differentiation among populations of the planktonic marine diatom Ditylum brightwellii (Bacillariophyceae). Journal of Phycology, 40: 34–43.
- Rynearson, T.A. & Armbrust, E.V. (2005). Maintenance of clonal diversity during a spring bloom of the centric diatom Ditylum brightwellii. Molecular Ecology, 14: 1631–1640.
- Rynearson, T.A., Newton, J.A. & Armbrust, E.V. (2006). Spring bloom development, genetic variation, and population succession in the planktonic diatom Ditylum brightwellii. Limnology and Oceanography, 51: 1249–1261.
- Sarukhanyan, E.I. (1985). Structure and Variability of the Antarctic Circumpolar Current [NSF translation of Russian text]. Oxonian Press/New Delhi.
- Schoemann, V., Becquevort, S., Stefels, J., Rousseau, V. & Lancelot, C. (2005). Phaeocystis blooms in the global ocean and their controlling mechanisms: a review. Journal of Sea Research, 53: 43–66.
- Smetacek, V., Assmy, P. & Henjes, J. (2004). The role of grazing in structuring Southern Ocean pelagic ecosystem and biogeochemical cycles. Antarctic Science, 16: 541–558.
- Smith, R., Desflots, M., White, S., Mariano, A.-J. & Ryan, E.H. (2013). “The Antarctic CP Current.” Ocean Surface Currents. http://oceancurrents.rsmas.miami.edu/southern/antarctic-cp.html.
- Tchernia, P. (1981). Observation of the Antarctic East Wind Drift Current by using tabular icebergs tracked by satellite. Antarctic Journal of the United States, 15: 83.
- Thompson, A.F. (2008). The atmospheric ocean: eddies and jets in the Antarctic Circumpolar Current. Philosophical Transactions of the Royal Society A, 366: 4529–4541.
- Waters, J.M. (2008). Driven by the West Wind Drift? A synthesis of southern temperate marine biogeography, with new directions for dispersalism. Journal of Biogeography, 35: 417–427.
- Watts, P.C., Lundholm, N., Ribeiro, S. & Ellegaard, M. (2013). A century-long genetic record reveals that protist effective population sizes are comparable to those of macroscopic species. Biology Letters, 9: 20130849.
- Wilkins, D., van Sebille, E., Rintoul, S.R., Lauro, F.M. & Cavicchioli, R. (2013). Advection shapes Southern Ocean microbial assemblages independent of distance and environment effects. Nature Communications, 4: 2457.
- Woodson, C.B., McManus, M.A., Tyburczy, J., Barth, J.A., Washburn, L., Raimondi, P.T., Menge, B.A. & Palumbi, S.R. (2012). Persistent fronts structure connectivity patterns along the Eastern Pacific. Limnology and Oceanography, 57: 582–596.
- Yoshida, T. (1998). Marine Algae of Japan. Uchida Rokakuho, Tokyo.
- Zingone, A., Forlani, G., Percopo, I. & Montresor, M. (2011). Morphological characterization of Phaeocystis antarctica (Prymnesiophyceae). Phycologia, 50: 650–660.