
Abstract
In general, epiphytes have detrimental effects on the growth of their basiphytes due to competition for light and nutrients. Therefore, basiphyte species must expend energy suppressing epiphytes. Some studies suggest that phlorotannins, i.e. brown algal polyphenols, prevent colonization by epiphytes, whereas others question their allelopathic function because there is not necessarily a negative correlation between epiphyte abundance and the phlorotannin content of the basiphyte algae. Various phlorotannin components are found in brown algal species, thus we hypothesized that the antifouling activities of polyphenolic compounds may differ and that the analysis of phlorotannin profiles could be useful for estimating their ecological functions. We surveyed the epiphyte richness in the apical portions of 373 thalli from 15 sargassacean species, demonstrating that the variation and abundance of epiphyte species differed remarkably among the basiphyte species. However, there was a weak negative correlation between the density and total phlorotannin content of the basiphyte algae in only one of the 18 epiphyte species. The interspecific differences in the phlorotannin profile were characterized by quantitative 1H nuclear magnetic resonance spectroscopy (qNMR), and four major groups were categorized based on cluster and principal component analyses of polyphenolic signals in the qNMR spectra. The epiphyte Neosiphonia harveyi was more abundant on Sargassum hemiphyllum, S. patens and S. piluliferum than on other basiphyte species, and these three species were similar according to the cluster analysis. These results suggest that some phlorotannin components may be more effective for antifouling; thus interspecific differences in the phlorotannin profile could affect the variation and abundance of epiphytes.
INTRODUCTION
Macroalgae that grow on other larger macroalgae, i.e. epiphytes, are common in marine environments, e.g. 285 epiphyte species have been observed on algae from the order Laminariales (Tokida, Citation1960). In general, epiphytes reduce the fitness of their basiphytes due to competition for light and nutrients (Berger et al., Citation2003; Lepoint et al., Citation2007), increase attraction of herbivores (Jormalainen & Honkanen Citation2008) and amplify drag against water movement, which can lead to detachment (Stewart, Citation1982; Buschmann & Gómez, Citation1993). Therefore, it is important for basiphyte algae to prevent colonization by epiphytes in order to increase their performance.
It is considered that many basiphyte algae have evolved the capacity to inhibit colonization by epiphytes. The mechanical removal of epiphytes by shedding epidermal layers or discarding old blades has been reported in several basiphyte species (Filion-Myklebust & Norton, Citation1981; Littler & Littler, Citation1999; Nylund & Pavia, Citation2005; Garbary et al., Citation2009; Nakajima et al., Citation2015). Some secondary metabolites also inhibit the settlement and/or growth of epiphytes and epifauna (reviewed by Bhadury & Wright, Citation2004; Jormalainen & Honkanen, Citation2008). Phlorotannins are brown algal polyphenols, which are formed via the polymerization of phloroglucinol monomers (1,3,5-trihydroxybenzene). They are considered to be effective in preventing colonization by epibionts because of the negative correlation between the phlorotannin content of basiphyte algae and their epibiont abundance (Sieburth & Conover, Citation1965; Lau & Qian, Citation2000; Cho et al., Citation2001; Jormalainen et al., Citation2008; Ank et al., Citation2013). However, such a negative correlation has not been observed in other cases, and the antifouling effect of phlorotannins is still controversial (Rönnberg & Ruokolahti, Citation1986; Jennings & Steinberg, Citation1997; Wikström & Pavia, Citation2004; Honkanen & Jormalainen, Citation2005; Plouguerné et al., Citation2012; Yamamoto et al., Citation2013; Nakajima et al., Citation2015). Phlorotannins are known to have multiple functions, including herbivore deterrence, UV protection, cell wall biosynthesis, wound healing, and substrate adhesion (reviewed by Amsler & Fairhead, Citation2006). In addition, the concentrations of phlorotannins are influenced by environmental factors, such as temperature, light intensity, salinity and nutrient availability, as well as by biotic factors, such as grazing pressure and thallus age (Jormalainen & Honkanen, Citation2008; Kamiya et al., Citation2010). These properties of phlorotannins make it difficult to estimate their inhibitory effects on epiphytes.
Phlorotannin concentrations have generally been estimated by colorimetric methods using the Folin–Ciocalteu (FC) reagent, because this simple method uses commonly available equipment and reagents and has produced a large body of comparable data (Van Alstyne, Citation1995; Singleton et al., Citation1999). However, the estimation of phlorotannins occasionally differs between the FC and other methods (Koivikko et al., Citation2008; Parys et al., Citation2009; Jégou et al. Citation2015), which may be related to the high reactivity of FC to other compounds in addition to phenols, such as proteins, thiols, vitamin derivatives and nitrogen compounds (Stern et al., Citation1996; Ikawa et al., Citation2003; Everette et al., Citation2010). Recently quantitative 1H nuclear magnetic resonance spectroscopy (qNMR) has been used to quantify phlorotannin content because of its accurate identification of compounds, good repeatability and high precision (Parys et al., Citation2007, 2009; Jégou et al., Citation2010, Citation2015). There are remarkable differences between the values of phlorotannin contents measured by the FC and qNMR methods (Parys et al., Citation2009; Jégou et al., Citation2015), thus it is of interest to compare estimated concentrations using both methods.
Phlorotannins consist of polymers of phloroglucinol and the structures of the polymers are relatively similar, making it difficult to measure the levels of individual compounds (Ragan & Glombitza, Citation1986; Targett & Arnold, Citation2001; Koivikko et al., Citation2007, Citation2008). The bioactivity levels of phlorotannins, such as herbivore deterrence bactericidal and algicidal effects, and antifouling activities, also differ with molecular size (Boettcher & Targett, Citation1993; Nagayama et al., Citation2002, Citation2003), and total quantification methods cannot assess the different combinations and ratios of polyphenolic compounds. Therefore, quantifying the inter-/intraspecific variations of phlorotannin components may be useful for evaluating their roles in coastal ecosystems.
Sargassum is one of the largest algal genera and it includes 336 species (Guiry & Guiry, Citation2015), many of which form seaweed beds on temperate rocky shores that play important roles in marine ecosystems by providing food, habitats and nurseries for marine organisms (Fuse, Citation1962). Recently, these algae have been considered as biofuel resources due to their high biomass and rapid growth (Maceiras et al., Citation2011; Li et al., Citation2012). Various types of smaller algae use species of Sargassum as substrata but they are not distributed evenly on each basiphyte species, e.g. Nemacystus decipiens (Suringar) Kuckuck appears only on S. patens C. Agardh, S. piluliferum (Turner) C. Agardh, and S. yendoi Okamura & Yamada (Yotsui, Citation1980); while Neosiphonia harveyi (Bailey) Kim et al. is remarkably less abundant on S. siliquastrum (Turner) C. Agardh than on other Sargassum species (Yamamoto et al., Citation2012, Citation2013). Based on culture experiments Nakajima et al. (Citation2015) suggest that S. siliquastrum eliminates epiphytic N. harveyi after the attachment of their spores, possibly via cuticle peeling and/or tissue degradation of the basiphyte thalli. The relationships between epiflora and phlorotannin profiles, however, have not been investigated, and this information should be useful for a better understanding of the ecological interactions between epiphytes and basiphyte algae.
In the current study, we surveyed the variation in epiphyte abundance among sargassacean species and verified the relationship between the variation/abundance of epiphytes and the quality/quantity of phlorotannins. First, the density of each epiphyte was examined in 15 common sargassacean species from Japanese temperate coasts. Second, the phlorotannin contents of these 15 sargassacean species were analysed using both -FC and qNMR analyses to determine their correlation with the density of each epiphyte species. Third, the phlorotannin profiles of the 15 sargassacean species were analysed by qNMR and the similarities of the phlorotannin profiles were compared with the epiflora.
MATERIALS AND METHODS
Examinations of epiphyte abundance
One to 65 thalli of the following 15 sargassacean species were collected haphazardly from a rocky coast in Shikimi, Wakasa, Fukui (35°33’55”N, 135°50’26”E) on 8 November 2011 and/or Akaguri, Ooi, Fukui (35°31’29”N, 135°40’11”E) on 12 November 2011: Myagropsis myagroides (Mertens ex Turner) Fensholt, Sargassum autumnale Yoshida, S. confusum C. Agardh, S. fusiforme (Harvey) Setchell, S. hemiphyllum (Turner) C. Agardh, S. horneri (Turner) C. Agardh, S. ringgoldianum ssp. coreanum (J. Agardh) Yoshida, S. macrocarpus C. Agardh, S. micracanthum (Kützing) Endlicher, S. microceratium (Mertens ex Turner) C. Agardh, S. patens, S. piluliferum, S. siliquastrum, S. thunbergii (Mertens ex Roth) Kuntze and S. yezoense (Yamada) Yoshida & T. Konno. A main branch fragment was cut off each thallus from the apex to 10 cm below the apex, and the numbers of each epiphyte species attached to the main branch and the lateral branches of each fragment were recorded. The turf-like Sphacelaria and Acrochaetium were difficult to count, thus their densities were assessed roughly according to three grades. In the case of crustose coralline algae, the total thallus area was measured on each basiphyte thallus instead of the density. The surface area examined on each sargassacean thallus was scanned into the computer and measured using LIA for Win32 ver. 0.376ß1 software (Yamamoto, Citation2003). The density of each epiphyte was determined by calculating the number of epiphytes per cm2 of the surface area examined.
Folin–Ciocalteu (FC) analyses of phlorotannins
Several thalli were collected from each of 15 sargassacean species in Shikimi on 27 September 2011 or Akaguri on 28 September 2011. In the laboratory, we selected three thalli from each species and freeze-dried an epiphyte-free main branch, which was cut from the stipe of each plant. Approximately 10 mg of the freeze-dried thallus was ground using a pestle and mortar, and then extracted with 4 ml 80% aqueous methanol at 4°C in the dark for 24 h. This extract was centrifuged at 3500 × g at 4°C for 15 min and the volume of the supernatant was then measured. Next, 1 ml of the extract was placed in a microtube, which was centrifuged at 20 000 × g at 4°C for 5 min. Subsequently, 50 μl from each extract or 80% aqueous methanol (as a reference) was added to 1 ml of distilled water and 1 ml of 40% FC reagent (F9252; Sigma-Aldrich, St Louis, Missouri, USA) in an 8 ml glass tube. After incubating for 5 min at room temperature, 1 ml of 2 N Na2CO3 was added, which was followed by incubation for 30 min in a 50°C water bath. The absorbance of each solution was then measured at 765 nm. Anhydrous phloroglucinol (322-56502, Wako, Osaka, Japan) was used as the standard and the final phenolic contents were expressed as percentages of the dry mass. Interspecific differences in phlorotannin concentrations and epiphyte abundances were evaluated using analysis of variance and Kruskal–Wallis tests. Multiple comparisons were performed using Scheffe’s method as necessary. The correlations between these variables were analysed using Spearman’s rank correlation coefficient. All statistical analyses were conducted using JSTAT ver. 16.1 (available from http://www8.ocn.ne.jp/~jstat/index.html).
qNMR analyses of phlorotannins
Approximately 1 g of each freeze-dried sample was milled using an Absolute Blender ABS-V (Osaka Chemical Co. Ltd, Osaka, Japan) and then extracted in 200 ml 70% acetone at 4°C in the dark for 72 h. After removing any debris by suction filtration, the acetone was removed using a rotary evaporator N-1 (Tokyo Rikakikai Co. Ltd, Tokyo, Japan) and the extract was partitioned with 50 ml dichloromethane (eight times), followed by 50 ml petroleum ether (eight times). The aqueous layer was filtered using a syringe filter unit SLLGH25NS (Millipore, Massachusetts, USA) and freeze-dried. Forty milligrams of the freeze-dried extract was dissolved in 1.0 ml of NMR solvent (methanol-d4:D2O = 4:1) (Isotec, Georgia, USA) including 0.1 mg ml−1 DSS-d6 (2,2-dimethyl-2-silapentane-5-sulphonate-d6) (Wako, purity 92.8%, certified reference material) as an internal standard, and the solutions were then subjected to qNMR analysis in the following conditions using a JNM-ECA-600 MHz NMR (JEOL, Tokyo, Japan). Quantitative 1H NMR spectra were recorded at room temperature (21–25°C). Each spectrum comprised 64 000 data points with 16 scan times, an acquisition time of 4.1 s, a recycle delay of 60 s, and a pulse angle of 90° to facilitate complete relaxation and absolute quantification (Ohtsuki et al., Citation2014). The spectra were acquired with automatic sample loading and shimming, and were Fourier transformed with 0.2 Hz line broadening. Phase and baseline correction were performed using Alice2 for qNMR and metabolome software (JEOL).
In each qNMR spectrum, the resonance signals were sampled at intervals of 4.1 × 10⁻⁴ ppm between 5.6 and 6.7 ppm, because most phenolic compounds produce signals within this range (Parys et al., Citation2007, Citation2009). The absolute quantity of phlorotannins in the sample solution was determined following the methods of Parys et al. (Citation2007) according to the following formula:
CA (mg ml−1) = (MA×IA×Hstd×Wstd×Pstd)/(Mstd×Istd×HA×V ×100) where C = content (mg ml−1), M = molecular mass, Mstd = 224.2 (DSS-d6), MA = 124.0 (theoretical minimum unit of phlorotannins, phloroglucinol – 2H), I = signal area, H = number of protons, Hstd = 9, HA = 2, W = weight (mg), V = volume of the solution (=1.0) and Pstd = purity (=92.8). After calculation of phlorotannin content in each sample solution, the value was converted to phlorotannin content (%DM) in the alga. In total, 2683 segment values from each sample were used for cluster analysis to determine the similarities among the phenolic and polyphenolic components of 45 samples. All signals detected were used for this analysis because we could not determine which peaks were substantial. Hierarchical cluster analysis was performed using Ward’s method without standardization of the segment values. To quantify the concentration of phlorotannins, 40 mg of the freeze-dried and powdered thallus was used instead of the purified sample. The integrated value of all peaks was calculated as the phlorotannin content. Classification of the qNMR data was performed using k-means cluster analysis and principal components analysis (PCA). Correlation between the density of each epiphyte species and the quality/quantity of phlorotannins was also analysed. These analyses were performed using the statistical software package JMP9 (SAS Institute, North Carolina, USA).
RESULTS
In total, 18 species were recognized as epiphytes on 15 sargassacean species (): three green algae, Chaetomorpha crassa (C. Agardh) Kützing, Cladophora albida (Nees) Kützing and Cladophora vagabunda (Linnaeus) Hoek; one brown alga, Sphacelaria yamadae Segawa; 13 red algae, Acrochaetium sp., Campylaephora crassa (Okamura) Nakamura, Ceramium kondoi Yendo, Chondria crassicaulis Harvey, Chondria lancifolia Okamura, Champia parvula (C. Agardh) Harvey, Crouania attenuata (C. Agardh) J.Agardh, Erythrotrichia carnea (Dillwyn) J.Agardh, Gayliella flaccida (Harvey ex Kützing) Cho & McIvor, Gelidium elegans Kützing, Leveillea jungermannioides (Hering & Martens) Harvey, Neosiphonia harveyi, and a non-articulated coralline algae; and one diatom, Licmophora sp.
Table 1. The mean density and standard error (thalli cm−2) of each epiphyte species found on 15 sargassacean species. The epiphytic species are ordered by commonness. Less than 0.001 thalli cm−2 was indicated as +/‒. Because Sphacelaria yamadae and Acrochaetium sp. were difficult to count, high, intermediate and low density were expressed as +++, ++, +, respectively. In the case of crustose coralline algae, total thallus area (mm2 cm−2) was measured instead of the density. The total number of each sargassacean species examined is shown in parentheses.
In the FC analyses, the mean phlorotannin contents ranged from 12.2% (S. ringgoldianum ssp. coreanum) to 3.3% (S. microceratium) and they differed significantly among species (Scheffe’s test, N = 3, P < 0.05) (). There was no significant correlation between the phlorotannin contents and the total number of epiphyte species among the 15 sargassacean species (r = −0.364, P = 0.182). When the phlorotannin contents were compared with the abundances of the epiphyte species found on more than four sargassacean species, there was no significant correlation in any epiphyte species (data not shown).
Fig. 1. Mean phlorotannin contents (% dry matter) of 15 sargassacean algae measured by Folin–Ciocalteu (a) and qNMR (b) analyses. The different letters indicate significant differences (P < 0.05). Bars = standard errors of three samples. See for the explanation of abbreviations.
In the qNMR spectrum, each proton signal from 5.6 to 6.7 ppm was derived from either individual phlorotannin compounds or groups of phlorotannin molecules that differed in their degree of polymerization and partial structure. The spectra of the phlorotannins were virtually identical within the same species, whereas the number and height of the signals differed remarkably among species (, ). The phlorotannin content () was estimated by integrating all peaks detected from 5.6 to 6.7 ppm; the mean contents ranged from 5.0% (S. ringgoldianum ssp. coreanum) to 0.5% (S. microceratium) and they differed significantly among species (Scheffe’s test, N = 3, P < 0.05). The phlorotannin contents were not correlated with the total number of epiphyte species (r = −0.123, P = 0.646). Although the values determined by the FC analysis were 2.1- to 5.2-fold higher than those measured by the qNMR analysis, there was a highly significant correlation between the concentrations of phlorotannins determined by the FC and qNMR methods (r = 0.929, P = 0.0005).
Fig. 2. Spectra of the low qNMR data using M. myagroides (myagr), S. piluliferum (pilul), and S. siliquastrum (siliq). The signal intensity is shown in the range from 5.6 to 6.7 ppm of the chemical shift scale.
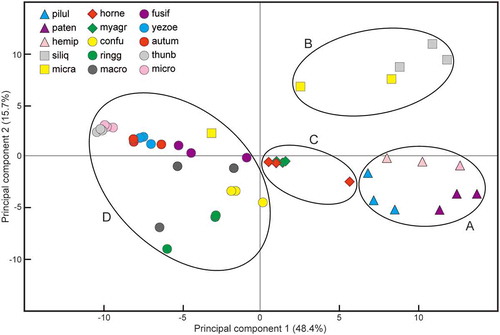
According to the hierarchical cluster analysis, three samples from the same species formed a cluster, except in the cases of S. macrocarpus and S. micracanthum (). Based on the results of the k-means cluster analysis and PCA, four major groups were recognized (, ): S. piluliferum, S. patens and S. hemiphyllum (group A); S. siliquastrum and S. micracanthum (sample I and II) (group B); S. horneri and M. myagroides (group C); and S. confusum, S. ringgoldianum ssp. coreanum, S. macrocarpus, S. micracanthum (sample III), S. fusiforme, S. yezoense, S. autumnale, S. thunbergii and S. microceratium (group D).
Fig. 3. Dendrogram of hierarchical cluster analysis based on the qNMR data (from 5.6 to 6.7 ppm) using three samples of each of 15 sargassacean species. The plot at the bottom shows the distances between the clusters. The four-cluster solution of the K-means analysis is indicated. See for the explanation of abbreviations.
Fig. 4. The result of principal component analysis based on the qNMR data (from 5.6 to 6.7 ppm) using three samples of each of 15 sargassacean species. See for the explanation of abbreviations.
DISCUSSION
Although 16 epiphyte species were detected on 15 sargassacean species in this study, many more epiphyte species have been observed at these sites (Kamiya & Ueda, unpublished data). In general, the variation and abundance of epiphytes decreases with proximity to the meristematic apices because the opportunity for epiphyte colonization increases with longer environmental exposure (Yamamoto et al., Citation2012). We counted the epiphyte abundance on the apical portion in which higher amounts of phlorotannins accumulate (Johnson & Mann, Citation1986; Tugwell & Branch, Citation1989; Kamiya et al., Citation2010) because the aim of this study was to examine the deterrence effect of phlorotannins against epiphytes. Although epiphytes are most abundant during spring to early summer, sargassacean thalli that tend to break down in this season are not appropriate for the qNMR analysis of phlorotannins. The variety and abundance of epiphytes are also influenced by environmental conditions, especially wave exposure and nutrient levels (Aguilar-Rosas & Galindo, Citation1990; Levin & Mathieson, Citation1991; Russell et al., Citation2005). We tried to collect all the basiphyte samples from similar habitats, which were relatively calm seashores at depths of 1–3 m, to avoid the effects of different environmental conditions.
We used two methods to estimate the concentration of phlorotannins, and the FC analysis showed two to five times higher values than the qNMR analysis. The analysis of crude extracts using the FC method could lead to an over-estimation of polyphenols because the FC reagent is also reactive toward proteins, thiols, vitamin derivatives and nitrogen compounds (Stern et al., Citation1996; Ikawa et al., Citation2003; Everette et al., Citation2010). Compared with the FC analysis, qNMR determines the total quantity of polyphenol molecules directly and is thus a more accurate method of quantification (Parys et al., Citation2007; Jégou et al., Citation2015).
Phlorotannin contents varied by up to almost 3.7 times (FC analyses) and 10.2 times (qNMR analyses) among sargassacean species. Nakai et al. (Citation2006) surveyed the phenol contents of various Japanese macroalgae, including eight sargassacean species, where the highest level of phenols was found in S. ringgoldianum. This species also contained the highest concentration of phlorotannins in our study. In most of the epiphyte species examined, there was no negative correlation between the epiphyte density and total phlorotannin contents of the basiphyte, thereby suggesting that high amounts of phlorotannins are not necessarily effective against epiphytes (Wikström & Pavia, Citation2004; Honkanen & Jormalainen, Citation2005; Plouguerné et al., Citation2012). This result is supported by our bioassay experiments showing that the attachment and growth of epiphyte spores are inhibited by only an extremely high concentration of phlorotannins (1 g ml−1) (Nakajima et al. Citation2015).
In contrast to quantitative studies of phlorotannins, there have been fewer reports of inter/intraspecific differences in phlorotannin profiles (Ragan & Glombitza, Citation1986; Van Altena & Steinberg, Citation1992; Boettcher & Targett, Citation1993; Nagayama et al., Citation2002, Citation2003; Iken et al., Citation2007; Koivikko et al., Citation2007, Citation2008; Jégou et al., Citation2010). More than 150 phlorotannin compounds are known, ranging from 10 Da to 650 kDa, but the chemical structures have been determined only in low-molecular phenolic compounds (Ragan & Glombitza, Citation1986). In the case of Sargassum, phloroglucinol, diphlorethol and nine derivatives of fuhalol have been identified in S. muticum (Yendo) Fensholt and various derivatives of phloroglucinol, phlorethol and fuhalol were determined in S. spinuligerum Sonder (Ragan & Glombitza, Citation1986; Keusgen & Glombitza, Citation1995; Glombitza et al, Citation1997). In the present qNMR analyses, we compared the height of each signal (i.e. the quantity of each polyphenol molecule) among/within sargassacean species and the similarity of the phlorotannin profiles was visualized using cluster analysis and PCA. Only S. macrocarpus and S. micracanthum had different phlorotannin profiles among the three specimens of the same species. Temporal and spatial variations in phlorotannin contents have frequently been reported (van Alstyne et al., Citation2001; Jormalainen & Honkanen, Citation2008), thus phlorotannin profiles may be affected by environmental conditions. Alternatively, this intraspecific variation in the phlorotannin profiles may represent genetic differences (Koivikko et al., Citation2008).
The qNMR analyses determined differences in the phlorotannin components of the sargassacean species, which were categorized into four major groups. Interestingly, the abundance of Neosiphonia harveyi was higher on the basiphyte species belonging to group A, i.e. S. hemiphyllum (1.056 thalli cm−2), S. patens (0.500 thalli cm−2) and S. piluliferum (0.749 thalli cm−2), than other basiphyte species (0.002‒0.279 thalli cm−2). These results may support our hypotheses that not all of the specific phlorotannin components (or combinations thereof) are effective (or ineffective) in antifouling, and that differences in the phlorotannin profiles affect the variation and abundance of epiphytes. The different antifouling effect of phlorotannin components may affect the total number of epiphyte species on the basiphyte species examined in this study. In other words, some epiphyte species were abundant or scarce on particular basiphyte species because the antifouling capacity of basiphyte species may be directed against particular epiphyte species. The abundance of Neosiphonia harveyi is remarkably lower on S. siliquastrum than on other basiphytes (Yamamoto et al., Citation2013; this study), but the phlorotannin profile of S. siliquastrum is similar to that of N. harveyi-rich species, e.g. S. hemiphyllum, S. patens and S. piluliferum (this study), thereby suggesting that phlorotannins may not be the main factor involved in the exclusion of this epiphyte from S. siliquastrum (Nakajima et al., Citation2015).
We expected that the phlorotannin profiles would be similar among closely related species, but this hypothesis was not supported. For example, the phlorotannin profile of S. horneri shared more similarity with that of M. myagroides than other Sargassum species, although they belonged to different genera. In addition, S. hemiphyllum (subgenus Bactrophycus) formed a cluster with S. patens and S. piluliferum (subgenus Sargassum). Some secondary metabolites such as terpenoids are useful for species identification or for speciation analysis (e.g. Amico, Citation1995; Abe et al., Citation1999) and more detailed analyses, including the identification of each polyphenolic compound, would be required to assess the chemotaxonomic utility of phlorotannin profiles (Jégou et al. Citation2010).
In conclusion, our qNMR analyses elucidated the diversity of phlorotannin components, which may be related to the variation and abundance of epiphytes. The phlorotannin analyses performed in the present study may provide greater insights into the ecological functions of phlorotannins than total phlorotannin content measurements. Variation in antifouling effect appeared to be related to the phlorotannin profiles, but this cannot be confirmed without a more detailed knowledge of the chemical structures of phlorotannins and their functions as antifouling allelochemicals. Brown algae exude phlorotannins into the surrounding seawater (Sieburth & Jensen, Citation1969; Ragan & Jensen, Citation1979; Carlson & Carlson Citation1984; Jennings & Steinberg, Citation1994), and the component of phlorotannins around the thallus, which are possibly different from that within the thallus, may be more important for deterring the settlement of epiphytes. It is also necessary to examine hydrophobic compounds that may be effective in deterring the settlement of epiphytes (Hellio et al., Citation2002; Ganti et al., Citation2006; Bazes et al., Citation2009).
SUPPLEMENTARY INFORMATION
The following supplementary material is accessible via the Supplementary Content tab on the article’s online page at http://dx.doi.org/10.1080/09670262.2016.1159340
Supplementary Fig. 1. Spectra of the low qNMR data which are not shown in .
Supplementary Fig S1
Download TIFF Image (5.3 MB)ACKNOWLEDGEMENTS
The authors would like to acknowledge the staff of the Fukui Prefectural Kaihin Shizen Center and Ohshima Fisheries Cooperative Association for supporting sampling. We thank S. Yoshikawa for his valuable suggestion and T. Ooura in the Fukui Prefectural Food Processing Research Institute for his support in freeze-drying samples.
DISCLOSURE STATEMENT
No potential conflict of interest was reported by the author(s).
Additional information
Funding
Notes on contributors
Noboru Nakajima
N. Nakajima: sampling, data collection and analyses; N. Sugimoto: qNMR analyses; K. Ohki: implementation, editing manuscript; M. Kamiya: original concept, writing of manuscript.
Naoki Sugimoto
N. Nakajima: sampling, data collection and analyses; N. Sugimoto: qNMR analyses; K. Ohki: implementation, editing manuscript; M. Kamiya: original concept, writing of manuscript.
Kaori Ohki
N. Nakajima: sampling, data collection and analyses; N. Sugimoto: qNMR analyses; K. Ohki: implementation, editing manuscript; M. Kamiya: original concept, writing of manuscript.
Mitsunobu Kamiya
N. Nakajima: sampling, data collection and analyses; N. Sugimoto: qNMR analyses; K. Ohki: implementation, editing manuscript; M. Kamiya: original concept, writing of manuscript.
Related Research Data
REFERENCES
- Abe, T., Masuda, M., Suzuki, T. & Suzuki, M. (1999). Chemical races in the red alga Laurencia nipponica (Rhodomelaceae, Ceramiales). Phycological Research, 47: 87–95.
- Aguilar-Rosas, R. & Galindo, A.M. (1990). Ecological aspects of Sargassum muticum (Fucales, Phaeophyta) in Baja California, Mexico: reproductive phenology and epiphytes. Hydrobiologia, 204/205: 185–190.
- Amico, V. (1995). Marine brown algae of family Cystoseiraceae – chemistry and chemotaxonomy. Phytochemistry, 39: 1257–1279.
- Amsler, C. & Fairhead, V. (2006). Defensive and sensory chemical ecology of brown algae. In Advances in Botanical Research, vol. 43 (Callow, J.A., editor), 1–91. Elsevier, Amsterdam.
- Ank, G., da Gama, B. & Pereira, R. (2013). Polyphenols from Stypopodium zonale (Phaeophyceae): intrapopulational variation, induction by simulated herbivory, and epibiosis effects. Aquatic Botany, 111: 125–129.
- Bazes, A., Silkina, A., Douzenel, P., Faÿ, F., Kervarec, N., Morin, D., Berge, J.P. & Bourgougnon, N. (2009). Investigation of the antifouling constituents from the brown alga Sargassum muticum (Yendo) Fensholt. Journal of Applied Phycology, 21: 395–403.
- Berger, R., Henriksson, E., Kautsky, L. & Malm, T. (2003). Effects of filamentous algae and deposited matter on the survival of Fucus vesiculosus L. germlings in the Baltic Sea. Aquatic Ecology, 37: 1–11.
- Bhadury, P. & Wright, P. (2004). Exploitation of marine algae: biogenic compounds for potential antifouling applications. Planta, 219: 561–578.
- Boettcher, A. & Targett, N. (1993). Role of polyphenolic molecular-size in reduction of assimilation efficiency in Xiphister mucosus. Ecology, 74: 891–903.
- Buschmann, A. & Gómez, P. (1993). Interaction mechanisms between Gracilaria chilensis (Rhodophyta) and epiphytes. Hydrobiologia, 261: 345–351.
- Carlson, D.J. & Carlson, M.L. (1984). Reassessment of exudation by fucoid macroalgae. Limnology and Oceanography, 29: 1077‒1087.
- Cho, J., Kwon, E., Choi, J., Hong, S., Shin, H. & Hong, Y. (2001). Antifouling activity of seaweed extracts on the green alga Enteromorpha prolifera and the mussel Mytilus edulis. Journal of Applied Phycology, 13: 117–125.
- Everette, J.D., Bryant, Q.M., Green, A.M., Abbey, Y.A., Wangila, G.W. & Walker, R.B. (2010). Thorough study of reactivity of various compound classes toward the Folin−Ciocalteu reagent. Journal of Agricultural and Food Chemistry, 58: 8139–8144.
- Filion-Myklebust, C.C. & Norton, T.A. (1981). Epidermis shedding in the brown seaweed Ascophyllum nodosum (L.) Le Jolis. Marine Biology Letters, 2: 45–51.
- Fuse, S. (1962). The animal community in the Sargassum belt. Physiology and Ecology, Kyoto University, 11: 23–45. [In Japanese with English abstract]
- Ganti, V. S., Kim, K.H., Bhattarai, H.D. & Shin, H.W. (2006). Isolation and characterisation of some antifouling agents from the brown alga Sargassum confusum. Journal of Asian Natural Products Research, 8: 309–315.
- Garbary, D.J., Lawson, G., Clement, K. & Galway, M.E. (2009). Cell division in the absence of mitosis: the unusual case of the fucoid Ascophyllum nodosum (L.) Le Jolis (Phaeophyceae). Algae, 24: 239–248.
- Glombitza, K.W., Hauperich, S. & Keusgen, M. (1997). Phlorotannins from the brown algae Cystophora torulosa and Sargassum spinuligerum. Natural Toxins, 5: 58–63.
- Guiry, M.D. & Guiry, G.M. (2015). AlgaeBase. World-wide electronic publication, National University of Ireland, Galway. http://www.algaebase.org; retrieved on 12 March 2015.
- Hellio, C., Berge, J.P., Beaupoil, C., Le Gal, Y. & Bourgougnon, N. (2002). Screening of marine algal extracts for anti-settlement activities against microalgae and macroalgae. Biofouling, 18: 205–215.
- Honkanen, T. & Jormalainen, V. (2005). Genotypic variation in tolerance and resistance to fouling in the brown alga Fucus vesiculosus. Oecologia, 144: 196–205.
- Ikawa, M., Schaper, T.D., Dollard, C.A. & Sasner, J.J. (2003). Utilization of Folin-Ciocalteu phenol reagent for the detection of certain nitrogen compounds. Journal of Agricultural and Food Chemistry, 51: 1811–1815.
- Iken, K., Amsler, C., Hubbard, J., McClintock, J. & Baker, B. (2007). Allocation patterns of phlorotannins in Antarctic brown algae. Phycologia, 46: 386–395.
- Jégou, C., Culioli, G., Kervarec, N., Simon, G. & Stiger-Pouvreau, V. (2010). LC/ESI-MSn and 1H HR-MAS NMR analytical methods as useful taxonomical tools within the genus Cystoseira C. Agardh (Fucales; Phaeophyceae). Talanta, 83: 613–622.
- Jégou, C., Kervarec, N., Cérantola, S., Bihannic, I. & Stiger-Pouvreau, V. (2015). NMR use to quantify phlorotannins: the case of Cystoseira tamariscifolia, a phloroglucinol-producing brown macroalga in Brittany (France). Talanta, 135: 1–6.
- Jennings, J.G. & Steinberg, P.D. (1994). In situ exudation of phlorotannins by the sublittoral kelp Ecklonia radiata. Marine Biology, 121: 349‒354.
- Jennings, J. & Steinberg, P. (1997). Phlorotannins versus other factors affecting epiphyte abundance on the kelp Ecklonia radiata. Oecologia, 109: 461–473.
- Johnson, C.R. & Mann, K.H. (1986). The importance of plant defense abilities to the structure of subtidal seaweed communities: the kelp Laminaria longicruris de la Pylaie survives grazing by the snail Lacuna vincta (Montagu) at high population densities. Journal of Experimental Marine Biology and Ecology, 97: 231–67.
- Jormalainen, V. & Honkanen, T. (2008). Macroalgal chemical defenses and their roles in structuring temperate marine communities. In Algal Chemical Ecology (Amsler, C.D., editor), 57–89. Springer, Berlin.
- Jormalainen, V., Wikstrom, S. & Honkanen, T. (2008). Fouling mediates grazing: intertwining of resistances to multiple enemies in the brown alga Fucus vesiculosus. Oecologia, 155: 559–569.
- Kamiya, M., Nishio, T., Yokoyama, A., Yatsuya, K., Nishigaki, T., Yoshikawa, S. & Ohki, K. (2010). Seasonal variation of phlorotannin in sargassacean species from the coast of the Sea of Japan. Phycological Research, 58: 53–61.
- Keusgen, M. & Glombitza, K.W. (1995). Phlorethols, fuhalols and their derivatives from the brown alga Sargassum spinuligerum. Phytochemistry, 38: 975–985.
- Koivikko, R., Loponen, J., Pihlaja, K. & Jormalainen, V. (2007). High-performance liquid chromatographic analysis of phlorotannins from the brown alga Fucus vesiculosus. Phytochemical Analysis, 18: 326–332.
- Koivikko, R., Eranen, J., Loponen, J. & Jormalainen, V. (2008). Variation of phlorotannins among three populations of Fucus vesiculosus as revealed by HPLC and colorimetric quantification. Journal of Chemical Ecology, 34: 57–64.
- Lau, S. & Qian, P. (2000). Inhibitory effect of phenolic compounds and marine bacteria on larval settlement of the barnacle Balanus amphitrite amphitrite Darwin. Biofouling, 16: 47–58.
- Lepoint, G., Jacquemart, J., Bouquegneau, J., Demoulin, V. & Gobert, S. (2007). Field measurements of inorganic nitrogen uptake by epiflora components of the seagrass Posidonia oceanica (Monocotyledons, Posidoniaceae). Journal of Phycology, 43: 208–218.
- Levin, P.S. & Mathieson, A.C. (1991). Variation in a host-epiphyte relationship along a wave exposure gradient. Marine Ecology Progress Series, 77: 271–278.
- Li, D., Chen, L., Xu, D., Zhang, X., Ye, N., Chen, F. & Chen, S. (2012). Preparation and characteristics of bio-oil from the marine brown alga Sargassum patens C. Agardh. Bioresource Technology, 104: 737–742.
- Littler, M. & Littler, D. (1999). Blade abandonment/proliferation: a novel mechanism for rapid epiphyte control in marine macrophytes. Ecology, 80: 1736–1746.
- Maceiras, R., Cancela, A., Urréjola, S. & Sánchez, A. (2011). Macroalgae: raw material for biodiesel production. Applied Energy, 88: 3318–3323.
- Nagayama, K., Iwamura, Y., Shibata, T., Hirayama, I. & Nakamura, T. (2002). Bactericidal activity of phlorotannins from the brown alga Ecklonia kurome. Journal of Antimicrobial Chemotherapy, 50: 889–893.
- Nagayama, K., Shibata, T., Fujimoto, K., Honjo, T. & Nakamura, T. (2003). Algicidal effect of phlorotannins from the brown alga Ecklonia kurome on red tide microalgae. Aquaculture, 218: 601–611.
- Nakai, M., Kageyama, N., Nakahara, K. & Miki, W. (2006). Phlorotannins as radical scavengers from the extract of Sargassum ringgoldianum. Marine Biotechnology, 8: 409–414.
- Nakajima, N., Ohki, K. & Kamiya, M. (2015). Defense mechanisms of sargassacean species against the epiphytic red alga Neosiphonia harveyi. Journal of Phycology, 51: 695–705.
- Nylund, G. & Pavia, H. (2005). Chemical versus mechanical inhibition of fouling in the red alga Dilsea carnosa. Marine Ecology Progress Series, 299: 111–121.
- Ohtsuki, T., Sato, K., Abe, Y., Sugimoto, N. & Akiyama, H. (2014). Quantification of acesulfame potassium in processed foods by quantitative 1H NMR. Talanta, 131: 712–718.
- Parys, S., Rosenbaum, A., Kehraus, S., Reher, G., Glombitza, K-W. & König, G.M. (2007). Evaluation of quantitative methods for the determination of polyphenols in algal extracts. Journal of Natural Products, 70: 1865–1870.
- Parys, S., Kehraus, S., Pete, R., Küpper, F.C., Glombitza, K-W. & König, G.M. (2009). Seasonal variation of polyphenolics in Ascophyllum nodosum (Phaeophyceae) European Journal of Phycology, 44: 331–337.
- Plouguerné, E., Cesconetto, C., Cruz, C., Pereira, R. & da Gama, B. (2012). Within-thallus variation in polyphenolic content and antifouling activity in Sargassum vulgare. Journal of Applied Phycology, 24: 1629–1635.
- Ragan, M.A. & Jensen, A. (1979). Quantitative studies on brown algal phenols. III. Light-mediated exudation of polyphenols from Ascophyllum nodosum (L.) Le Jol. Journal of Experimental Marine Biology and Ecology, 36: 91‒101.
- Ragan, M.A. & Glombitza, K. (1986). Phlorotannins, brown algal polyphenols. In Progress in Phycological Research, volume 4 (Round, F.E. & Chapman, D.J., editors), 177–241. Biopress Ltd, Bristol.
- Rönnberg, O. & Ruokolahti, C. (1986). Seasonal variation of algal epiphytes and phenolic content of Fucus vesiculosus in a northern Baltic archipelago. Annales Botanici Fennici, 23: 317–323.
- Russell, B., Elsdon, T., Gillanders, B. & Connell, S. (2005). Nutrients increase epiphyte loads: broad-scale observations and an experimental assessment. Marine Biology, 147: 551–558.
- Sieburth, J.M. & Conover, J.T. (1965). Sargassum tannin, an antibiotic which retards fouling. Nature, 208: 52–53.
- Sieburth, J.M. & Jensen, A. (1969). Studies on algal substances in the sea. II. The formation of Gelbstoff (humic material) by exudates of Phaeophyta. Journal of Experimental Marine Biology and Ecology, 3: 275‒289.
- Singleton, V.L., Orthofer, R. & Lamuela-Raventós, R.M. (1999). Analysis of total phenols and other oxidation substrates and antioxidants by means of Folin-Ciocalteu reagent. Methods in Enzymology, 299: 152–178.
- Stern, J.L., Hagerman, A.E., Steinberg, P.D. & Mason, P. K. (1996). Phlorotannin-protein interactions. Journal of Chemical Ecology, 22: 1877–1899.
- Stewart, J.G. (1982). Anchor species epiphytes in intertidal algal turf. Pacific Science, 36: 45–59.
- Targett, N.M. & Arnold, T.M. (2001). Effects of secondary metabolites on digestion in marine herbivores. In Marine Chemical Ecology (McClintock, J.B. & Baker, B.J., editors), 391–411. CRC, Boca Raton, FL.
- Tokida, J. (1960). Marine algae epiphytic on Laminariales plants. Bulletin of Fisheries Sciences, Hokkaido University, 11: 73–105.
- Tugwell, S. & Branch, G.M. (1989). Differential polyphenolic distribution among tissues in the kelps Ecklonia maxima, Laminaria pallida and Macrocystis angustifolia in relation to plant-defense theory. Journal of Experimental Marine Biology and Ecology, 129: 219–30.
- Van Alstyne, K.L. (1995). A comparison of three methods for quantifying brown algal polyphenolic compounds. Journal of Chemical Ecology, 21: 45–58.
- Van Alstyne, K.L., Dethier, M.N. & Duggins, D.O. (2001). Spatial patterns in macroalgal chemical defenses. In Marine Chemical Ecology (McClintock, J.B. & Baker, B.J., editors), 301–324. CRC, Boca Raton, FL.
- Van Altena, I.A. & Steinberg, P.D. (1992). Are differences in the responses between North American and Australasian marine herbivores to phlorotannins due to differences in phlorotannin structure? Biochemical Systematics and Ecology, 20: 493–499.
- Wikström, S. & Pavia, H. (2004). Chemical settlement inhibition versus post-settlement mortality as an explanation for differential fouling of two congeneric seaweeds. Oecologia, 138: 223–230.
- Yamamoto, K. 2003. LIA for Win32 (LIA32) ver. 0.376β1. Graduate school of Bioagricultural Science, School of Agricultural Science, Nagoya University, Nagoya [updated: 24 December 2004; cited: 5 March 2015]. Available from: http://www.agr.nagoya-u.ac.jp/~shinkan/LIA32/index-e.html.
- Yamamoto, K., Yoshikawa, S., Ohki, K. & Kamiya, M. (2012). Unique distribution of epiphytic Neosiphonia harveyi (Rhodomelaceae, Rhodophyta) along sargassacean hosts. Phycological Research, 60: 70–75.
- Yamamoto, K., Endo, H., Yoshikawa, S., Ohki, K. & Kamiya, M. (2013). Various defense ability of four sargassacean algae against the red algal epiphyte Neosiphonia harveyi in Wakasa Bay, Japan. Aquatic Botany, 105: 11–17.
- Yotsui, T. (1980). Studies on the life cycle and artificial propagation of a brown alga, Nemacystus decipiens (Phaeophyceae, Chordariales). Special Report of Nagasaki Prefectural Institute of Fisheries, 7: 1–48. [ In Japanese with English abstract]