
ABSTRACT
The cyanobacterial genus Arthrospira Stizenberger ex Gomont 1892 includes some of the most commercially significant microalgae, commonly known under the taxonomically incorrect brand name ‘Spirulina’. However, the infrageneric classification of the genus is still undefined. Herein, the classification of two Arthrospira strains (Nigrita M1 and Nigrita C1) from a commercial culture installation was studied and a polyphasic meta-analysis approach to a representative number (> 30) of strains was applied, in an attempt to determine the taxonomic relationships among the existing Arthrospira strains. The combined analysis of molecular (16S rRNA, 16S-23S rRNA ITS and cpcBA-IGS sequences) and phenotypic (13 morphological and morphometric characters) data of the studied Arthrospira strains divided them into three clusters/taxa. The main two taxa, namely Taxon I and Taxon II, include planktonic representatives, with irregular and regular helical structure of the filament, respectively. In contrast, Taxon III comprises the benthic representatives of the genus. Arthrospira strains Nigrita M1 and Nigrita C1 fall into Taxon I and II, respectively. The combined phenotypic and phylogenetic analysis suggests classification of Arthrospira strains into three taxa as subspecies of a single species within the genus Arthrospira.
Introduction
The cyanobacterial genus Arthrospira Stizenberger ex Gomont Citation1892 contains at present 23 species, along with 12 infraspecific taxa (Guiry & Guiry, Citation2018), and includes some of the most commercially significant microalgae, commonly known under the taxonomically incorrect brand name ‘Spirulina’. The infrageneric classification of the genus Arthrospira is still enigmatic (Komárek & Lund, Citation1990; Komárek, Citation2002; Sili et al., Citation2012; Komárek et al., Citation2014), notably when a solely morphological approach is applied. The repeated records of the occurrence of linear or almost linear filaments, especially under artificial laboratory and mass cultivation conditions (Lindblom, Citation1972; Ballot et al., Citation2004; Wang & Zhao, Citation2005; Wu et al., Citation2005; Mühling et al., Citation2006; Sena et al., Citation2011), highlight the inadequacy of the existing morphological and morphometric markers to effectively capture the remarkable morphological plasticity of Arthrospira species (Mühling et al., Citation2006; Mussagy et al., Citation2006; Dadheech et al., Citation2010). However, this is only the tip of the iceberg since several growth conditions such as temperature, light source and intensity, salinity, alkalinity, turbulence and nutrient availability could drastically affect a range of morphological and morphometric features, such as filament length, spiral width, helix pitch, tightness of coils, abundance of aerotopes and helix orientation (Jeeji Bai & Seshadri, Citation1980; Kebede, Citation1997; Mühling et al., Citation2003; Wu et al., Citation2005; Ma & Gao, Citation2009; Giordanino et al., Citation2011; Pfeifer, Citation2012; Kaggwa et al., Citation2013).
Mühling et al. (Citation2006) were the first to establish a phenotypic database of Arthrospira strains in order to apply the numerical analysis ‘phenetic evaluation’, which, although frequently used as a classification tool in other prokaryotes (On & Holmes, Citation1995; Rosselló-Mora & Amann, Citation2001), has only rarely been employed in the taxonomy of cyanobacteria (Kirkby & Whitton, Citation1976; McGuire, Citation1984). The extended coverage of morphological features, the large number of strains (37) included, the record of the cultivation parameters and the linkage with molecular data provided by Scheldeman et al. (Citation1999) and Baurain et al. (Citation2002), render this database essential for establishing a comparative taxonomic examination of Arthrospira strains. However, since the morphological features may be marginally, or occasionally significantly modified through an alternation of the cultivation conditions, phenotypic analysis should always be only a part of a taxonomic approach, and be accompanied by the more reliable molecular markers which constitute the base of the modern approach in cyanobacterial taxonomy (Komárek, Citation2016a).
During recent decades, phylogenetic studies have been frequently employed in the taxonomy of Arthrospira representatives, including 16S rRNA (Nelissen et al., Citation1994; Viti et al., Citation1997; Li et al., Citation2001; Ballot et al., Citation2004; Choi et al., Citation2012), 16S-23S rRNA ITS (Scheldeman et al., Citation1999; Baurain et al., Citation2002; Ballot et al., Citation2004; Dadheech et al., Citation2010; Comte et al., Citation2013; Krienitz et al., Citation2013), cpcBA-IGS (Manen & Falquet, Citation2002; Ballot et al., Citation2004; Dadheech et al., Citation2010; Choi et al., Citation2012) and other regions of the genome (Miklaszewska et al., Citation2012; Zhou et al., Citation2013). Depending on the locus, the purpose of the study, the phylogenetic techniques used and the length of sequences, but mainly on the strains included, the results of those studies have varied significantly. Nevertheless, several studies on Arthrospira isolates indicate the existence of two main phylogenetic clusters (I and II) based on 16S-23S ITS rRNA and/or cpcBA-IGS loci (Scheldeman et al., Citation1999; Baurain et al., Citation2002; Manen & Falquet, Citation2002; Dadheech et al., Citation2010); recently Comte et al. (Citation2013) identified a third cluster (cluster III) based on the mosaic structure of 16S-23S ITS rRNA.
The proper characterization of species and strains is of vital importance, especially when they are to be used for food and feed. It is well documented (e.g. Mata et al., Citation2010) that different species, and strains within a species, may or may not produce a certain substance, or produce it in varying amounts. This is especially relevant for cyanobacteria, which include many toxin-producing species (and thus they could pose a potential hazard for human consumption), but the toxicity is strain-specific rather than species-specific (see Sivonen & Jones, Citation1999). As Nunnery et al. (Citation2010) stress, ‘almost every new strain has its own unique complement of secondary metabolites’. For algal technology, understanding microalgal biodiversity via thorough taxonomic identification and complete characterization can underpin the proper use of algae to optimize biomass production and carry out comparative studies. The present study aims to provide (a) taxonomic classification of two Arthrospira strains from a commercial culture installation in Greece, for which no information was available, using a polyphasic approach and (b) an extensive meta-analysis of the available morphological and molecular data, in order to shed light on the taxonomic status of some Arthrospira species.
Materials and methods
Organisms and culture conditions
Two Arthrospira strains, labelled as Arthrospira sp. Nigrita M1 and Arthrospira sp. Nigrita C1, were provided by the oldest Greek Spirulina plant located in Nigrita (N. Greece). These two strains are exclusively cultivated and their dried biomass (1–2 tn annually) is used to produce whole-cell ‘Spirulina’ supplements for human consumption. In the plant, strain cultivation occurs in greenhouse constructions, in typical raceway ponds, heated by utilizing the geothermal energy of the region (Fournadzieva et al., Citation2002). Under laboratory conditions, Arthrospira strains were maintained as monospecific cultures growing in a slightly modified Zarrouk medium (Zarrouk, Citation1966) at 30°C with a photon flux density of 25 μmol photons m2 s−1 under a 12:12-h light:dark photoperiod; Zarrouk medium modification refers to the trace minerals replacement with those of BG11 medium (Rippka, Citation1988). The isolates were deposited in Aristotle University of Thessaloniki Microalgae and Cyanobacteria Collection (TAU-MAC) (Gkelis & Panou, Citation2016) and can be accessed at http://cyanobacteria.myspecies.info/.
Phenotypic analysis
A total of 13 morphological and morphometric characters, pc1 to pc13 () were analysed using a Zeiss Imager Z.2 light microscope equipped with a digital camera (AxionCam MRc5). ImageJ 1.47 software (Schindelin et al., Citation2015) was used for the morphometric measurements. The pc1 to pc9 and pc10 to pc13 consists of the characters 1 to 9 and 11 to 14, respectively, as they are presented in Mühling (Citation2000) and Mühling et al. (Citation2006). All characters were determined by examining 50 individual filaments or cells during their logarithmic growth phase. Owing to the remarkable morphological plasticity of Arthrospira representatives, the cultivation conditions, and the growth phase, i.e. stage at which the morphological observations took place, were set to be in agreement with those followed by Mühling (Mühling, Citation2000; Mühling et al., Citation2006); thus, an accurate comparison among all Arthrospira strains included in the phenotypic analysis was achieved.
Table 1. Character states delimitation of the morphological and morphometric characters included in the phenotypic analysis (according to Mühling et al., Citation2006).
For the numerical analysis, the observation or the average value of each morphometric character was converted into a binary system, in accordance with the delimitation of character state presented in Mühling (Citation2000) and Mühling et al. (Citation2006) (). For all strains used (Arthrospira sp. Nigrita M1, Arthrospira sp. Nigrita C1 and another 37 Arthrospira strains from the Durham collection; Mühling, Citation2000; Mühling et al., Citation2006), the resulting dyadic codes were used for calculation of the phenotypic dissimilarity between Arthrospira strains, by applying the Euclidean distance algorithm to create a calculation matrix. Hierarchical Cluster Analysis and non-Metric Multidimensional Analysis (nMDS) (Clarke, Citation1993) were performed on the derived matrix of dissimilarities, by applying the group average linkage algorithm and the loss function Kruskal stress formula 1 (Kruskal & Wish, Citation1978), respectively. Clustering consistency of the derived dendrogram and nMDS plot was evaluated through the cophenetic correlation coefficient (ccc), which represents a measure of the degree of adjustment of a categorization to a data-set as well as a benchmark for the evaluation of the efficiency of the clustering technique applied (Sneath & Sokal, Citation1962) and stress value (Kruskal & Wish, Citation1978), respectively. The significance between the a priori defined clusters was tested by performing one-way Analysis of Similarity (ANOSIM) (Clarke & Green, Citation1988; Clarke et al., Citation2008) with 999 permutations. SIMPER analysis was performed for the assessment of each character contribution to the clusters’ formation. Non-parametric multivariate analyses (Clarke, Citation1993) were carried out using the Primer v7.0 software package (Primer-E Ltd, Plymouth, UK).
Phylogenetic analysis
Genomic DNA extracts of live Arthrospira cells were obtained by applying the universal DNA extraction protocol for Gram-negative bacteria provided by Atashpaz et al. (Citation2010). PCR was carried out on the DNA extracts using the following primer pairs Cya106F (CGGACGGGTGAGTAACGCGTGA) (Nübel et al., Citation1997) and 23S30R (CTTCGCCTCTGTGTGCCTAGGT) (Lépere et al., Citation2000) for the amplification region of 16SrRNA and 16S-23S rRNA-ITS. The PCR mixture consisted of: 1× PCR buffer, 2.5 mM MgCl2, 0.2 mM of each dNTP, 0.4 μM of each primer, 2 U of Taq DNA polymerase and 50–100 ng of genomic DNA in a total volume of 50 μl. The PCR conditions were: denaturation for 4 min at 94°C, followed by 35 cycles of amplification for 30 s at 94°C, 45 s at 59°C and 2 min at 72°C followed by a final elongation step of 4 min at 72°C. For the amplification of cpcBA-IGS region the primers PCβF (GGCTGCTTGTTTACGCGACA) (Neilan et al., Citation1995) and PCαR_mod (CCAGTTCCACCAGCAATCAG) (Manen & Falquet, Citation2002) were used. The PCR mixture consisted of: 1× PCR buffer, 2 mM MgCl2, 0.2 mM of each dNTP, 0.7 μM of each primer and 1.5 U of Taq DNA polymerase and 50–100 ng of genomic DNA. The PCR conditions were set according to Neilan et al. (Citation1995), except for the annealing temperature (51.5°C). Thermal cycling was carried out using an Eppendorf Master Cycler Pro (Eppendorf, UK). PCR products were visualized by 1.5% (w/v) agarose gel electrophoresis in 1× TAE buffer and Midori Green Advanced DNA staining under UV transillumination. Nucleospin Gel and PCR-clean up kit (Macherey-Nagel, Germany) was used for the purification of PCR products. The sequencing of the amplified DNA fragments was performed by using the same primers as for the PCR amplification (and internal sequencing primers were necessary) in an ABI3730 xl Genetic Analyzer (Applied Biosystems, Life Technologies, USA) automatic DNA sequencer (Cemia, Greece) and by using the BigDye Terminator v3.1 cycle sequencing kit (Life Technologies, USA). The obtained sequencing data were further analysed and manipulated with BioEdit software (Hall, Citation2011). In order to identify the position of 16S rRNA sequences’ termination codon and the starting site of the 16S-23S rRNA ITS, our sequences were aligned with the Arthrospira sp. PCC 8005 whole genome sequence (NZ_F0818640.1). The starting position of the present study’s Arthrospira strains’ 16S-23S rRNA ITS sequences corresponds to the fifth nucleotide base of the Baurain et al. (Citation2002) Arthrospira strains’ 16S-23S rRNA ITS sequences. A total of 31, 46 and 31 16S rRNA, 16S-23S rRNA ITS and cpcBA-IGS Arthrospira sequences, respectively (Supplementary table S1), available in GenBank, and those obtained in the present study (accession numbers: KU605609, KU605610, KU588154, KU588155) were included in the phylogenetic analysis of each locus. Multiple sequence alignment and phylogenetic tree construction of each locus were carried out using the MEGA software (Tamura et al., Citation2013); sequences were aligned using the Muscle algorithm (Edgar, Citation2004). A phylogenetic tree for each locus was constructed by applying the Maximum Likelihood method (Felsenstein, Citation1981) with the distance matrix to be computed using the Jukes and Cantor correction (Jukes & Cantor, Citation1969) for dissimilarity values. A Bayesian inference (BI) phylogenetic approach was conducted with MrBayes (V3.2.6) software (Ronquist et al., Citation2012). The evolutionary model was determined for each partition by using Modeltest 3.06 (Posada, Citation2003). The Jukes–Cantor model (JC) with gamma distribution of rates and a proportion of invariable sites was selected based on the Akaike and Bayesian Information Criterion (AIC and BIC). Bayesian analysis consisted of two independent Markov Chain Monte Carlo runs, performed by four differentially heated chains of 10 × 106 generations and trees were sampled from the chain every 1000 generations. All phylogenetic trees were visualized via the FigTree (V1.4.3) software (Rambaut, Citation2018). Bootstrap analysis was also performed in a total of 1000 replicates for the ML analysis. The secondary structure of D1-D1’ and box-B helices of the 16S-23S rRNA ITS locus (Iteman et al., Citation2000) were predicted via the Mfold web server (Zuker, Citation2003) with default settings.
Results
Phenotypic Analysis
Arthrospira sp. Nigrita M1 showed an irregular type of trichrome helicity (, ), sporadic presence of capitated apical cells () and organized distribution of aerotopes on either side of cross walls (). Arthrospira sp. Nigrita C1 showed a regular trichome helical morphology (, ), stable ratio of helix dimensions among trichomes (, feature pc10), and a non-organized distribution of aerotopes (). Apical cells of both Arthrospira strains were often surrounded by calyptra (, ). Configurations of straight filaments were observed for both strains during two years of cultivation; their presence in Arthrospira sp. Nigrita C1 cultures was constant (). A high degree of morphological plasticity, greatly influenced by the growth stage and exogenous parameters, such as temperature and light intensity, was observed for both Arthrospira strains (data not shown). The description of the two strains follows, while the main morphological and morphometric characteristics of Arthrospira sp. Nigrita M1 and C1 strains can be retrieved in Supplementary table S1 or as binary codes in .
Figs 1–8. Morphological features of: Figs 1–4. Arthrospira sp. Nigrita M1 and Figs 5–8. Arthrospira sp. Nigrita C1 strains. White and black arrows indicate sheath and aerotopes, respectively.
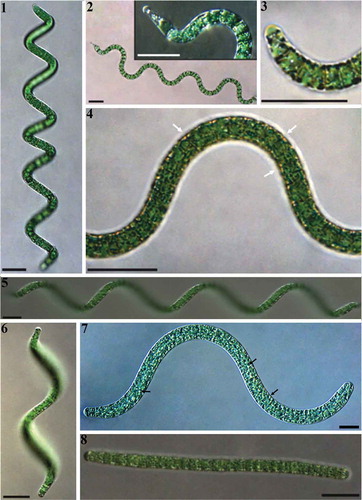
Fig. 9. Binary sequences of 39 Arthrospira strains based on 13 morphological and morphometric characters (pc1–13) (left) and their phenogram (right); ccc value: 0.724. [■] and [●]:strains belonging to the phylogenetic cluster I and II respectively, based on ARDA analysis (Scheldeman et al., 1999) and/or their sequences similarities (Baurain et al., 2002; present study) of the 16S-23S rRNA ITS locus. Strains of the present study are indicated in bold font.
![Fig. 9. Binary sequences of 39 Arthrospira strains based on 13 morphological and morphometric characters (pc1–13) (left) and their phenogram (right); ccc value: 0.724. [■] and [●]:strains belonging to the phylogenetic cluster I and II respectively, based on ARDA analysis (Scheldeman et al., 1999) and/or their sequences similarities (Baurain et al., 2002; present study) of the 16S-23S rRNA ITS locus. Strains of the present study are indicated in bold font.](/cms/asset/f33e577e-e2db-42db-94f7-aebcad3d8b8b/tejp_a_1624832_f0002_oc.jpg)
Arthrospira sp. Nigrita M1
Solitary, green-blue in colour cylindrical trichromes, surrounded by sheath. Aerotopes are present and organized on both sides of the cross-walls. The trichomes exhibit a non-regular relatively loose helical form, rarely in the shape of a dumbbell or barrel. The apical cells are either rounded or bearing a head (capitate), often surrounded by a calyptra (more usually at one end and always in the capitate end cells). The average length of trichomes is 290 μm ± 105 μm, while the average width is 7.3 μm ± 0.9 μm. The dimensions of the formed helices (usually left-handed) exhibit a marked variation between the trichomes, with the average pitch length to helix diameter ratio to be 1.14 ± 0.3.
Arthrospira sp. Nigrita C1
Solitary, oily in colour cylindrical trichomes, usually laterally compressed, surrounded by sheath. The helical shape of the filaments is characterized by a tactically loose structure. The filaments exhibit a pronounced tendency to lose their helical structure, resulting in the presence of trichomes with rectilinear, slightly curled or irregular forms. The apical cells usually exhibit a different morphology; one rounded and the other slightly tapered, more rarely both rounded, often surrounded by a calyptra (more often at one end and lesser in both of them). The average length of trichomes is 190 μm ± 49 μm, while the average width is 7.0 μm ± 0.7 μm. The dimensions of the formed helices (usually left-handed) are characterized as stable between the trichomes, with the average pitch length to helix diameter ratio to be 1.08 ± 0.09. Aerotopes are diffused in the cells with a non-organized distribution.
Hierarchical Cluster Analysis performed upon the resulting matrix of dissimilarities of 39 Arthrospira strains’ phenotypic binary sequences, showed the distinction of Arthrospira strains into two main phenotypic clusters, designated as phenotypic cluster I and phenotypic cluster II (). The ccc value was 0.724, above the 0.7 threshold for achieving accurate phenograms. ANOSIM analysis confirmed the perspicuous separation of Arthrospira strains into the two phenotypic clusters (R = 0.65, p < 0.001). The 3D nMDS plot, with a stress value of 0.12, showed a similar grouping of all Arthrospira strains (Supplementary fig. S1). SIMPER analysis provided the decisive contribution of the helix-defining characters pc8, pc11 and pc10 in the clusters’ formation; their participation in the creation of the phenogram () amounted to 12.76%, 12.39% and 10.21%, respectively (Supplementary table S2). Phenotypic cluster I gathers the majority of Arthospira strains, occurring as filaments with irregular trichome helix (17/19), high degree of variability in helix dimensions ratio among trichomes (17/24) and intensely diminished helices toward trichome ends (15/15). Conversely, the majority of regular-trichome Arthrospira strains (20/20), with relatively stable helix dimensions ratio among trichomes (15/15) and slightly diminished helices toward trichome ends (22/24) are gathered into the phenotypic cluster II (). Arthrospira sp. Nigrita M1 and Arthrospira sp. Nigrita C1 were grouped into phenotypic cluster I and II, respectively, owing to their irregular and regular trichome helicity. Aerotopes were present in all Arthrospira strains.
The meta-analysis performed upon the provided phenotypic data of 37 Arthrospira strains showed a limited contribution of the non-morphological and non-morphometric characters (characters 15–28, as they are denominated by Mühling et al., Citation2006) (Supplementary figs S2, S3); moreover, their inclusion results in a limited credence dendrogram and a low ccc value (Supplementary fig. S2). The implementation of the Euclidean distance, instead of a simple matching coefficient algorithm, resulted in a further increase of the ccc value (Supplementary figs S4, S5). Therefore, only 13 of the 28 phenotypic characters made available by Mühling et al. (Citation2006) were finally included in the present phenotypic analysis, since the meta-analysis performance upon the provided phenotypic data of 37 Arthrospira strains showed a limited contribution of the non-morphological and non-morphometric characters. Moreover, the character referring to the alteration of trichome helix orientation at increased cultivated temperature (character 11 in Mühling et al., Citation2006) was also discounted, as the increased temperature during strain cultivation could affect other characters as well (van Eykelenburg, Citation1979; Mühling et al., Citation2003; Giordanino et al., Citation2011). Euclidean distance, which, due to the origin of the binary codes (0/1), is expressed as the square root of the number of the uncommon rated-characters between two phenotypic sequences, resulted in an almost identical phenogram in terms of the phenotypic clusters’ synthesis as in Mühling et al. (Citation2006) (with the sole exception of one strain’s relocation), but with a high ccc value, enhancing the resulting dendrogram’s robustness.
Phylogenetic analysis
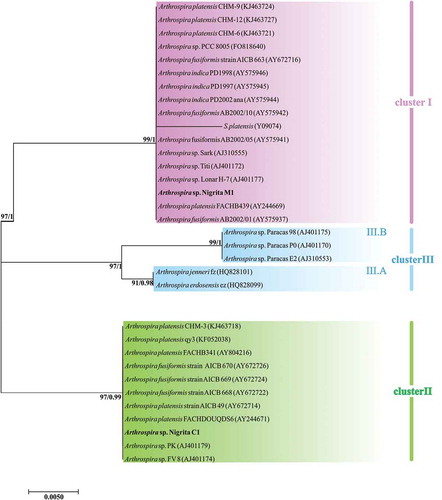
Arthrospira 16S rRNA partial sequences showed an extremely high degree of similarity (≥ 98.8 for invariable and ≥ 99.5 for invariable plus singleton-variable sites). However, the constructed 16S rRNA tree illustrated a grouping of Arthrospira strains into two main clusters, denoted as phylogenetic cluster I and phylogenetic cluster II (). Their formation was dictated by the differentiation of three nucleotide positions in the 16S rRNA sequences (Supplementary fig. S4); hence, the phylogenetic distance between them was notably close. A further grouping inside cluster I was denominated as cluster III, formed by three sequences; those sequences share a unique modulation in four nucleotide positions (Supplementary fig. S4). The 16S-23S rRNA ITS tree revealed a similar pattern to 16S rRNA, by forming two main phylogenetic clusters (I and II) and a subcluster (cluster III), included in the phylogenetic cluster I (). Phylogenetic clusters I and II were further divided into the subclusters I.A, I.B, II.A and II.B (). The secondary structure of D1-D1’ and box-B helices () showed a slight diversification of the phylogenetic relationships among clusters not inferred from the 16S-23S rRNA ITS tree: D1-D1’ helix of Cluster III () showed a structure more similar to Cluster II () than to Cluster I (); the box-B structure of one of the three strains (Arthrospira sp. PCC 9901) grouped into Cluster III () suggested a more similar lineage to cluster II than to cluster I secondary structure, whereas the other two strains showed a secondary structure more similar to cluster I (). The cpcBA-IGS tree showed an alteration of the clusters’ topology by grouping cluster III as a subcluster of cluster II and relocating two strains (Arthrospira sp. FACB 439 and A. platensis CH-3) into different clusters (). Substitutions of clusters III.A and III.B followed a mixed norm, sharing common nucleotides both with cluster I and cluster II as well as the presence of specific nucleotide(s) for each cluster (Supplementary fig S5). Arthrospira sp. Nigrita M1 and Arthrospira sp. Nigrita C1 were grouped into clusters I and II, respectively, in all phylogenetic trees. The calculated percentage of DNA sequence similarities between phylogenetic clusters I, II and III, as well as the total sequence similarity of each locus (), highlight the 16S-23S rRNA ITS locus as the most suitable molecular marker for the taxonomic classification of Arthrospira strains as it has the most informative sites.
Table 2. Calculated percentage DNA sequences similarities between and within phylogenetic clusters based on invariable and invariable plus singleton-variable sites (given in parentheses), respectively, of each locus.
Fig. 10. Phylogenetic tree of Arthrospira strains based on 16S rRNA partial sequences (1290 bp) and reconstructed using the Maximum-likelihood (ML) analysis. Numbers above branches indicate the bootstrap value (as percentages of 1000 replications) for ML method and the posterior probabilities for Bayesian inference method, respectively. Strains of the present study are indicated in bold font.
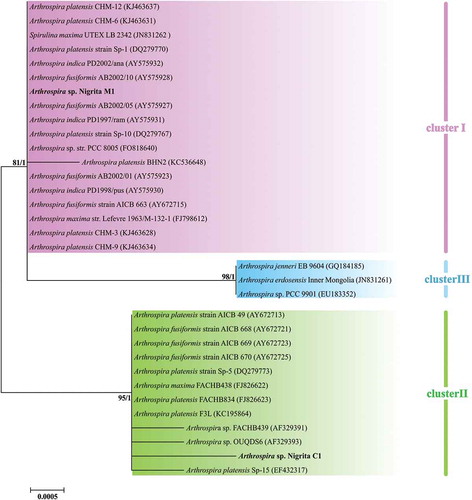
Fig. 11. Phylogenetic tree of Arthrospira strains based on 16S-23S rRNA ITS partial sequences (~440 bp) and reconstructed using the Maximum likelihood (ML) analysis. Numbers above branches indicate the bootstrap value (as percentages of 1000 replications) for ML method and the posterior probabilities for Bayesian inference method, respectively. Strains of the present study are indicated in bold font. *: Strains included in the phenotypic analysis.
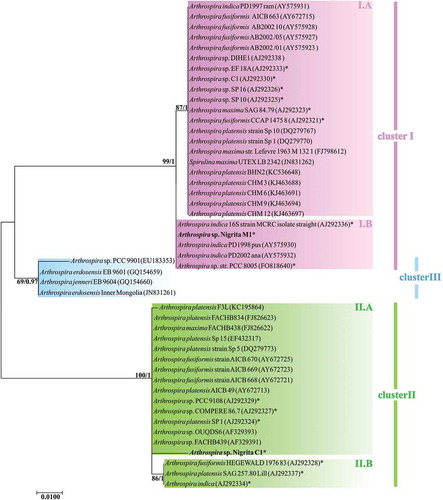
Fig. 12. a–c: secondary structure of D1-D1’ helix of Arthrospira strains belonging to phylogenetic clusters I, II, and III, respectively; d, e, g, j: secondary structure of box-B helix of Arthrospira strains belonging to phylogenetic cluster I, III, II.A and II.B respectively; f & h: secondary structure of box-B of Arthrospira sp. PCC 9901 (enlisted into phylogenetic cluster III) and Arthrospira sp. Nigrita C1 (enlisted into phylogenetic cluster II.A), respectively.
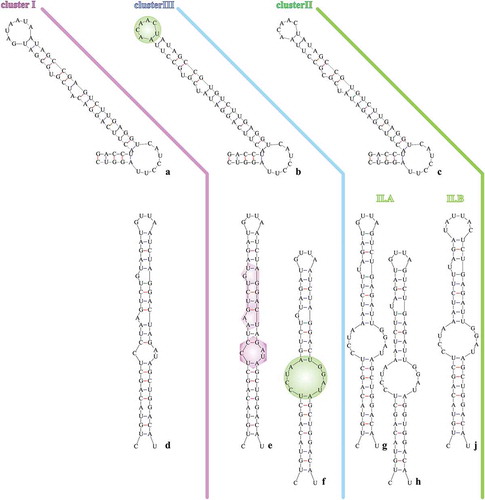
Fig. 13. Phylogenetic tree of Arthrospira strains based on cpcBA-IGS partial sequences (454 bp) and reconstructed using the Maximum likelihood (ML) analysis. Numbers above branches indicate the bootstrap value (as percentages of 1000 replications) for ML method and the posterior probabilities for Bayesian inference method, respectively. Strains of the present study are indicated in bold font.
Polyphasic taxonomy
A high degree of consensus between the results of phenotypic and phylogenetic analyses was observed. The agreement of strain allocation between the phenotypic and phylogenetic clusters (I and II) amounted to 82% (32/39) (), suggesting that the majority of Arthrospira representatives included in the phenotypic clusters I and II are also included into the phylogenetic clusters I and II, respectively. No morphological or morphometric data were available for strains grouped into the phylogenetic cluster III. Consequently, Arthrospira strains are grouped into three taxa as follows:
Taxon I: strains grouped into phenotypic cluster I and phylogenetic cluster I.
Taxon II: strains grouped into phenotypic cluster II and phylogenetic cluster II.
Taxon: III: strains grouped into phylogenetic cluster III.
Discussion
The present study shows that the phenotypic clusters I and II agree with the description of A. fusiformis and A. maxima, respectively, as they were presented in Komárek & Lund (Citation1990) and Komárek & Anagnostidis (Citation2005). Our assessment was principally based on two features: (a) the presence of aerotopes in both species and (b) the almost regular trichome helicity of A. maxima, contrasting with the irregular A. fusiformis; the ability of A. fusiformis to display a wide variation of spirality, intensely diminishing or widening towards the ends, has never been observed in A. maxima (Komárek et al., Citation2014). In contrast, Mühling et al. (Citation2006) suggest that cluster I representatives, also comprising irregular filaments, correspond to the species A. fusiformis, A. indica and A. maxima, while strains included in cluster II, comprising regular filaments, correspond to A. platensis, although with aerotopes. There are two basic arguments against this suggestion: firstly, Mühling et al. (Citation2006) subsumed the representatives of A. maxima into those with irregular, and those with intensely diminishing, helix attenuation toward the apices of cells, in disagreement with Komárek & Lund (Citation1990) and Komárek & Anagnostidis (Citation2005), who mentioned that A. maxima is characterized by slightly diminishing helix attenuation. Secondly, although the loss of aerotopes or a fluctuation of aerotope abundance is frequently observed in a wide range of cyanobacterial cultures (Beard et al., Citation2002; Gkelis et al., Citation2005), to the best of our knowledge the occurrence of aerotopes in a strain without them has never been reported. Thus, A. platensis, which lacks aerotopes could not represent cluster II.
The phenotypic analysis employed in this study provides an accurate and simplified norm for future Arthrospira strains analyses under the same cultivation conditions. In our meta-analysis, even after the expulsion of several characters, the ccc value of the derived phenograms was still relatively low, because of the simple matching coefficient algorithm (Sokal & Michener, Citation1958) commonly used in phenotypic analyses (Rosselló-Mora & Amann, Citation2001).
Our 16S rRNA phylogenetic analysis revealed the formation of three distinct clusters of Arthrospira strains, despite the highly conserved nature of the 16S rRNA region (Wilmotte, Citation1994; Ludwig & Klenk, Citation2001) which is often said to be insufficient for the distinction of infrageneric taxa (Fox et al., Citation1992; Nelissen et al., Citation1994; Clayton et al., Citation1995; Gaunt et al., Citation2001; Krieg, 2005; Han et al., Citation2009), and was in complete agreement with the 16S-23S rRNA ITS tree. However, due to the profusion of variable sites within the 16S-23S rRNA ITS locus (Garcia-Pichel et al., Citation1996; Gurtler & Stanisich, Citation1996; Iteman et al., Citation2000; Boyer et al., Citation2001; Premanandh et al., Citation2006), the distinction of Arthrospira strains was extended into additional modules (subclusters IIA, IIB, IA and IB) based on the variable positions of the ITS already defined by Baurain et al. (Citation2002). Cluster III showed a mosaic-like structure, firstly reported by Comte et al. (Citation2013) who analysed the 16S-23S rRNA ITS sequence of the strain Arthrospira sp. PCC9901. This structure was confirmed in our study, not only in the phylogenetic trees, but also through the similar configuration of the D1-D1’ loop of clusters III and II, in parallel with the similar modulation of box-B helix for the sequences of cluster I and III. The relocation of two Arthrospira strains in different clusters on the cpcBA-IGS tree compared with the other examined loci, in addition to the mixed distribution pattern of the substitutions into cluster III, suggest an exchange of genetic material between strains. This intragenic recombination at the cpcBA-IGS locus which was noted for different genera of cyanobacteria (such as Anabaena, Aphanizomenon, Nodularia and Phormidium) (Janson & Granéli, Citation2002; Teneva et al., Citation2005), including Arthrospira (Manen & Falquet, Citation2002), results in a tree topology of Arthospira strains which does not reflect a true cladogenesis. Thus, for safe inference, its inclusion in phylogenetic studies of cyanobacteria should be accompanied by additional molecular loci (Janson & Granéli, Citation2002). Any linkage of the phylogenetic clusters with geographic origin could not be assessed since the origins of many of the strains are uncertain or unknown. However, the study of Dadheech et al. (Citation2010), which was mainly based on new planktic Arthrospira isolates, suggests a divergent evolution of North American and Africa/India strains, with the former mapping with cluster II and the latter with cluster I representatives (as was found in the present study). Moreover, representatives of cluster III for which the isolation region is given, come from China (Comte et al., Citation2013).
The results obtained through the phenotypic and phylogenetic analyses suggest that Arthrospira consists of three taxa at the subgeneric level: (i) Taxon I, corresponding to A. fusiformis sensu Komárek & Lund (Citation1990) and Komárek & Anagnostidis (Citation2005): includes planktonic representatives with irregular trichome helical structure and high variation of spirality, grouped in phenotypic and phylogenetic cluster I. (ii) Taxon II, corresponding to A. maxima sensu Komárek & Lund (Citation1990) and Komárek & Anagnostidis (Citation2005): planktonic representatives with regularly loose trichome helical structure, grouped in phenotypic and phylogenetic cluster II. (iii) Taxon III, corresponding to the benthic representatives without aerotopes, such as A. jenneri and A. platensis sensu Komárek & Lund (Citation1990) and Komárek & Anagnostidis (Citation2005), grouped in phylogenetic cluster III. In our study, no morphological or morphometric data were available for strains in phylogenetic cluster III. However, their classification in species without aerotopes and with a benthic life-style, such as the type species A. jenneri (Gomont, Citation1892; Komárek & Lund, Citation1990; Komárek, Citation2016b; Komárek & Anagnostidis, Citation2005) suggests that Taxon III consists of benthic strains. Taxon III also includes A. (Spirulina) erdosensis, observed in alkaline lakes in Inner Mongolia (China), which, although an unrevised species, also lacks aerotopes (Komárek & Anagnostidis, Citation2005). Additionally, Arthrospira sp. PCC9901, the only strain included in phylogenetic cluster III for which some morphological data are available (Comte et al., Citation2013), was also recognized as free of aerotopes, further upholding the above-mentioned assumption. As for the limited availability of cluster III strains, their benthic nature is probably the reason, since, according to Komárek (Citation2002), they ‘are not very common and their mats occur only sporadically in higher quantity, while the intense water blooms of planktic species are very distinct in tropical regions’.
The debate about the threshold of species delimitation in terms of 16S rRNA gene similarities is not new; several researchers during the last two decades have provided different thresholds, ranging from 97 to 99% (Stackebrandt & Goebel, Citation1994; Strackebrandt & Ebers, Citation2006; Meier-Kolthoff et al., Citation2013; Kim et al., Citation2014), above which 16S rRNA sequence similarity indicates that strains belong to the same species. Kim et al. (Citation2014), analysing more than 650 bacterial genera, propose a threshold of species delimitation at 98.65% 16S rRNA sequence similarity. In our study, the minimum similarity of strains was above this threshold, suggesting that all strains included in 16S rRNA phylogenetic analysis represent a single species. Nevertheless, the pronounced cluster conformation and the robustness of the derived 16S rRNA tree in our study, enhanced by the additional phylogenetic analyses of 16S-23S rRNA ITS, and cpcBA-IGS, unequivocally divide Arthrospira strains into three taxa. Additionally, Eckert et al. (Citation2015) reported a ‘barcoding gap’ in the 16S rRNA sequences of the genus Arthrospira revealing the existence of three infrageneric Operational Taxonomic Units. Consequently, respecting the threshold of species demarcation, the remarkable morphological plasticity of the strains and the unambiguous conformation of three phylogenetic clusters, we suggest that those clusters should be viewed as subspecies of a single species within the genus Arthrospira. In conclusion, combined phenotypic and phylogenetic analysis, suggests the discrimination of Arthrospira strains into three taxa as subspecies of a single species within the genus Arthrospira:
Taxon I, referring to A. fusiformis and A. indica: consists of planktonic representatives with irregular trichome helical structure and high variation in spirality.
Taxon II, referring to A. maxima: planktonic representatives with regularly loose trichome helical structure.
Taxon III, referring to A. platensis, A. jenneri, A. erdosensis: benthic representatives without aerotopes.
Author contributions
G. Papapanagiotou: investigation, formal analysis (except Bayesian Inference), visualization, data curation, writing – original draft; S. Gkelis: conceptualization, funding acquisition, resources, supervision, formal analysis (Bayesian Inference), validation, writing – review and editing.
Supplementary Information
The following supplementary material is accessible via the Supplementary Content tab on the article’s online page at https://doi.org/10.1080/09670262.2019.1624832
Supplementary table S1. Morphological and morphometric characteristics of Arthrospira sp. Nigrita M1 and C1 strains.
Supplementary table S2. Contribution of key phenotypic characters (as defined in Mühling et al., Citation2006) in phenotypic clusters’ formation.
Supplementary fig. S1. 3d-nMDS plot of 39 Arthrospira strains constructed by applying the loss function Kruskal stress formula 1. Arthrospira sp. Nigrita M1 and Nigrita C1 are given as M1 and C1, respectively, strains of Durham collection are given with their code names. Stress value 0.12.
Supplementary fig. S2. Phenogram of 37 Arthrospira strains (Durham collection) based on 28 characters, build by applying the average group linkage method on the distance matrix of their phenotypic binary sequences, calculated with the simple matching coefficient; ccc value: 0.611. Strains are given with their code names.
Supplementary fig. S3. Phenogram of 37 Arthrospira strains (Durham collection) based on 13 characters, build by applying the average group linkage method on the distance matrix of their phenotypic binary sequences, calculated with the simple matching coefficient; ccc value: 0.642. Strains are given with their code names.
Supplementary fig. S4. Variable and singleton sites of 16S rRNA Arthrospira partial sequences included in the phyologenetic analysis. Numbering of the sites was based on the Arthrospira sp. PCC8005 16S rRNA sequence (NZ_FO818640.1).
Supplementary fig. S5. Variable and singleton sites of cpcBA-IGS Arthrospira partial sequences included in the phylogenetic analysis. Numbering of the sites was based on the Arthrospira sp. PCC8005 cpcBA-IGS sequence (NZ_FO818640.1).
Supplementary fig. S6. Variable and singleton sites of 16S-23S rRNA ITS Arthrospira partial sequences included in the phylogenetic analysis. Numbering of the sites was based on the Arthrospira sp. PCC8005 cpcBA-IGS sequence (NZ_FO818640.1).
TEJP-2018-0056-File008.docx
Download MS Word (1.8 MB)Acknowledgements
We thank E. Panteris for valuable help with microscopy. We would like to acknowledge COST Action ES1408 ‘EUALGAE – European Network for algal bio-products’ for networking and ideas.
Disclosure statement
No potential conflict of interest was reported by the authors.
Additional information
Funding
Related Research Data
References
- Atashpaz, S., Khani, S., Barzegari, A., Barar, J., Vahed, S.Z., Azarbaijani, R. & Omidi, Y. (2010). A robust universal method for extraction of genomic DNA from bacterial species. Microbiology, 79: 538–542.
- Ballot, A., Dadheech, P.K. & Krienitz, L. (2004). Phylogenetic relationship of Arthrospira, Phormidium and Spirulina strains from Kenyan and Indian waterbodies. Algological Studies, 113: 37–56.
- Baurain, D., Renquin, L., Grubisic, S., Scheldeman, P., Belay, A. & Wilmotte, A. (2002). Remarkable conservation of internally transcribed spacer sequences of Arthrospira (‘Spirulina’) (Cyanophyceae, Cyanobacteria) strains from four continents and of recent and 30-year old dried samples from Africa. Journal of Phycology, 38: 384–393.
- Beard, S.J., Handley, B.A. & Walsby, A.E. (2002). Spontaneous mutations in gas vesicle genes of Planktothrix spp. affect gas vesicle production and critical pressure. FEMS Microbiology Letters, 215: 189–195.
- Boyer, S.L., Flechtner, V.R. & Johansen, J.R. (2001). Is the 16S–23S rRNA internal transcribed spacer region a good tool for use in molecular systematics and population genetics? A case study in cyanobacteria. Molecular Biology and Evolution, 18: 1057–1069.
- Choi, G.-G., Ahn, C.-Y. & Oh, H.-M. (2012). Phylogenetic relationships of Arthrospira strains inferred from 16S rRNA gene and cpcBA-IGS sequences. Algae, 27: 75–82.
- Clarke, K.R. (1993). Non-parametric multivariate analysis of changes in community structure. Australian Journal of Ecology, 18: 117–143.
- Clarke, K.R. & Green, R.H. (1988). Statistical design and analysis for a ‘biological effects’ study. Marine Ecology Progress Series, 46: 213–226.
- Clarke, K.R., Somerfield, P.J. & Gorley, R.N. (2008). Testing of null hypotheses in exploratory community analyses: similarity profiles and biota-environment linkage. Journal of Experimental Marine Biology and Ecology, 366: 56–69.
- Clayton, R.A., Sutton, G., Hinkle, P.S. Jr, Bult, C. & Fields, C. (1995). Intraspecific variation in small-subunit rRNA sequences in GenBank: why single sequences may not adequately represent prokaryotic taxa. International Journal of Systematic Bacteriology, 45: 595–599.
- Comte, K., Coursin, T. & Carre-Mlouka, A. (2013). A new genotype in the genus Arthrospira (Oscillatoriales, Cyanobacteria) revealed by a mosaic-like structure of the 16S-23S rRNA intergenic spacer region in strain PCC 9901. Phycologia, 52: 333–337.
- Dadheech, P.K., Ballot, A., Casper, P., Kotut, K., Novelo, E., Lemma, B., Pröschold, T. & Krienitz, L. (2010). Phylogenetic relationship and divergence among planktonic strains of Arthrospira (Oscillatoriales, Cyanobacteria) of African, Asian and American origin deduced by 16S–23S ITS and phycocyanin operon sequences. Phycologia, 49: 361–372.
- Eckert, E., Fontaneto, D., Coci, M. & Callieri, C. (2015). Does a barcoding gap exist in prokaryotes? Evidences from species delimitation in cyanobacteria. Life, 5: 50–64.
- Edgar, R.C. (2004). MUSCLE: a multiple sequence alignment method with reduced time and space complexity. BMC Bioinformatics, 5: 113.
- Felsenstein, J. (1981). Evolutionary trees from DNA sequences: a maximum likelihood approach. Journal of Molecular Evolution, 17: 368–376.
- Fournadzieva, S., Pilarsky, P., Arvanitis, A., Fytikas, M. & Koultsiakis, E. (2002). Use of geothermal fluids for cultivation of the microalgae Spirulina in Nigrita Serres. In 7th National Conference on Renewable Energy Sources (Tsiligiridis, G. & Kaouris, I., editors), 97–104. Patra, Greece.
- Fox, G.E., Wisotzkey, J.D. & Jurtshuk, P. (1992). How close is close: 16S rRNA sequence identity may not be sufficient to guarantee species identity. International Journal of Systematic Bacteriology, 42: 166–170.
- Garcia-Pichel, F., Prufert-Bebout, L. & Muyzer, G. (1996). Phenotypic and phylogenetic analyses show Microcoleus chthonoplastes to be a cosmopolitan cyanobacterium. Applied and Environmental Microbiology, 62: 3284–3291.
- Gaunt, M.W., Turner, S.L., Rigottier-Gois, L., Lloyd-Macgilp, S.A. & Young, J.P. (2001). Phylogenies of atpD and recA support the small subunit rRNA-based classification of rhizobia. International Journal of Systematic and Evolutionary Microbiology, 51: 2037–2048.
- Giordanino, M.V., Strauch, S.M., Villafañe, V.E. & Helbling, E.W. (2011). Influence of temperature and UVR on photosynthesis and morphology of four species of cyanobacteria. Journal of Photochemistry and Photobiology B, 103: 68–77.
- Gkelis, S. & Panou, M. (2016). Capturing biodiversity: linking a cyanobacteria culture collection to the “scratchpads” virtual research environment enhances biodiversity knowledge. Biodiversity data Journal, 4: e7965.
- Gkelis, S., Rajaniemi, P., Vardaka, E., Moustaka-Gouni, M., Lanaras, T. & Sivonen, K. (2005). Limnothrix redekei (Van Goor) Meffert (Cyanobacteria) strains from Lake Kastoria, Greece form a separate phylogenetic group. Microbial Ecology, 49: 176–182.
- Gomont, M. (1892). Monographie des Oscillariées (Nostocacées homocystées). Annales Des Sciences Naturelles, Botanique, 16: 91–264.
- Guiry, M.D. & Guiry, G.M. (2018). AlgaeBase. World-wide electronic publication, National University of Ireland, Galway. http://www.algaebase.org; searched on 8 November 2018.
- Gurtler, V. & Stanisich, V.A. (1996). New approaches to typing and identification of bacteria using the 16S-23S rDNA spacer region. Microbiology, 142: 3–16.
- Hall, T. (2011). BioEdit: an important software for molecular biology. GERF Bulletin of Bioscience, 2: 60–61.
- Han, D., Fan, Y. & Hu, Z. (2009). An evaluation of four phylogenetic markers in Nostoc: implications for cyanobacterial phylogenetic studies at the intrageneric level. Current Microbiology, 58: 170–176.
- Iteman, I., Rippka, R., Tandeau de Marsac, N. & Herdman, M. (2000). Comparison of conserved structural and regulatory domains within divergent 16S rRNA–23S rRNA spacer sequences of cyanobacteria. Microbiology, 146: 1275–1286.
- Janson, S. & Granéli, E. (2002). Phylogenetic analyses of nitrogen-fixing cyanobacteria from the Baltic Sea reveal sequence anomalies in the phycocyanin operon. International Journal of Systematic and Evolutionary Microbiology, 52: 1397–1404.
- Jeeji Bai, N. & Seshadri, C.V. (1980). On coiling and uncoiling of trichomes in the genus Spirulina. Algological Studies, 26: 32–47.
- Jukes, T.H. & Cantor, C.R. (1969). Evolution of protein molecules. In Mammalian Protein Metabolism III (Munro, H.N., editor), 21–132. Academic Press, New York.
- Kaggwa, M.N., Burian, A., Oduor, S.O. & Schagerl, M. (2013). Ecomorphological variability of Arthrospira fusiformis (Cyanoprokaryota) in African soda lakes. MicrobiologyOpen, 2: 881–891.
- Kebede, E. (1997). Response of Spirulina platensis (= Arthrospira fusiformis) from Lake Chitu, Ethiopia, to salinity stress from sodium salts. Journal of Applied Phycology, 9: 551–558.
- Kim, M., Oh, H.-S., Park, S.-C. & Chun, J. (2014). Towards a taxonomic coherence between average nucleotide identity and 16S rRNA gene sequence similarity for species demarcation of prokaryotes. International Journal of Systematic and Evolutionary Microbiology, 64: 346–351.
- Kirkby, S.M. & Whitton, B.A. (1976). Uses of coded data in study of Calothrix and Rivularia. British Phycological Journal, 11: 407–416.
- Komárek, J. (2002). Problems in cyanobacterial taxonomy: implications for most common toxin producing species. In Workshop on Freshwater Harmful Algal Blooms: Health Risk and Control Management (Melchiorre, S., Viaggiu, E. & Bruno, M., editors), 6–43. Rome, Italy.
- Komárek, J. (2016a). Review of the cyanobacterial genera implying planktic species after recent taxonomic revisions according to polyphasic methods: state as of 2014. Hydrobiologia, 764: 259–270.
- Komárek, J. (2016b). A polyphasic approach for the taxonomy of cyanobacteria: principles and applications. European Journal of Phycology, 51: 346–353.
- Komárek, J. & Anagnostidis, K. (2005). Cyanoprokaryota 2. Teil/2nd Part: Oscillatoriales. In Süss-wasserflora von Mitteleuropa, 19/2 (Büdel, B., Krienitz, L., Gärtner, G. & Schagerl, M., editors), Elsevier/Spektrum Akademischer Verlag, München.
- Komárek, J. & Lund, J.W.G. (1990). What is Spirulina platensis in fact? Algological Studies, 58: 1–13.
- Komárek, J., Kaštovský, J., Mareš, J. & Johansen, J.R. (2014). Taxonomic classification of cyanoprokaryotes (cyanobacterial genera) 2014, using a polyphasic approach. Preslia, 86: 295–335.
- Krieg, N.R. (2001). Identification of procaryotes. In Bergey’s Manual of Systematic Bacteriology. 2nd ed. (Boone, D.R. & Castenholz, R.W., editors), 33–38. Springer.
- Krienitz, L., Dadheech, P.K. & Kotut, K. (2013). Mass developments of a small sized ecotype of Arthrospira fusiformis in Lake Oloidien, Kenya, a new feeding ground for Lesser Flamingos in East Africa. Fottea, 13: 215–225.
- Kruskal, J.B. & Wish, M. (1978). Multidimensional Scaling. Sage, London.
- Lepére, C., Wilmotte, A. & Meyer, B. (2000). Molecular diversity of Microcystis strains (Cyanophyceae, Chroococcales) based on 16S rDNA sequences. Systematics and Geography of Plants, 70: 275–283.
- Li, R., Debella, H.J. & Carmichael, W.W. (2001). Isolates identifiable as Arthrospira maxima and Arthrospira fusiformis (Oscillatoriales, Cyanobacteria) appear identical on the basis of a morphological study in culture and 16S rRNA gene sequences. Phycologia, 40: 367–371.
- Lindblom, M. (1972). Antigen-antibody crossed electrophoresis of soluble proteins in different strains of Spirulina. Physiologia Plantarum, 26: 318–320.
- Ludwig, W. & Klenk, H.-P. (2001). Overview: a phylogenetic backbone and taxonomic framework for procaryotic systematics. In Bergey’s Manual of Systematic Bacteriology. 2nd ed. (Boone, D.R. & Castenholz, R.W., editors), 49–65. Springer.
- Ma, Z. & Gao, K., (2009). Photoregulation of morphological structure and its physiological relevance in the cyanobacterium Arthrospira (Spirulina) platensis. Planta, 230: 329–337.
- Manen, J.F. & Falquet, J. (2002). The cpcB-cpcA locus as a tool for the genetic characterization of the genus Arthrospira (Cyanobacteria): evidence for horizontal transfer. International Journal of Systematic and Evolutionary Microbiology, 52: 861–867.
- Mata, T.M., Martins, A.A. & Caetano, N.S. (2010). Microalgae for biodiesel production and other applications: a review. Renewable & Sustainable Energy Reviews, 14: 217–232.
- McGuire, R.F. (1984). A numerical taxonomic study of Nostoc and Anabaena. Journal of Phycology, 20: 454–460.
- Meier-Kolthoff, J.P., Auch, A.F., Klenk, H.-P. &Göker, M. (2013). Genome sequence-based species delimitation with confidence intervals and improved distance functions. BMC Bioinformatics, 14: 60.
- Miklaszewska, M., Waleron, M., Morin, N., Calusinska, M., Wilmotte, A., Tandeau de Marsac, N., Rippka, R. & Waleron, K. (2012). Elucidation of the gas vesicle gene clusters in cyanobacteria of the genus Arthrospira (Oscillatoriales, Cyanophyta) and correlation with ITS phylogeny. European Journal of Phycology, 47: 233–244.
- Mühling, M. (2000). Characterization of Arthrospira (Spirulina) strains. PhD thesis, Durham University, Durham, UK, 270 pp.
- Mühling, M., Harris, N., Belay, A. & Whitton, B.A. (2003). Reversal of helix orientation in the cyanobacterium Arthrospira. Journal of Phycology, 39: 360–367.
- Mühling, M., Somerfield, P.J., Harris, N., Belay, A. & Whitton, B.A. (2006). Phenotypic analysis of Arthrospira (Spirulina) strains (cyanobacteria). Phycologia, 45: 148–157.
- Mussagy, A., Wilmotte, A. & Cronberg, G. (2006). The cyanophyte Arthrospira fusiformis from Mozambique, Africa: morphological and molecular characterization. Algological Studies, 121: 59–73.
- Neilan, B.A., Jacobs, D. & Goodman, A.E. (1995). Genetic diversity and phylogeny of toxic cyanobacteria determined by DNA polymorphisms within the phycocyanin locus. Applied and Environmental Microbiology, 61: 3875–3883.
- Nelissen, B., Wilmotte, A., Neefs, J.-M. & Wachter, R. (1994). Phylogenetic relationships among filamentous helical cyanobacteria investigated on the basis of 16S ribosomal RNA gene sequence analysis. Systematic and Applied Microbiology, 17: 206–210.
- Nübel, U., Garcia-Pichel, F. & Muyzer, G. (1997). PCR primers to amplify 16S rRNA genes from cyanobacteria. Applied and Environmental Microbiology, 63: 3327–3332.
- Nunnery, J.K., Mevers, E. & Gerwick, W.H. (2010). Biologically active secondary metabolites from marine cyanobacteria. Current Opinion in Biotechnology, 21: 787–793.
- On, S.L.W. & Holmes, B. (1995). Classification and identification of Campylobacters, Helicobacters and allied taxa by numerical analysis of phenotypic characters. Systematic and Applied Microbiology, 18: 374–390.
- Pfeifer, F. (2012). Distribution, formation and regulation of gas vesicles. Nature Reviews in Microbiology, 10: 705–715.
- Posada, D. (2003). jModelTest: phylogenetic model averaging. Molecular Biology and Evolution, 25: 1253–1256.
- Premanandh, J., Priya, B., Teneva, I., Dzhambazov, B., Prabaharan, D. & Uma, L. (2006). Molecular characterization of marine cyanobacteria from the Indian subcontinent deduced from sequence analysis of the phycocyanin operon (cpcb-IGS-cpcA) and 16S-23S ITS region. Journal of Microbiology, 44: 607–616.
- Rambaut, A. (2018). FigTree. http://tree.bio.ed.ac.uk/software/figtree/.
- Rippka, R. (1988). Isolation and purification of cyanobacteria. Methods in Enzymology, 167: 3–27.
- Ronquist, F., Teslenko, M., van der Mark, P., Ayres, D.L., Darling, A., Höhna, S., Larget, B., Liu, L., Suchard, M.A. & Huelsenbeck, J.P. (2012). MrBayes 3.2: efficient Bayesian phylogenetic inference and model choice across a large model space. Systematic Biology, 61: 539–542.
- Rosselló-Mora, R. & Amann, R. (2001). The species concept for prokaryotes. FEMS Microbiology Reviews, 25: 39–67.
- Scheldeman, P., Baurain, D., Bouhy, R., Scott, M., Mühling, M., Whitton, B.A., Belay, A. & Wilmotte, A. (1999). Arthrospira (“Spirulina”) strains from four continents are resolved into only two clusters, based on amplified ribosomal DNA restriction analysis of the internally transcribed spacer. FEMS Microbiology Letters, 172: 213–222.
- Schindelin, J., Rueden, C.T., Hiner, M.C. & Eliceiri, K.W. (2015). The ImageJ ecosystem: an open platform for biomedical image analysis. Molecular Reproduction and Development, 82: 518–529.
- Sena, L., Rojas, D., Montiel, E., González, H., Moret, J. & Naranjo, L. (2011). A strategy to obtain axenic cultures of Arthrospira spp. cyanobacteria. World Journal of Microbiology and Biotechnology, 27: 1045–1053.
- Sili, C., Torzillo, G. & Vonshak, A. (2012). Arthrospira (Spirulina). In Ecology of Cyanobacteria II (Whitton, B.A., editor), 677–705. Springer, Dordrecht.
- Sivonen, K. & Jones, G. (1999). Cyanobacterial toxins. In Toxic Cyanobacteria in Water (Chorus, I. & Bartram, J., editors), 113–153. E & FN Spon, London.
- Sneath, P.H.A. & Sokal, R.R. (1962). Numerical taxonomy. Nature, 193: 855–860.
- Sokal, R.R. & Michener, C.D. (1958). A statistical method for evaluating systematic relationships. University of Kansas Science Bulletin, 38: 1409–1438.
- Stackebrandt, E. & Ebers, J. (2006). Taxonomic parameters revised: tarnished gold standards. Microbiology Today, 33: 152–155.
- Stackebrandt, E. & Goebel, B.M. (1994). Taxonomic note: a place for DNA-DNA reassociation and 16S rRNA sequence analysis in the present species definition in bacteriology. International Journal of Systematic Bacteriology, 44: 846–849.
- Tamura, K., Stecher, G., Peterson, D., Filipski, A. & Kumar, S. (2013). MEGA6: molecular evolutionary genetics analysis version 6.0. Molecular Biology and Evolution, 30: 2725–2729.
- Teneva, I., Dzhambazov, B., Mladenov, R. & Schirmer, K. (2005). Molecular and phylogenetic characterization of Phormidium species (Cyanoprokaryota) using the cpcB-IGS-cpcA locus. Journal of Phycology, 41: 188–194.
- van Eykelenburg, C. (1979). The ultrastructure of Spirulina platensis in relation to temperature and light intensity. Antonie van Leeuwenhoek, 45: 369–390.
- Viti, C., Ventura, S., Lotti, F., Capolino, E., Tomaselli, L. & Giovannetti, L. (1997). Genotypic diversity and typing of cyanobacterial strains of the genus Arthrospira by very sensitive total DNA restriction profile analysis. Research in Microbiology, 148: 605–611.
- Wang, Z.P. & Zhao, Y. (2005). Morphological reversion of Spirulina (Arthrospira) platensis (Cyanophyta): from linear to helical. Journal of Phycology, 41: 622–628.
- Wilmotte, A. 1994. Molecular evolution and taxonomy of the cyanobacteria. In The Molecular Biology of Cyanobacteria (Bryant, D.A., editor), 1–25. Springer, Dordrecht.
- Wu, H., Gao, K., Villafane, V.E., Watanabe, T. & Helbling, E.W. (2005). Effects of solar UV radiation on morphology and photosynthesis of filamentous cyanobacterium Arthrospira platensis. Applied and Environmental Microbiology, 71: 5004–5013.
- Zarrouk, C., (1966) Contribution a l’étude d’une cyanobacterie: influence de divers facteurs physiques et chimiques sur la croissance et la photosynthese de Spirulina maxima (Setchell et Gardner) Geitler. PhD Thesis, University of Paris, Paris, France, 85 pp.
- Zhou, H.-N., Xie, Y.-G., Wang, Z.-P., Shao, B., Liu, X.-Y., Yu, J. & Chen, Z.-Y. (2013). Evaluation of Arthrospira (Spirulina) platensis production that using cpcHID operon. Pakistan Journal of Botany, 45: 687–694.
- Zuker, M. (2003). Mfold web server for nucleic acid folding and hybridization prediction. Nucleic Acids Research, 31: 3406–3415.