
ABSTRACT
This study is the first to determine the transcriptomes of eight colonial volvocine algae: Pandorina morum, P. colemaniae, Volvulina compacta, Eudorina elegans, E. cylindrica, Yamagishiella unicocca, Colemanosphaera charkowiensis and C. angeleri. By analysing these data together with the whole-genome data of Chlamydomonas reinhardtii and other colonial volvocine algae, we determined 26 979 gene families and 105 single-copy orthogroups. Using the single-copy orthogroups, we adopted a supermatrix and coalescent-based approach to perform phylotranscriptomic analysis of colonial volvocine algae. The phylogenetic relationships of most species were consistent with those of a previous study, and the results showed paraphyly of the genus Pandorina. Then, we analysed gene family expansion and contraction in colonial volvocine algae and found that they exhibited a large number of expanded and contracted gene families. In particular, the common ancestor of the Volvocaceae had the largest number of expanded gene families, which may be associated with the increased volume of extracellular matrix. Finally, using the ML method to analyse the substitution rates among colonial volvocine algae based on single-copy orthogroups, we showed a significantly higher non-synonymous substitution (dN) rate in Tetrabaena socialis. By analysing the differences in the dN/dS ratio, we found that more orthogroups exhibited a significantly higher dN/dS in T. socialis; we speculate that the higher dN/dS could indicate relaxed selection pressure and that this lower constraint allows the accumulation of more non-synonymous mutations in T. socialis.
Introduction
The transition from unicellular organisms to multicellularity provided advantages such as better utilization of scarce resources, new relationships between cells and the environment, and escape from predators (Umen, Citation2014). The transition to multicellularity has happened many times in different species (Knoll, Citation2011; Parfrey & Lahr, Citation2013), and is associated with considerations of the life cycle, cell biology and ecology of simpler ancestor(s) that gave rise to multicellular descendant lineages. As more whole genomes have been sequenced, comparative genomic analysis provides insights into the evolutionary transition. Regarding the origin of metazoans, choanoflagellates evolved before the origin and diversification of metazoans (Lavrov et al., Citation2005; Rokas et al., Citation2005). King et al. (Citation2008) analysed the genome of the unicellular choanoflagellate Monosiga brevicollis, finding several protein domains exclusive to choanoflagellates and metazoans; these domains are important in, for example, cell adhesion, the extracellular matrix and cell signalling, suggesting an important role in the origin of multicellularity. Srivastava et al. (Citation2010) compared the genome of Amphimedon queenslandica with related species and found that many gene families are associated with six hallmarks of metazoan multicellularity. In Protista, algae have acquired complex multicellularity several times independently (De Clerck et al., Citation2018). Within Streptophyta, the expanded transcription factors families, rare domain combinations, diverse protein domains and others all contribute to multicellularity in Ulva (De Clerck et al., Citation2018). Within the Chlorophyta, the colonial volvocine algae are an important model system to study the transition to multicellularity (Leliaert et al., Citation2012). Comparative genomic studies showed that the retinoblastoma cell cycle regulatory pathway and cyclin-dependent kinases are important to multicellularity (Hanschen et al., Citation2016), and expanded gene families and the ubiquitin proteasomal pathway are also associated with the origin of multicellularity (Featherston et al., Citation2017).
The colonial volvocine algae belong to the order Chlamydomonadales (sometimes referred to as Volvocales); they are all multicellular species with colonies composed of Chlamydomonas-like cells and surrounded by extracellular matrix. All these algae were initially assigned to the family Volvocaceae. Based on the tripartite boundary of the matrix (which appears as a dark line when stained and examined by electronic microscope; Coleman, Citation2012), Nozaki & Kuroiwa (Citation1992) assigned the genera Gonium and Astrephomene to the family Goniaceae. Then, Nozaki & Itoh (Citation1994) used cladistic analysis to deduce phylogenetic relationships within the colonial volvocine algae, and the four-celled species Gonium sociale (renamed Tetrabaena socialis) together with Basichlamys was placed in the new family Tetrabaenaceae. Therefore, the colonial volvocine algae are now composed of three families, Tetrabaenaceae, Goniaceae and Volvocaceae. The simplest colonial species are in the family Tetrabaenaceae, with only four cells forming a square colony (Nozaki & Ohtani, Citation1992; Nozaki & Itoh, Citation1994; Nozaki et al., Citation1996). Species in Goniaceae have a colony composed of more than four cells: species of Gonium form planar colonies of eight or 16 cells (Hayama et al., Citation2010); members of the genus Astrephomene form ovoid colonies of 32 or more cells (Nozaki, Citation1983). The family Volvocaceae is composed of eight genera (Pandorina, Volvulina, Platydorina, Yamagishiella, Colemanosphaera, Eudorina, Pleodorina, Volvox), with species forming a spheroidal colony of more than eight cells (Nozaki & Kuroiwa, Citation1992), the evolution of which has been investigated (Hallmann, Citation2011).
The taxonomy of colonial volvocine algae is mainly based on morphology and phylogenetic analysis. Regarding morphology, the colonial volvocine algae show a series of extant organisms with organizational complexity (Hallmann, Citation2011). Thus, their morphology makes colonial volvocine algae an ideal model for studying the evolutionary transition to complexity. Phylogenetic analyses have mainly used markers such as the internal transcribed spacer (ITS) (Angeler et al., Citation1999; Coleman, Citation2001; Yamada et al., Citation2008; Hayama et al., Citation2010; Nozaki et al., Citation2015), the large subunit of the ribulose-1,5-bisoxyg/oxygenase (rbcL) gene (Nozaki et al., Citation1997a, Citation1997b, Citation1998; Yamada et al., Citation2008; Hayama et al., Citation2010), and five chloroplast protein-coding genes (Nakada et al., Citation2010; Nozaki et al., Citation2000, Citation2006, Citation2014, Citation2015; Nozaki & Coleman, Citation2011). Though phylogenetic analyses based on one or a few genes have been widely performed in recent decades, they have some limitations, such as the existence of paralogues, different evolutionary rates, incomplete lineage sorting, horizontal gene transfer and gene duplication (Maddison, Citation1997; Huynen & Bork, Citation1998; Doolittle, Citation1999; Degnan & Rosenberg, Citation2006; Zou et al., Citation2016; Gernandt et al., Citation2018), meaning that the gene tree may not represent the species tree in some cases. Generally, increases in the information in a dataset and the use of a more appropriate analysis method reduce the influence of such errors (Wolf et al., Citation2002; Mirarab et al., Citation2014; Davidson et al., Citation2015; Mirarab, Citation2019). With the application of high-throughput sequencing, genome archives are now available to perform phylotranscriptomic analyses on different species. High-throughput sequencing would provide sufficient information for our dataset, and the incongruence of phylogenetic results would therefore disappear, resulting in a robust resolution. Though phylotranscriptomics have been employed for different species (Wickett et al., Citation2014; Johnson et al., Citation2016; Jackson et al., Citation2017), little is known about the phylotranscriptomics of colonial volvocine algae.
High-throughput sequencing also makes it possible to analyse gene family evolution. The expansion and contraction of gene families have been widely used to analyse the origin, adaptation and evolution of different species (Hahn et al., Citation2007; Kim et al., Citation2016). For colonial volvocine algae, previous studies have proposed that the expansion of gene families is involved in extracellular matrix formation and cell-cycle regulation (Prochnik et al., Citation2010; Hanschen et al., Citation2016; Featherston et al., Citation2017). Thus, gene family evolution analysis may help us understand the evolutionary transitions in this group of algae. There are five colonial volvocine species for which whole genomes are available, but the nucleotide and amino acid sequence annotation of Eudorina and Yamagishiella are currently restricted to sex-determining regions (Prochnik et al., Citation2010, Hanschen et al., Citation2016; Featherston et al., Citation2017; Hamaji et al., Citation2018). So, gene family evolution analysis has only been studied in three species (Tetrabaena socialis, Gonium pectorale and Volvox carteri) in colonial volvocine algae.
Natural selection plays an important role in shaping organismal diversity (Lenski et al., Citation2003); generally, most genes are under purifying selection to maintain their function (Zhang, Citation2003). However, changes in selection may lead to evolutionary innovations; for example, Zhen & Ungerer (Citation2008) found that the freezing tolerance of Arabidopsis thaliana is associated with relaxed purifying selection on a group of genes. The dN/dS ratio is a measurement of natural selection acting on the genes. Normally, values of dN/dS < 1, = 1 and > 1 mean negative purifying selection, neutral evolution and positive selection, respectively (Yang, Citation2007). dN/dS analysis in colonial volvocine algae would further contribute to revealing the evolutionary relationships in this group of algae.
In this study, the transcriptomes of eight colonial volvocine algae were sequenced. By using these genome archives, we conducted phylotranscriptomic analysis among the colonial volvocine algae to obtain a robust resolution of the phylogenetic relationships between them. We also analysed the expansion and contraction of gene families among these species, which offers useful information about their adaptation. Finally, we analysed dN/dS in these algae, which provides further information on the evolutionary relationships in this group.
Materials and methods
Cultures
Eight colonial volvocine algae were obtained from the Culture Collection of Freshwater Algae at the Institute of Hydrobiology, Chinese Academy of Sciences. The strain numbers were as follows: Pandorina morum (strain FACHB-2362), P. colemaniae (strain FACHB-2361), Volvulina compacta (strain FACHB-2337), Colemanosphaera angeleri (strain FACHB-2363), C. charkowiensis (strain FACHB-2326), Yamagishiella unicocca (strain FACHB-2364), Eudorina elegans (strain FACHB-2321) and E. cylindrica (strain FACHB-2322). All algae were cultured in BG11 medium, and the cultures were grown at 20–25°C under a 14 h light:10 h dark schedule under cool-white fluorescent lamps at an intensity of 10–20 µmol m–2 s–1.
Library preparation and sequencing
Total RNA was extracted using TRIzol reagent (Thermo Fisher Scientific, USA), and poly-A+ mRNA was isolated using oligo dT magnetic beads. The mRNA was fragmented with divalent cations under elevated temperature in NEBNext First Strand Synthesis Reaction Buffer (5×) and was used as a template for random hexamer-primed first-strand cDNA synthesis, after which the second strand of cDNA was synthesized. The sequencing library was generated via the NEBNext Ultra RNA Library Prep Kit for Illumina (NEB, USA) and sequenced on the NovaSeq 6000 platform (Illumina, USA). Finally, 150 bp paired-end reads were generated.
Quality control, de novo assembly and sequence annotation
The quality of the raw reads was first checked by using FastQC v0.11.6 (http://www.bioinformatics.babraham.ac.uk/projects/fastqc/) and the raw reads were subjected to quality control with Trimmomatic v0.38 (Bolger et al., Citation2014) (LEADING:3, TRAILING:3, SLIDINGWINDOW:4:15, HEADCROP:10, MINLEN:36). Then, de novo assembly of the clean reads was conducted using Trinity v2.8.4 (Grabherr et al., Citation2011) with default parameters and CD-HIT v4.7 (Fu et al., Citation2012) was used to remove redundant transcripts with the default parameters. The completeness of the final transcripts was assessed by BUSCO v3.0.2 (Simão et al., Citation2015). Then, the TransDecoder v5.5.0 was used to predict the open reading frame (ORF) of each transcript. BLASTP (Camacho et al., Citation2009) searches of the longest ORFs (the longest coding region in each transcript) were conducted against the Uniref90 database with Diamond v0.8.22.84 (Buchfink et al., Citation2015) and Pfam searches of the longest ORFs in the Pfam database were conducted using HMMER v3.1b2 (Mistry et al., Citation2013). Finally, TransDecoder was used to integrate the BLASTP and Pfam search results into coding regions, and the nucleotide sequences (CDS) and amino acid sequences (PEP sequence) of these regions were used for the following analyses. Additionally, the CDS and PEP sequence of Chlamydomonas reinhardtii, Tetrabaena socialis, Gonium pectorale and Volvox carteri were downloaded from NCBI; the assembly accession numbers of each species were GCF_000002595.1, GCA_002891735.1, GCA_001584585.1 and GCF_000143455.1, respectively. All raw reads were deposited in the NCBI Sequence Reads Archive (BioProject PRJNA532307). The CDS and PEP sequences of Yamagishiella unicocca and Eudorina sp. are currently restricted to sex-determining regions, so these species were not included in our analysis.
Orthologous group identification and phylotranscriptomic analysis
The PEP sequences of all taxa were used to determine single-copy orthologues with OrthoFinder v2.2.7 (Emms & Kelly, Citation2015) and the PEP sequences of single-copy orthologues were selected for phylotranscriptomic analysis. Each single-copy orthologue was aligned using MAFFT v7.394 (Katoh & Standley, Citation2013) with the options -maxiterate 1000 and -globalpair. Regions showing poor alignment were trimmed with trimAl v1.2 (Capella-Gutiérrez et al., Citation2009) using the parameter -automated1. The trimmed alignment of orthologous groups was used for the following phylotranscriptomic analysis.
We used supermatrix analysis and coalescent-based analysis to construct the phylogenetic tree. For the supermatrix analysis, we first used Phyutility (Smith & Dunn, Citation2008) to concatenate all orthologous groups and the evolutionary models and partitioning of the PEP dataset were determined with PartitionFinder 2 (Lanfear et al., Citation2016). Phylogenies were inferred from the PEP dataset using Maximum likelihood (ML) and Bayesian (BI) methods. ML analyses were carried out using RAxML v8.2.10 (Stamatakis, Citation2014). Rapid bootstrap analysis with 1000 replicates of the dataset for ML was performed to estimate statistical reliability. Bayesian analysis was performed with MrBayes v3.2.6 (Ronquist et al., Citation2012). Markov chain Monte Carlo (MCMC) analysis was run with four Markov chains (three heated, one cold) for 1 000 000 generations with trees sampled every 1000 generations. Each time the diagnostics were calculated, a fixed number of samples (burnin = 1000) were discarded from the beginning of the chain. For the coalescent-based analyses, ML analysis of each single-copy orthologue was performed in RAxML by conducting 1000 rapid bootstrap replicates with the PROTGAMMAGTR model. Then, the resulting best trees were used to infer the coalescence-based species tree (ST) phylogeny with ASTRAL v5.6.3 (Zhang et al., Citation2018).
Gene family evolution analysis
The MCMCtree Bayesian program in PAML v4.9 (Yang, Citation2007) was used to estimate divergence times under relaxed-clock models; these analyses were conducted on the CDSs, and the fossil calibration information mainly referred to Herron et al. (Citation2009) with RootAge specified as ‘>200<300’. The phylogenetic ML tree, BI tree and ST tree all showed the same topology, which was used for divergence time estimation. Based on the estimations, the CAFE v3.1 (De Bie et al., Citation2006) program was used to calculate the expansion and contraction of a gene family; we used the criterion of p < 0.05 for determining significantly changed gene families. All PEP sequences were imported into InterProScan v5.32 (Philip et al., Citation2014) for Gene Ontology (GO) term mapping (http://www.geneontology.org/). GO enrichment analysis was performed using clusterProfiler v3.12.0 (Yu et al., Citation2012), and we controlled for multiple testing using the false discovery rate method (Benjamini & Hochberg, Citation1995).
dN/dS analysis
The CODEML program of PAML v4.9 (Yang, Citation2007) was used to estimate substitution rates and dN/dS ratios. The ML model (runmode = −2, CodonFreq = 2) was used to measure non-synonymous (dN) and synonymous (dS) substitution rates; the analysis was based on all single-copy orthologues, Chlamydomonas reinhardtii was used as a reference and orthologues with dS values > 5 were discarded from further analysis. Comparisons of evolutionary rates used the Wilcoxon rank sum test. The phylogenetic tree was used as a constraint tree, but branch lengths were inferred by using PAML. The ML model showed significantly higher dN rates in Tetrabaena socialis than in other colonial volvocine algae. To explore the reason for this phenomenon, we used the branch model (two-ratio; Yang, Citation1998) to test whether T. socialis presents a different dN/dS relative to the other species. T. socialis was labelled as the foreground branch. A null model (model = 0) in which dN/dS ratio was fixed across all species was compared with an alternative model (model = 2) in which T. socialis was allowed to have a different dN/dS. Likelihood ratio tests (LRT) were used to test the model fit and the chi-square test was applied for testing p values. Multiple testing was corrected by applying the false discovery rate method (FDR) (Benjamini & Hochberg, Citation1995) as implemented in R (http://www.R-project.org). GO annotation of the T. socialis sequence was based on InterProScan v5.32 (Philip et al., Citation2014).
Results
De novo transcriptome assembly and orthology detection
The related sequencing and assembly information is listed in . Illumina paired-end sequencing technology revealed that the number of raw reads yielded by each species ranged from 50362006–71 111684. After filtering for adaptors and low-quality sequences, the number of clean reads ranged from 48 284776–69311428. Then, Trinity was employed for de novo assembly; the number of assembled contigs ranged from 60366–130 254 and the average contig length and N50 values of all species were greater than 1100 bp and 2200 bp, respectively, which is indicative of high contiguity. After removing redundant transcripts via CD-HIT, BUSCO software was applied for further quantitative assessment of assembly and annotation completeness. Searching for the BUSCOs defined for Chlorophyta revealed that the percentages of conserved genes in our eight species transcriptomes recovered via BUSCO analysis were >86%, indicating a high completeness level. Finally, TransDecoder was used to predict coding sequences from the assembled transcripts; the number of coding sequences ranged from 39 532 to 81 820, and the nucleotide sequence (CDSs) and amino acid sequence (PEP sequence) of the coding sequences were used for the following analysis.
Table 1. Summary of sequencing and assembly.
The CDSs and PEP sequences of C. reinhardtii, T. socialis, Gonium pectorale and Volvox carteri were downloaded from the NCBI database. Together with our eight species, we used the PEP sequences of 12 species in total to detect orthology. The total number of genes that we used was 515 100, and only 69.3% of the genes were assigned to orthogroups. The number of orthogroups was 26 979, where each orthogroup represented a gene family, and all orthogroups were used for the gene family evolution analysis. The number of single-copy orthogroups was 105, and all single-copy orthogroups were used for phylotranscriptomic analysis and dN/dS analysis.
Phylotranscriptomic analysis
The phylogenetic tree () was constructed for all 12 taxa via the PEP sequences of single-copy orthogroups. The ML tree, BI tree and ST tree all showed the same topology reflecting the relationships among the colonial volvocine algae. When rooted with C. reinhardtii, T. socialis is sister to the clade formed by G. pectorale and other colonial volvocine algae, and G. pectorale is sister to the clade formed by other colonial volvocine algae. T. socialis belongs to family Tetrabaenaceae, G. pectorale to the Goniaceae and all other colonial volvocine algae are in the Volvocaceae. The relationships between these three families in our phylogenetic tree are consistent with those of previous studies mainly based on morphological data, ITS or five chloroplast genes (Nozaki & Itoh, Citation1994; Coleman, Citation1999; Nozaki et al., Citation2000; Herron & Michod, Citation2008), further indicating their validity.
Fig. 1. Phylogenetic tree of the colonial volvocine algae based on 105 single-copy orthogroups. Numbers on branches represent Bayesian posterior probabilities, bootstrap values and support values of ASTRAL, respectively. Branch lengths are proportional to genetic distances, which are indicated by the scale bar. The grey background indicates the outgroup; the yellow background indicates family Tetrabaenaceae; the blue background indicates family Goniaceae; and the green background indicates family Volvocaceae.
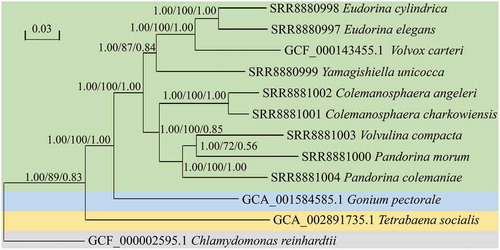
All of the Volvocaceae constitute a larger monophyletic group; in this clade, the phylogenetic position of all species is consistent with the study of Nozaki et al. (Citation2014) (mainly based on five chloroplast genes) except for the Pandorina–Volvulina clade. Our phylotranscriptomic analysis showed that P. morum and V. compacta form a clade and that this clade is sister to P. colemaniae; this phylogenetic relationship has previously been reported, largely based on ITS or five chloroplast genes (Coleman, Citation2001; Herron & Michod, Citation2008; Herron, Citation2016; Hanschen et al., Citation2018).
Gene family evolution analysis
We used the birth-death model of CAFE to analyse gene family evolution, and this method assumes at least one gene in the root of the species tree. Among all 26 979 gene families, only 9497 gene families met this criterion, so we only used 9497 gene families to analyse expansion and contraction.
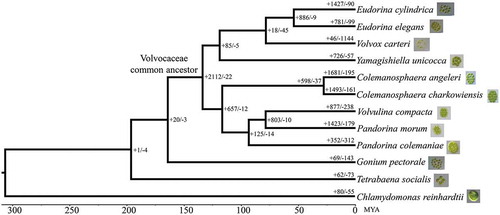
As shown in , the gene families of all colonial volvocine algae have experienced a large number of expansions and contractions; Volvox carteri displayed 1144 contracted gene families, which is greater than the number in all other nodes. Referring to the ancestor node, the common ancestor of Volvocaceae displayed 2112 expanded gene families, more than for all other nodes.
Fig. 2. Gene family expansion or contraction in colonial volvocine algae. Branch numbers indicate the number of gene families that have expanded (+) and contracted (−) since the split from the common ancestor. The timelines indicate divergence times among the species.
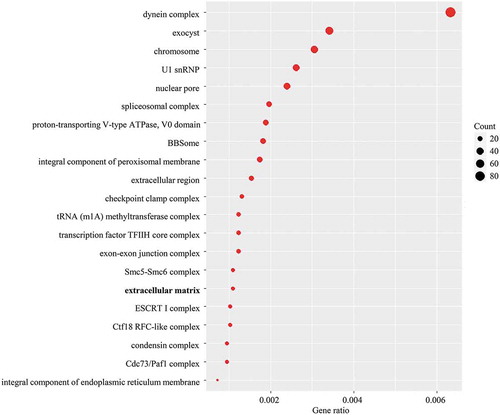
To investigate whether the observed gene family evolution is associated with morphological diversity, we performed Gene Ontology (GO) enrichment analysis based on the expanded gene families. For the common ancestor of Volvocaceae, the expanded families were enriched in 202 GO terms, among which 21 GO terms belonged to the cellular component category (). These GO terms were mainly associated with different biological complexes; in particular, the expanded gene families of the common ancestor of Volvocaceae were enriched in the term ‘extracellular matrix’ (GO:0031012, adjusted p value = 3.51E-09), which may be related to an increased volume of extracellular matrix.
Fig. 3. Dot plot showing the enrichment of cellular component GO terms for expanded gene families of the common ancestor of Volvocaceae (FDR adjusted p < 0.05). The dot sizes represent the numbers of genes.
dN/dS analysis
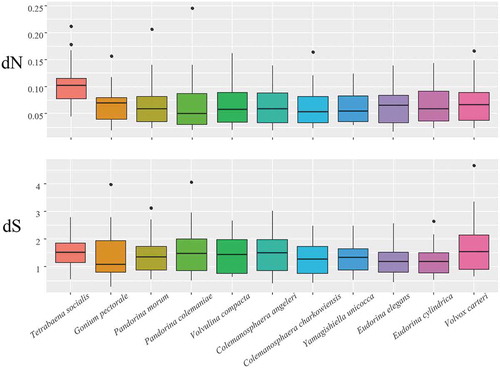
The ML method was used to calculate the rate of non-synonymous (dN) and synonymous (dS) substitutions for 105 single-copy orthogroups between the colonial volvocine algae; after discarding the orthogroups with dS >5, there were 20 orthogroups. The boxplot of each species based on the dN and dS rates of these 20 orthogroups is shown in . From the boxplot, we can see that the dN rate of T. socialis was higher than those of other species, and there were no significant differences between dS rates of different species. We compared the dN rate of T. socialis with those of all other colonial volvocine algae using the Wilcoxon rank sum test and it was significantly different (p = 9.844e-05).
Fig. 4. Boxplots of the non-synonymous (dN) and synonymous (dS) substitutions for each species of colonial volvocine algae. For each species, the box represents values between quartiles, outliers are shown as black points, and black lines inside the box show median values.
We used the branch model (two-ratio; Yang, Citation1998) to test the differences in the dN/dS ratio between T. socialis and other colonial volvocine algae. The results are shown in . Five orthogroups showed significant differences in their dN/dS ratios (FDR corrected p value <0.05), among which four orthogroups had significantly higher dN/dS ratios in T. socialis. By using InterProScan, we found that these orthogroups mapped to the following GO terms: nucleus (GO:0005634), chromatin assembly or disassembly (GO:0006333), structural constituent of ribosome (GO:0003735), ribosome (GO:0005840) and translation (GO:0006412). All the GO terms of these orthogroups were mainly associated with the process of protein forming.
Table 2. Differences in dN/dS between Tetrabaena socialis and other colonial volvocine algae. Orthogroups with FDR-adjusted p values < 0.05 are shown in bold.
Discussion
In a recent study, Proeschold et al. (Citation2018) showed that C. reinhardtii was nested within the colonial volvocine clade, casting doubts on choosing it as an outgroup for the colonial volvocine algae clade. Their analysis was based on three datasets: (1) rbcL, (2) ITS and (3) SSU and ITS. However, Zhang et al.’s (Citation2019) phylotranscriptomic analysis showed that C. reinhardtii was sister to the colonial volvocine algae clade. Their analysis was based on supermatrix and coalescent approaches using several unlinked orthologous genes, an approach similar to ours. Two datasets in Proeschold et al. (Citation2018) were based on single gene like ITS or rbcL, but the evolutionary relationships of the species being investigated may not be reflected by a single gene tree (Maddison, Citation1997; Pamilo & Nei, Citation1988; Wolf et al., Citation2002). Previous studies proposed three main limitations for single-gene phylogenetic analysis: insufficient number of informative sites; different lineages having different evolutionary rates; and the impact of lateral gene transfer. These problems could be overcome using the supermatrix approach (Wolf et al., Citation2002). The phylotranscriptomic analysis in Zhang et al. (Citation2019) and our analysis were based on the concatenated dataset of single-copy orthologues, genes related by speciation (Koonin, Citation2005). By using single-copy orthologues we can eliminate the impact of gene duplication and loss (Mallo & Posada, Citation2016). In our analysis, the concatenated data have been partitioned to apply different evolutionary models to different partitions, which would further overcome the limitations of the supermatrix approach (Wolf et al., Citation2002). Proeschold et al. (Citation2018) also proposed that gene sequences should not be combined in a concatenated dataset if the tree topologies of single genes differ significantly. One of the main reasons for gene tree discordance is the issue of incomplete lineage sorting (Degnan & Rosenberg, Citation2009). To overcome this limitation, Zhang et al. (Citation2019) and our study both used coalescent-based analyses using the ASTRAL program. ASTRAL enables highly accurate phylogenomic estimation, even in the presence of high levels of gene tree conflict because of incomplete lineage sorting (Mirarab et al., Citation2014) or horizontal gene transfer (Davidson et al., Citation2015; Mirarab, Citation2019). Meanwhile, the phylogenetic analysis of Proeschold et al. (Citation2018) based on the concatenated dataset of SSU and ITS also has limitations: the SSU and ITS are genes or regions in physical proximity, thus the concatenated dataset is a linkage group. Instead, phylotranscriptomic analysis based on single-copy orthologues uses a large number of unlinked loci, which is an appropriate way to reduce the incongruence between gene trees and species trees (Hillis, Citation1995; Ruvolo, Citation1997; Sang, Citation2002). We consider that all these are a priori reasons to follow Zhang et al. (Citation2019) rather than the Pröschold et al. (Citation2018) analysis. Hence, we still consider C. reinhardtii as an outgroup for colonial volvocine algae.
The genera Pandorina and Volvulina are reported to be non-monophyletic (Coleman, Citation2001; Nakada et al., Citation2010; Nozaki et al., Citation2014), but the phylogenetic analyses in these studies have mainly been based on only one or a few genes. In this study, we used 105 single-copy orthogroups to construct the phylogenetic tree. The total amino acid length of single-copy orthogroups was 22 936, and an increased sequence length should improve the support, resolution and accuracy of the phylogenetic analysis (Wortley et al., Citation2005). Additionally, we used supermatrix and coalescent-based analyses to perform the phylotranscriptomic analysis, two methods each presenting certain advantages as mentioned above; both methods showed paraphyly of Pandorina. Our results showed that we could not resolve the paraphyly of Pandorina by increasing the sequence length or changing the analysis method. In this study, we used only two Pandorina species and one Volvulina species, and this lack of resolution may have mainly been due to insufficient analysed species.
The number of expanded or contracted gene families may be influenced by different factors, such as gene duplication, de novo gene creation, gene loss, the function of gene families and changes in environmental conditions (Prachumwat & Li, Citation2008; Guo, Citation2013; Albalat & Cañestro, Citation2016). Therefore, the different numbers of gene family expansions and contractions observed in colonial volvocine algae may be due to a variety of causes. Thus far, whole genomes have been made available for seven colonial volvocine algae, with genome sizes and gene family evolution (number in this study, noted in parentheses) as follows: Tetrabaena socialis, 135.78 Mb (+62/−73); Gonium pectorale, 148.81 Mb (+69/−143); Yamagishiella unicocca, 134.23-Plus, 140.84-Minus (+726/−57); Eudorina sp. Male-168.62 MB, Female-184.03 MB (+1427/−90 or +781/−99) and Volvox carteri, 137.68 Mb (+46/−1144). A previous study proposed that gene family contraction is one of the reasons for genome reduction (Qiu et al., Citation2015). In our case, although V. carteri shows the largest number of gene family contractions, it does not have the smallest genome size – its genome is the third smallest. We speculate that the large number of gene family contractions could be only one of the reasons for the reduced genome size of V. carteri.
Prochnik et al. (Citation2010) compared the genomes of V. carteri and C. reinhardtii, finding that two gene families involved in extracellular matrix functions are substantially larger in the V. carteri genome. As V. carteri has a much greater volume of extracellular matrix than C. reinhardtii, these expanded gene families may be an important factor in the size of the extracellular matrix in colonial volvocine algae (Leliaert et al., Citation2012). For the common ancestor of Volvocaceae, we also found that the expanded gene families were enriched in extracellular matrix related genes. It has been proposed that the common ancestor of Volvocaceae experienced an increase in the volume of extracellular matrix (Kirk, Citation2005; Herron et al., Citation2009); as gene family expansion may be associated with the size of extracellular matrix as mentioned above, and the expanded gene families of the Volvocaceae common ancestor are enriched in extracellular matrix related genes, we propose that the common ancestor of the Volvocaceae experienced gene family expansion, which may have contributed to increasing the volume of extracellular matrix.
We also compared the substitution rate among the colonial volvocine algae and found that dN was significantly higher in Tetrabaena socialis. The dN/dS ratios of most orthogroups showed no difference, but T. socialis exhibited four more orthogroups with significantly higher dN/dS ratios. Although the dN/dS ratios of all orthogroups were relatively low (dN/dS <1), which indicated strong purifying selection (Yang, Citation2007), the relatively higher dN/dS ratio could be interpreted as indicating relaxed purifying selection (Guisinger et al., Citation2008). The greater number of orthogroups with higher dN/dS ratios in T. socialis could be considered indicative of relaxed purifying selection in this species; this relaxed selection pressure may allow the accumulation of additional non-synonymous substitutions in T. socialis (Björnerfeldt et al., Citation2006), leading to higher dN substitution rates. The higher dN substitution rates may result in a novel function, for example, Kato-Minoura et al. (Citation2015) studied two actin genes among species in Volvocales (including colonial volvocine algae), a conventional actin (actin) gene and an unconventional action (NAP) gene. They showed a similar dS between the two genes but higher dN in NAP, and proposed that NAP is unique to volvocine species and performs a cellular function with fewer constraints; more importantly, NAP genes might have a function different from that of the actin gene. As the orthogroups under relaxed purifying selection in T. socialis are mainly associated with the process of protein formation, such a phenomenon may foster evolutionary innovation (Wertheim et al., Citation2014).
Only a limited number of genome data for colonial volvocine algae are available currently, so several aspects of further study are needed. (1) The transcriptome data of more strains are needed to fully resolve the phylogenetic relationships of the Pandorina–Volvulina clade; (2) More well-annotated whole genomes are needed to find out the main reason for the reduced genomic size of V. carteri; (3) Among the colonial volvocine algae, why would T. socialis have experienced relaxed purifying selection and what would be the result of this relaxed constraint?
Our study is the first to perform phylotranscriptomic analysis based on transcriptome data from colonial volvocine algae. By using 105 single-copy orthogroups and two phylogenetic analysis approaches, we found paraphyly of the genus Pandorina yet again, and we propose that more species are needed for phylogenetic analysis to fully resolve this phenomenon. Based on gene family evolution analysis, we found that the expanded gene families of the common ancestor of the Volvocaceae may be associated with an increased volume of extracellular matrix. When compared with other colonial volvocine algae, we found that some single-copy orthogroups of T. socialis have experienced relaxed purifying selection, which allows for significantly higher non-synonymy in T. socialis.
Author contributions
Y. Hu: original concept, culture experiments, analysis of molecular data, drafting manuscript; All authors: manuscript editing.
Acknowledgements
The research was supported by the Wuhan Branch, Supercomputing Center, Chinese Academy of Sciences, China.
Disclosure statement
No potential conflict of interest was reported by the authors.
Additional information
Funding
References
- Albalat, R. & Cañestro, C. (2016). Evolution by gene loss. Nature Reviews Genetics, 17: 379.
- Angeler, D.G., Schagerl, M. & Coleman, A.W. (1999). Phylogenetic relationships among isolates of Eudorina species (Volvocales, Chlorophyta) inferred from molecular and biochemical data. Journal of Phycology, 35: 815–823.
- Benjamini, Y. & Hochberg, Y. (1995). Controlling the false discovery rate: a practical and powerful approach to multiple testing. Journal of the Royal Statistical Society, 57: 289–300.
- Björnerfeldt, S., Webster, M.T. & Vilà, C. (2006). Relaxation of selective constraint on dog mitochondrial DNA following domestication. Genome Research, 16: 990–994.
- Bolger, A.M., Lohse, M. & Usadel, B. (2014). Trimmomatic: a flexible trimmer for Illumina sequence data. Bioinformatics, 30: 2114–2120.
- Buchfink, B., Xie, C. & Huson, D.H. (2015). Fast and sensitive protein alignment using DIAMOND. Nature Methods, 12: 59.
- Camacho, C., Coulouris, G., Avagyan, V., Ma, N., Papadopoulos, J., Bealer, K. & Madden, T.L. (2009). BLAST+: architecture and applications. BMC Bioin-formatics, 10: 421.
- Capella-Gutiérrez, S., Silla-Martínez, J.M. & Gabaldón, T. (2009). trimAl: a tool for automated alignment trimming in large-scale phylogenetic analyses. Bioinformatics, 25: 1972–1973.
- Coleman, A.W. (1999). Phylogenetic analysis of “Volvocacae” for comparative genetic studies. Proceedings of the National Academy of Sciences USA, 96: 13892–13897.
- Coleman, A.W. (2001). Biogeography and speciation in the Pandorina/Volvulina (Chlorophyta) superclade. Journal of Phycology, 37: 836–851.
- Coleman, A.W. (2012). A comparative analysis of the Volvocaceae (Chlorophyta). Journal of Phycology, 48: 491–513.
- Davidson, R., Vachaspati, P., Mirarab, S. & Warnow, T. (2015). Phylogenomic species tree estimation in the presence of incomplete lineage sorting and horizontal gene transfer. BMC Genomics, 16: S1.
- De Bie, T., Cristianini, N., Demuth, J.P. & Hahn, M.W. (2006). CAFE: a computational tool for the study of gene family evolution. Bioinformatics, 22: 1269–1271.
- De Clerck, O., Kao, S. M., Bogaert, K.A., Blomme, J., Foflonker, F., Kwantes, M., Vancaester, E., Vanderstraeten, L., Aydogdu, E., Boesger, J., Califano, G., Charrier, B., Clewes, R., Cortona, A.D., D’Hondt, S., Fernandez-Pozo, N., Gachon, C.M., Hanikenne, M., Lattermann, L., Leliaert, F., Liu, X., Maggs, C.A., Popper, Z.A., Raven, J.A., Bel, M.V., Wilhelmsson, P.K.I., Bhattacharya, D., Coates, J.C., Rensing, S.A., Straeten, D.V.D., Vardi, A., Sterck, L., Vandepoele, K., Peer, Y.V., Wichard, T. & Bothwell, J.H. (2018). Insights into the evolution of multicellularity from the sea lettuce genome. Current Biology, 28: 2921–2933.
- Degnan, J.H. & Rosenberg, N.A. (2006). Discordance of species trees with their most likely gene trees. PLoS Genetics, 2: e68.
- Degnan, J.H. & Rosenberg, N.A. (2009). Gene tree discordance, phylogenetic inference and the multispecies coalescent. Trends in Ecology and Evolution, 24: 332–340.
- Doolittle, W.F. (1999). Phylogenetic classification and the universal tree. Science, 284: 2124–2128.
- Emms, D.M. & Kelly, S. (2015). OrthoFinder: solving fundamental biases in whole genome comparisons dramatically improves orthogroup inference accuracy. Genome Biology, 16: 157.
- Featherston, J., Arakaki, Y., Hanschen, E.R., Ferris, P.J., Michod, R.E., Olson, B.J., Nozaki, H. & Durand, P.M. (2017). The 4-celled Tetrabaena socialis nuclear genome reveals the essential components for genetic control of cell number at the origin of multicellularity in the volvocine lineage. Molecular Biology and Evolution, 35: 855–870.
- Fu, L., Niu, B., Zhu, Z., Wu, S. & Li, W. (2012). CD-HIT: accelerated for clustering the next-generation sequencing data. Bioinformatics, 28: 3150–3152.
- Gernandt, D.S., Aguirre Dugua, X., Vázquez-Lobo, A., Willyard, A., Moreno Letelier, A., Pérez de la Rosa, J.A., Pinero, D. & Liston, A. (2018). Multi-locus phylogenetics, lineage sorting, and reticulation in Pinus subsection Australes. American Journal of Botany, 105: 711–725.
- Grabherr, M.G., Haas, B.J., Yassour, M., Levin, J.Z., Thompson, D.A., Amit, I., Adiconis, X., Fan, L., Raychowdhury, R., Zeng, Q., Chen, Z., Mauceli, E., Hacohen, N., Gnirke, A., Rhind, N., Palma, F., Birren, B.W., Nusbaum, C., Lindblad-Toh, K., Friedman, N. & Regev, A. (2011). Full-length transcriptome assembly from RNA-Seq data without a reference genome. Nature Biotechnology, 29: 644.
- Guisinger, M.M., Kuehl, J.V., Boore, J.L. & Jansen, R.K. (2008). Genome-wide analyses of Geraniaceae plastid DNA reveal unprecedented patterns of increased nucleotide substitutions. Proceedings of the National Academy of Sciences USA, 105: 18424–18429.
- Guo, Y.L. (2013). Gene family evolution in green plants with emphasis on the origination and evolution of Arabidopsis thaliana genes. The Plant Journal, 73: 941–951.
- Hahn, M.W., Demuth, J.P. & Han, S.G. (2007). Accelerated rate of gene gain and loss in primates. Genetics, 177: 1941–1949.
- Hallmann, A. (2011). Evolution of reproductive development in the volvocine algae. Sexual Plant Reproduction, 24: 97–112.
- Hamaji, T., Kawai-Toyooka, H., Uchimura, H., Suzuki, M., Noguchi, H., Minakuchi, Y., Toyoda, A., Fujiyama, A., Miyagishima, S., Umen, J.G. & Nozaki, H. (2018). Anisogamy evolved with a reduced sex-determining region in volvocine green algae. Communications Biology, 1: 17.
- Hanschen, E.R., Marriage, T.N., Ferris, P.J., Hamaji, T., Toyoda, A., Fujiyama, A., Neme, R., Noguchi, H., Minakuchi, Y., Suzuki, M., Kawai-Toyooka, H., Smith, D.R., Sparks, H., Anderson, J., Bakaric, R., Luria, V., Karger, A., Kirschner, M.W., Durand, P.M., Michod, R.E., Nozaki, H. & Olson, B.J.S.C. (2016). The Gonium pectorale genome demonstrates co-option of cell cycle regulation during the evolution of multicellularity. Nature Communications, 7: 11370.
- Hanschen, E.R., Herron, M.D., Wiens, J.J., Nozaki, H. & Michod, R.E. (2018). Repeated evolution and reversibility of self-fertilization in the volvocine green algae. Evolution, 72: 386–398.
- Hayama, M., Nakada, T., Hamaji, T. & Nozaki, H. (2010). Morphology, molecular phylogeny and taxonomy of Gonium maiaprilis sp. nov. (Goniaceae, Chlorophyta) from Japan. Phycologia, 49: 221–234.
- Herron, M.D. (2016). Origins of multicellular complexity: Volvox and the volvocine algae. Molecular Ecology, 25: 1213–1223.
- Herron, M.D. & Michod, R.E. (2008). Evolution of complexity in the volvocine algae: transitions in individuality through Darwin’s eye. Evolution, 62: 436–451.
- Herron, M.D., Hackett, J.D., Aylward, F.O. & Michod, R.E. (2009). Triassic origin and early radiation of multicellular volvocine algae. Proceedings of the National Academy of Sciences USA, 106: 3254–3258.
- Hillis, D.M. (1995). Approaches for assessing phylogenetic accuracy. Systematic Biology, 44: 3–16.
- Huynen, M.A. & Bork, P. (1998). Measuring genome evolution. Proceedings of the National Academy of Sciences USA, 95: 5849–5856.
- Jackson, C., Salomaki, E.D., Lane, C.E. & Saunders, G.W. (2017). Kelp transcriptomes provide robust support for interfamilial relationships and revision of the little known Arthrothamnaceae (Laminariales). Journal of Phycology, 53: 1–6.
- Johnson, M.G., Malley, C., Goffinet, B., Shaw, A.J. & Wickett, N.J. (2016). A phylotranscriptomic analysis of gene family expansion and evolution in the largest order of pleurocarpous mosses (Hypnales, Bryophyta). Molecular Phylogenetics and Evolution, 98: 29–40.
- Katoh, K. & Standley, D.M. (2013). MAFFT multiple sequence alignment software version 7: improvements in performance and usability. Molecular Biology and Evolution, 30: 772–780.
- Kato-Minoura, T., Karino, K., Akimoto, N., Yoshiga, N., Ehara, M. & Aoki, S. (2015). Phylogenetic analysis of NAP, an unconventional actin of the Volvocales. Plant Systematics and Evolution, 301: 1725–1733.
- Kim, S., Cho, Y. S., Kim, H. M., Chung, O., Kim, H., Jho, S., Seomum, H., Kim, J., Bang, W. Y., Kim, C., An, J., Bae, C., Bhak, Y., Jeon, S., Yoon, H., Kim, Y., Jun, J., Lee, H., Cho, S., Uphyrkina, O., Kostyria, A., Goodrich, J., Miquelle, D., Roelke, M., Lewis, J., Yurchenko, A., Bankevich, A., Cho, J., Lee, S., Edwards, J.S., Weber, J.A., Cook, J., Kim, S., Lee, H., Manica, A., Lee, I., O’Brien, S.J., Bhak, J. & Yeo, J.H. (2016). Comparison of carnivore, omnivore, and herbivore mammalian genomes with a new leopard assembly. Genome Biology, 17: 211.
- King, N., Westbrook, M.J., Young, S.L., Kuo, A., Abedin, M., Chapman, J., Fairclough, S., Hellsten, U., Isogai, Y., Letunic, I., Marr, M., Pincus, D., Putnam, N., Rokas, A., Wright, K.J., Zuzow, R., Dirks, W., Good, M., Goodstein, D., Lemons, D., Li, W., Lyons, J.B., Morris, A., Nichols, S., Richter, D.J., Salamov, A., JGI Sequencing, Bork, P., Lim, W.A., Manning, G., Miller, W.T., McGinnis, W., Shapiro, H., Tjian, R., Grigoriev, I.V. & Rokhsar, D. (2008). The genome of the choanoflagellate Monosiga brevicollis and the origin of metazoans. Nature, 451: 783.
- Kirk, D.L. (2005). A twelve-step program for evolving multicellularity and a division of labor. BioEssays, 27: 299–310.
- Knoll, A.H. (2011). The multiple origins of complex multicellularity. Annual Review of Earth and Planetary Sciences, 39: 217–239.
- Koonin, E.V. (2005). Orthologs, paralogs, and evolutionary genomics. Annual Reviews of Genetics, 39: 309–338.
- Lanfear, R., Frandsen, P.B., Wright, A.M., Senfeld, T. & Calcott, B. (2016). PartitionFinder 2: new methods for selecting partitioned models of evolution for molecular and morphological phylogenetic analyses. Molecular Biology and Evolution, 34: 772–773.
- Lavrov, D.V., Forget, L., Kelly, M. & Lang, B.F. (2005). Mitochondrial genomes of two demosponges provide insights into an early stage of animal evolution. Molecular Biology and Evolution, 22: 1231–1239.
- Leliaert, F., Smith, D.R., Moreau, H., Herron, M.D., Verbruggen, H., Delwiche, C.F. & De Clerck, O. (2012). Phylogeny and molecular evolution of the green algae. Critical Reviews in Plant Sciences, 31: 1–46.
- Lenski, R.E., Ofria, C., Pennock, R.T. & Adami, C. (2003). The evolutionary origin of complex features. Nature, 423: 139.
- Maddison, W.P. (1997). Gene trees in species trees. Systematic Biology, 46: 523–536.
- Mallo, D. & Posada, D. (2016). Multilocus inference of species trees and DNA barcoding. Philosophical Transactions of the Royal Society B: Biological Sciences, 371: 20150335.
- Mirarab, S. (2019). Species tree estimation using ASTRAL: practical considerations. arXiv preprint arXiv: 1904.03826.
- Mirarab, S., Reaz, R., Bayzid, M.S., Zimmermann, T., Swenson, M.S. & Warnow, T. (2014). ASTRAL: genome-scale coalescent-based species tree estimation. Bioinformatics, 30: i541–i548.
- Mistry, J., Finn, R.D., Eddy, S.R., Bateman, A. & Punta, M. (2013). Challenges in homology search: HMMER3 and convergent evolution of coiled-coil regions. Nucleic Acids Research, 41: e121.
- Nakada, T., Tomita, M. & Nozaki, H. (2010). Volvulina compacta (Volvocaceae, Chlorophyceae), new to Japan, and its phylogenetic position. Journal of Japanese Botany, 85: 364–369.
- Nozaki, H., Itoh, M., Watanabe, M. M. & Kuroiwa, T. (1996). Ultrastructure of the vegetative colonies and systematic position of Basichlamys (Volvocales, Chlorophyta). European Journal of Phycology, 31: 67–72.
- Nozaki, H., Ito, M., Sano, R., Uchida, H., Watanabe, M.M., Takahashi, H. & Kuroiwa, T. (1997a). Phylogenetic analysis of Yamagishiella and Platydorina (Volvocaceae, Chlorophyta) based on rbcL gene sequences. Journal of Phycology, 33: 272–278.
- Nozaki, H., Ito, M., Uchida, H., Watanabe, M.M. & Kuroiwa, T. (1997b). Phylogenetic analysis of Eudorina species (Volvocaceae, Chlorophyta) based on rbcL gene sequences. Journal of Phycology, 33: 859–863.
- Nozaki, H., Song, L., Liu, Y., Hiroki, M. & Watanabe, M. M. (1998). Taxonomic re-examination of a Chinese strain labeled ‘Eudorina sp.’ (Volvocaceae, Chlorophyta) based on morphological and DNA sequence data. Phycological Research, 46: 63–70.
- Nozaki, H., Misawa, K., Kajita, T., Kato, M., Nohara, S. & Watanabe, M.M. (2000). Origin and evolution of the colonial Volvocales (Chlorophyceae) as inferred from multiple, chloroplast gene sequences. Molecular Phylogenetics and Evolution, 17: 256–268.
- Nozaki, H., Ott, F.D. & Coleman, A.W. (2006). Morphology, molecular phylogeny and taxonomy of two new species of Pleodorina (Volvoceae, Chlorophyceae). Journal of Phycology, 42: 1072–1080.
- Nozaki, H., Yamada, T.K., Takahashi, F., Matsuzaki, R. & Nakada, T. (2014). New “missing link” genus of the colonial volvocine green algae gives insights into the evolution of oogamy. BMC Evolutionary Biology, 14: 37.
- Nozaki, H., Matsuzaki, R., Yamamoto, K., Kawachi, M. & Takahashi, F. (2015). Delineating a new heterothallic species of Volvox (Volvocaceae, Chlorophyceae) using new strains of “Volvox africanus”. PLoS ONE, 10: e0142632.
- Nozaki, H. (1983). Morphology and taxonomy of two species of Astrephomene (Chlorophyta, Volvocales) in Japan. Journal of Japanese Botany, 58: 345–352.
- Nozaki, H. & Coleman, A.W. (2011). A new species of Volvox sect. Merrillosphaera (Volvocaceae, Chlorophyceae) from Texas. Journal of Phycology, 47: 673–679.
- Nozaki, H. & Itoh, M. (1994). Phylogenetic relationships within the colonial Volvocales (Chlorophyta) inferred from cladistic analysis based on morphological data. Journal of Phycology, 30: 353–365.
- Nozaki, H. & Kuroiwa, T. (1992). Ultrastructure of the extracellular matrix and taxonomy of Eudorina, Pleodorina and Yamagishiella gen. nov. (Volvocaceae, Chlorophyta). Phycologia, 31: 529–541.
- Nozaki, H. & Ohtani, S. (1992). Gonium sociale (Volvocales, Chlorophyta) from Antarctica. Japanese Journal of Phycology, 40: 267–271.
- Pamilo, P. & Nei, M. (1988). Relationships between gene trees and species trees. Molecular Biology and Evolution, 5: 568–583.
- Parfrey, L.W. & Lahr, D.J. (2013). Multicellularity arose several times in the evolution of eukaryotes. Bioessays, 35: 339–347.
- Philip, J., Binns, D., Chang, H., Fraser, M., Li, W., McAnulla, C., McWilliam, H., Maslen, J., Mitchell, A., Nuka, G., Pesseat, S., Quinn, A.F., Sangrador-Vegas, A., Scheremetjew, M., Yong, S., Lopez, R. & Hunter, S. (2014). InterProScan 5: genome-scale protein function classification. Bioinformatics, 30: 1236–1240.
- Prachumwat, A. & Li, W.H. (2008). Gene number expansion and contraction in vertebrate genomes with respect to invertebrate genomes. Genome Research, 18: 221–232.
- Prochnik, S.E., Umen, J., Nedelcu, A.M., Hallmann, A., Miller, S.M., Nishii, I., Ferris, P., Kuo, A., Mitros, T., Fritz-Laylin, L.K., Hellsten, U., Chapman, J., Simakov, O., Rensing, S.A., Terry, A., Pangilinan, J., Kapitonov, V., Jurka, J., Salamov, A., Shapiro, H., Schmutz, J., Grimwood, J., Lindquist, E., Lucas, S., Grigoriev, V., Schmitt, R., Kirk, D. & Rokhsar, D.S. (2010). Genomic analysis of organismal complexity in the multicellular green alga Volvox carteri. Science, 329: 223–226.
- Proeschold, T., Darienko, T., Krienitz, L. & Coleman, A.W. (2018). Chlamydomonas schloesseri sp. nov. (Chlamydophyceae, Chlorophyta) revealed by morphology, autolysin cross experiments, and multiple gene analyses. Phytotaxa, 362: 21–38.
- Qiu, H., Price, D.C., Yang, E.C., Yoon, H.S. & Bhattacharya, D. (2015). Evidence of ancient genome reduction in red algae (Rhodophyta). Journal of Phycology, 51: 624–636.
- Rokas, A., Krüger, D. & Carroll, S.B. (2005). Animal evolution and the molecular signature of radiations compressed in time. Science, 310: 1933–1938.
- Ronquist, F., Teslenko, M., Mark, P.V.D., Ayres, D.L., Darling, A., Höhna, S., Larget, B., Liu, L., Suchard, M.A. & Huelsenbeck, J.P. (2012). MrBayes 3.2: efficient Bayesian phylogenetic inference and model choice across a large model space. Systematic Biology, 61: 539–542.
- Ruvolo, M. (1997). Molecular phylogeny of the hominoids: inferences from multiple independent DNA sequence data sets. Molecular Biology and Evolution, 14: 248–265.
- Sang, T. (2002). Utility of low-copy nuclear gene sequences in plant phylogenetics. Critical Reviews in Biochemistry and Molecular Biology, 37: 121–147.
- Simão, F.A., Waterhouse, R.M., Ioannidis, P., Kriventseva, E.V. & Zdobnov, E.M. (2015). BUSCO: assessing genome assembly and annotation completeness with single-copy orthologs. Bioinformatics, 31: 3210–3212.
- Smith, S.A. & Dunn, C.W. (2008). Phyutility: a phyloinformatics tool for trees, alignments and molecular data. Bioinformatics, 24: 715–716.
- Srivastava, M., Simakov, O., Chapman, J., Fahey, B., Gauthier, E.A.M., Mitros, T., Richards, S.G., Conaco, C., Dacre, M., Hellsten, U., Larroux, C., Putnam, H.N., Stanke, M., Adamska, M., Darling, A., Degnan, M.S., Oakley, H.T., Plachetzki, C.D., Zhai, Y., Adamski, M., Calcino, A., Cummins, F.S., Goodstein, M.D., Harris, C., Jackson, J.D., Leys, P.S., Shu, S., Woodcroft, J.B., Vervoort, M., Kosik, S.K., Manning, G., Degnan, M.B. & Rokhsar, S.D. (2010). The Amphimedon queenslandica genome and the evolution of animal complexity. Nature, 466: 720.
- Stamatakis, A. (2014). RAxML version 8: a tool for phylogenetic analysis and post-analysis of large phylogenies. Bioinformatics, 30: 1312–1313.
- Umen, J.G. (2014). Green algae and the origins of multicellularity in the plant kingdom. Cold Spring Harbor Perspectives in Biology, 6: a016170.
- Wertheim, J.O., Murrell, B., Smith, M.D., Kosakovsky Pond, S.L. & Scheffler, K. (2014). RELAX: detecting relaxed selection in a phylogenetic framework. Molecular Biology and Evolution, 32: 820–832.
- Wickett, N.J., Mirarab, S., Nguyen, N., Warnow, T., Carpenter, E., Matasci, N., Ayyampalayam, S., Barker, M.S., Burleigh, J.G., Gitzendanner, M.A., Ruhfel, B.R., Wafula, E., Der, J.P., Graham, S.W., Mathews, S., Melkonian, M, Soltis, D.E., Soltis, P.S., Miles, N.W., Rothfels, C.J., Pokorny, L., Shaw, A.J., DeGironimo, L., Stevenson, D.W., Surek, B., Villarreal, J.C., Roure, B., Philippe, H., dePamphilis, C.W., Chen, T., Deyholos, M.K., Baucom, R.S., Kutchan, T.M., Augustin, M.M., Wang, J., Zhang, Y., Tian, Z., Yan, Z., Wu, X., Sun, X., Wong, G.K. & Leebens-Mack, J. (2014). Phylotranscriptomic analysis of the origin and early diversification of land plants. Proceedings of the National Academy of Sciences USA, 111: E4859–E4868.
- Wolf, Y.I., Rogozin, I.B., Grishin, N.V. & Koonin, E.V. (2002). Genome trees and the tree of life. Trends in Genetics, 18: 472–479.
- Wortley, A.H., Rudall, P.J., Harris, D.J. & Scotland, R.W. (2005). How much data are needed to resolve a difficult phylogeny? Case study in Lamiales. Systematic Biology, 54: 697–709.
- Yamada, T.K., Miyaji, K. & Nozaki, H. (2008). A taxonomic study of Eudorina unicocca (Volvocaceae, Chlorophyceae) and related species, based on morphology and molecular phylogeny. European Journal of Phycology, 43: 317–326.
- Yang, Z. (1998). Likelihood ratio tests for detecting positive selection and application to primate lysozyme evolution. Molecular Biology and Evolution, 15: 568–573.
- Yang, Z. (2007). PAML 4: phylogenetic analysis by maximum likelihood. Molecular Biology and Evolution, 24: 1586–1591.
- Yu, G., Wang, L.G., Han, Y. & He, Q.Y. (2012). clusterProfiler: an R package for comparing biological themes among gene clusters. OMICS: a Journal of Integrative Biology, 16: 284–287.
- Zhang, C., Rabiee, M., Sayyari, E. & Mirarab, S. (2018). ASTRAL-III: polynomial time species tree reconstruction from partially resolved gene trees. BMC Bioinformatics, 19: 153.
- Zhang, J. (2003). Evolution by gene duplication: an update. Trends in Ecology and Evolution, 18: 292–298.
- Zhang, Z., Qu, C., Yao, R., Nie, Y., Xu, C., Miao, J. & Zhong, B. (2019). The parallel molecular adaptations to the Antarctic cold environment in two psychrophilic green algae. Genome Biology and Evolution, 11: 1897–1908.
- Zhen, Y. & Ungerer, M.C. (2008). Relaxed selection on the CBF/DREB1 regulatory genes and reduced freezing tolerance in the southern range of Arabidopsis thaliana. Molecular Biology and Evolution, 25: 2547–2555.
- Zou, J., Yue, W., Li, L., Wang, X., Lu, J., Duan, B. & Liu, J. (2016). DNA barcoding of recently diversified tree species: a case study on spruces based on 20 DNA fragments from three different genomes. Trees, 30: 959–969.