
 ?Mathematical formulae have been encoded as MathML and are displayed in this HTML version using MathJax in order to improve their display. Uncheck the box to turn MathJax off. This feature requires Javascript. Click on a formula to zoom.
ABSTRACT
Arthrospira are multicellular cyanobacteria that typically reside in alkaline lakes of (sub)tropical regions and are mass cultivated around the globe in a variety of outdoor facilities and photobioreactors for their high nutritional, pharmaceutical and clinical value. Arthrospira sp. strain PCC 8005 was selected by the European Space Agency as an oxygen producer and nutritional end-product in a bioregenerative life support system for long-haul missions. Being highly resistant to ionizing radiation, it is also an ideal candidate for other space applications such as in situ resource utilization and terraformation. During long-term strain maintenance involving continuous subculturing we noted an irreversible morphological change in PCC 8005 subcultures i.e. from only helical to only straight trichomes. These morphotypes displayed differences in growth rate, buoyancy and resistance to gamma radiation. We also found marked differences in antioxidant capacity, pigment content and trehalose concentration, while whole-genome comparison revealed a difference of 168 SNPs, 48 indels and four large insertions affecting, in total, 41 coding regions across both genomes. Although nine of these regions encoded proteins with a known function, no conclusive genotype-phenotype associations could be determined. Nonetheless, genomic changes within the gvpC gene (encoding a gas vesicle protein) and within the regulatory region of the psbD gene (encoding the D2 protein of PSII) provided some clues for the observed differences in buoyancy and growth.
Introduction
The genus Arthrospira consists of oxygenic photoautotrophic prokaryotes (cyanobacteria) with considerable commercial value owing to their excellent properties as nutraceuticals and their many pharmaceutical and medical applications (Ciferri, Citation1983; Karkos et al., Citation2011; Hosseini et al., Citation2013; Sotiroudis & Sotiroudis, Citation2013; Wu et al., Citation2016; Furmaniak et al., Citation2017). Arthrospira species are characterized by multicellular cylindrical trichomes most commonly found in helical form (Tomaselli, Citation1997; Sili et al., Citation2012). Owing to their natural appearance as small green coils they are known as ‘spirulina’ which also is the commonly used commercial name for all mass-produced Arthrospira. However, they are only distantly related to the true Spirulina, a genus whose members also form helical trichomes but is very different according to all phylogenetic and cytological criteria, which place Spirulina in the Spirulinales while Arthrospira belongs to the Oscillatoriales (Komárek et al., Citation2014). Making use of pangenomic taxonomic signatures for a large set of publicly available cyanobacterial genomes, strain PCC 8005 was designated as the type strain for a new species named Arthrospira nitrilium (Walter et al., Citation2017), opening up a fresh discourse on Arthrospira taxonomy. Recently, mass-produced Arthrospira have been placed into a new genus, Limnospira, mainly based on 16S rRNA phylogenetic analysis but also taking into account morphological and ecological data (Nowicka-Krawczyk et al., Citation2019), further fuelling the complex debate among cyanobacterial taxonomists on the true position of the genus Arthrospira and its current member species.
Variations in Arthrospira trichome geometry and morphology have been observed under various environmental conditions including nutrient availability, temperature, UV spectrum and salinity (Jeeji Bai & Seshadri, Citation1980; Lewin, Citation1980; Van Eykelenburg, Citation1980; Jeeji Bai, Citation1985; Mühling et al., Citation2003, Citation2006; Wang & Zhao, Citation2005; Wu et al., Citation2005; Hongsthong et al., Citation2007; Gao et al., Citation2008; Sili et al., Citation2012). Notwithstanding a history of frequent observations in the laboratory and in large-scale culturing of shifts between straight and helical forms of Arthrospira, the mechanism for this morphological change remains enigmatic. However, a constant in these observations was that once an Arthrospira strain converted to the straight form it consistently failed to convert back to the helical form unless very specific growth conditions were provided, and even then this reversion seemed rather rare and happened only for some strains (Wang & Zhao, Citation2005). The variable irreversibility of this morphological switch has led researchers to suggest the occurrence of mutations either arising spontaneously or brought about by environmental factors (Jeeji Bai, Citation1985; Wang & Zhao, Citation2005; Hongsthong et al., Citation2007). Besides the significance of this morphological switch in terms of the organism's metabolic and physiological behaviour, and the implications of morphological transformations for Arthrospira taxonomy, an uncontrolled change of helicity to linearity might also impact the innovative use of helical Arthrospira trichome biotemplates in the fabrication of biomedical and microelectronic devices (Kamata et al., Citation2014; Hu et al., Citation2018; Wang et al., Citation2019).
Arthrospira have a high nutritive value and a broad spectrum of pharmaceutical and medical applications (Ciferri, Citation1983; Karkos et al., Citation2011; Hosseini et al., Citation2013; Sotiroudis & Sotiroudis, Citation2013; Wu et al., Citation2016; Furmaniak et al., Citation2017). Arthrospira are also deployed in the fields of space research and exploration (Hendrickx et al., Citation2006), the production of high-value products including unique peptides (Ji et al., Citation2018; Ovando et al., Citation2018), biofuels (Ainas et al., Citation2017; Rahman et al., Citation2017), bioelectricity (Lin et al., Citation2013), radioprotectors (Zhang et al., Citation2001; Chen & Zhou, Citation2003) and biosorbents for the removal of heavy metals and radionuclides from contaminated environments (Kumar et al., Citation2015; Sadovsky et al., Citation2016).
In our laboratory we are studying the physiology and the genomic stability of Arthrospira sp. PCC 8005, a strain chosen by the European Space Agency (ESA) as an oxygen producer and as a nutritional end-product of the Micro-Ecological Life Support System Alternative (MELiSSA) (Hendrickx et al., Citation2006). In the course of these studies we investigated the effects of challenging growth conditions for Arthrospira, including continuous intense high light, high levels of ammonia, low and high temperatures and various forms of ionizing radiation (IR). To our surprise we found that Arthrospira sp. PCC 8005 could withstand very high cumulative doses of 60Co gamma irradiation of up to 5000 Gy (Badri et al., Citation2015a, Citation2015b). To put this into perspective, a mean whole-body dose of 6–8 Gy of 60Co -generated gamma radiation over a short period (hours) will almost certainly kill a human adult (http://www.unscear.org). Gamma rays carry the most energetic photons in the electromagnetic spectrum and are extremely damaging to living organisms, either by direct interaction with cellular molecules or via the generation of radicals (Riley, Citation1994; Reisz et al., Citation2014). In aqueous environments, the majority of such radicals are hydroxyl radicals (•OH) and other reactive oxygen species (ROS) including the superoxide anion (O2•¯) and hydrogen peroxide (H2O2). When the production rate of ionizing radiation-induced ROS exceeds the ROS detoxification rate, cell growth is impaired owing to ROS-mediated damage to nucleic acids, cell membranes and proteins (Imlay, Citation2013; Reisz et al., Citation2014; Ezraty et al., Citation2017). This of course depends on the organism’s capability to produce effective antioxidant enzymes and antioxidants, but temperature, oxygen concentration, cell density and composition of growth medium also play a role (Shuryak et al., Citation2017). Although much research in regard to bacterial resistance to ionizing radiation (IR) has been performed on the bacterium Deinococcus radiodurans from its first isolation in 1956 onwards (reviewed by Cox & Battista, Citation2005), the list of bacteria (including many cyanobacteria) and archaea with a comparable extreme radioresistance to IR has been growing steadily (Beblo et al., Citation2011; Confalonieri & Sommer, Citation2011; Yu et al., Citation2013; Battista, Citation2016; Pavlopoulou et al., Citation2016; Singh, Citation2018).
Recent studies have shown that the exposure of Arthrospira to moderately high doses of 60Co gamma irradiation (up to 2.0–2.5 kGy) can have a positive effect on its metabolic activity and cellular growth (Moussa et al., Citation2015; Abomohra et al., Citation2016; Shabana et al., Citation2017). Moreover, an increase in growth-relevant metabolic pathways (e.g. pigments, nucleotides) were observed in mutant Arthrospira platensis ZJU9000 in response to 9 kGy of gamma radiation (Cheng et al., Citation2018).
Our direct interests in the IR resistance of Arthrospira, besides its applications in space (Hendrickx et al., Citation2006; Olsson-Francis & Cockell, Citation2010; Menezes et al., Citation2015; Verseux et al., Citation2016), are twofold. First, we envisage that Arthrospira could be excellent cell factories for the production of potent antioxidants or novel ROS-detoxifying enzymes applicable in radioprotection. The fact that Arthrospira sp. PCC8005 is edible and in 2002 received GRAS (Generally Recognized as Safe) status from the US Food & Drug Administration (reviewed by Furmaniak et al., Citation2017 and references therein) is an important asset because it can be easily administered in dry powder form or as tablets for therapeutic or prophylactic radioprotective purposes. Second, the IR resistance of Arthrospira combined with its excellent biosorbence for a range of heavy metals and radionuclides (Kumar et al., Citation2015; Sadovsky et al., Citation2016), including uranium fission products (Vanhoudt et al., Citation2018), make this organism a prime candidate for the bioremediation of radioactively contaminated environments.
During our research, one of our subcultures of the strain Arthrospira sp. PCC 8005 displayed linear trichomes after about 18 months of continuous reculturing for strain maintenance under controlled laboratory conditions. This rapidly became the dominant and only morphological form in the subsequent line of subcultures. In spite of several attempts to obtain reversion to the original helical form by testing various growth conditions, this morphological change was irreversible. We decided to investigate the differences between the separately maintained helical form (designated P6) and the new linear form (designated P2) in terms of cellular composition and physiology as well as the response of these two strains to gamma irradiation. Specifically, we investigated the antioxidant activities, glutathione content, pigment production and trehalose concentrations of both sub-strains in response to gamma irradiation, because our earlier work showed that gamma radiation induced some of the key genes needed to establish these cellular defences (Badri et al., Citation2015a, Citation2015b). In addition, we obtained the full genome sequences for the P2 and P6 subculture lines (both of 2018 vintage) and performed a comparative sequence analysis between these sequences and the genome sequence of Arthrospira sp. PCC 8005 strain previously determined by us (Janssen et al., Citation2010; Morin et al., Citation2010). To our knowledge this is the first report in which two Arthrospira morphotypes of the same strain have been studied in detail at the genomic level.
Materials and methods
Strains and growth of cultures
The Arthrospira sp. strain PCC8005 we are currently studying was obtained from the Pasteur Cyanobacterial Collection (PCC) (Institute Pasteur, Paris, France) in April 2012 and upon arrival aliquoted into four separate cultures, named P1 to P4. Subsequently (our logbook indicates at the second round of maintenance), these subcultures were further divided for logistical reasons i.e. P5 from P1, P6 from P2, P7 from P3 and P8 from P4, and were maintained as separate axenic cultures under standard growth conditions by the same experienced lab technician (Supplementary file 1, Supplementary fig. S1). Because long-term preservation methods for Arthrospira are still highly problematic (Motham et al., Citation2012; Shiraishi, Citation2016) and there are no reliable preservation methods available yet for Arthrospira sp. strain PCC 8005, this maintenance involves continuous subculturing at regular intervals. All experiments in this study were performed on P2 and P6, both originating from the same ‘mother culture’ of April 2012 and originally both exclusively consisting of helical morphotypes. The morphological change (helical to straight) in the P2 line of subcultures was observed in October 2013 (Supplementary fig. S1). This change occurred gradually, at first, resulting in a mixed culture with both morphotypes present for several weeks until eventually the P2 culture line consisted uniformly of straight trichomes, and the helical morphotype appeared to have been lost. Since 2012, any experiment in our laboratory using strain PCC 8005 depended on a new subculture of the P5–P8 series. Such cultures were always grown in triplicate and thoroughly checked for axenicity and morphology prior to the experiment. It is important to note that microarray-based gene expression analysis (Badri et al., Citation2015a, Citation2015b) only used cultures of the helical form. However, it is equally important to note that the genome sequence we published almost a decade ago (Janssen et al., Citation2010), and which has been updated since to a final assembly of six large ordered contigs (v5, see below) and fully annotated (unpublished; all data presented in the MaGe platform – http://www.genoscope.cns.fr/agc/microscope/mage/), was done on DNA extracted in 2009 from an older culture of PCC 8005 originally obtained in 2003 from the Pasteur Cyanobacterial Collection (Morin et al., Citation2010) (Supplementary fig. S1). As this older strain unfortunately became contaminated over the subsequent years of subculturing, the PCC 8005 strain was reordered in 2012 from PCC, resulting in the P1–P8 lines as described earlier. The tiling microarrays previously used by us (Badri et al., Citation2015a, Citation2015b) were designed on the basis of this genome sequence (v5) (ARTHROv5 – updated version 5 of 15 February 2014, available at NCBI under GenBank assembly accession number GCA_000973065.1).
Typically, Arthrospira experimental cultures in our laboratory were grown in 200 ml volume at a constant temperature of 30°C in a Binder KBW400 growth chamber (Analis SA, Namur, Belgium), using a Heidolph Unimax 2010 rotatory shaker (Analis SA, Namur, Belgium) at 121 rpm and a photon irradiance of 45 µmol photons m–2 s–1 produced by Osram Daylight fluorescent tubes. Cell growth was routinely monitored in Zarrouk medium (pH ~9.8) (Cogne et al., Citation2003) until an optical density (OD) of 1.0 was reached at 750 nm using a Genesys UV-Vis spectrophotometer (Thermofisher Scientific, Merelbeke, Belgium). For our studies, cultures were typically divided into six 30 ml samples per test condition, of which three served as references (e.g. non-irradiated controls) and three were experimental (e.g. exposed to gamma irradiation). Exposure tests were done using 50 ml conical-bottom polypropylene centrifuge tubes (BD Biosciences, Erembodegem, Belgium).
Growth rates of Arthrospira cultures were calculated as described before (Lee et al., Citation2015) using 500 µl of fresh inocula in 16 ml of Zarrouk medium, with the following formula:
Where X is the OD750 measured at a given time point, time t1 corresponds to the 2nd day after growth, and time t2 corresponds to the 14th day after growth.
For all biochemical assays, growth in terms of OD750 versus dry weight was used for normalization purposes (Supplementary figs S2, S3 and Supplementary tables S3–S5).
Gamma ray irradiation
Axenic cultures of strains P2 (straight trichomes) and P6 (helical trichomes) were exposed to a high dose rate of gamma radiation (600 Gy h–1) in the RITA facility of SCK•CEN using a 60Co gamma radiation source (Fernandez et al., Citation2002) and samples were collected at 1h 30 min, 3h 30 min and 8h 20 min, corresponding to cumulative irradiation doses of respectively 900 Gy, 2100 Gy and 5000 Gy.
Three replicates of 30 ml (see preceding section) were irradiated in the dark at a controlled temperature of 26°C and an air pressure of 150 kPa. The elevated pressure is a safety measure to avoid any leakage of water into the vessel when it is submerged almost 6 m under water for exposure to the 60Co source located at the bottom of the reservoir. During the irradiation experiment, one set of non-irradiated controls for all three doses was kept in the dark under laboratory conditions (30°C and 100 kPa air pressure). After each irradiation dose, samples were transported back to the laboratory on ice. For every assay to be performed, 5 ml aliquots of each radiated and non-irradiated culture were separately centrifuged on a Beckman–Coulter Avanti J-30I centrifuge (Analis SA, Namur, Belgium) for 15 min at 10000 × g at 4°C. After discarding all liquid, cell pellets were flash frozen in liquid nitrogen and stored at −80°C until further analysis.
Post-irradiation recovery and growth rate
In order to investigate the ability of the Arthrospira cells to recover from different doses of gamma irradiation, 0.5 ml of irradiated or non-irradiated culture (OD750 = 1.0) were grown in 16 ml of fresh Zarrouk media in T-75 tissue flasks (Thermofisher Scientific). All cultures were grown as three independent replicates per test condition under the standard laboratory conditions cited earlier in the methods. Recovery was followed for each culture by OD750 measurements taken approximately every 2 days (actual times noted) for 24 days. The proliferation curves were plotted as OD750 increase versus time using Graphpad prism v7 (GraphPad Software, La Jolla, California, USA – www.graphpad.com).
Total antioxidant capacity (TAC) assay
Total antioxidant capacities were determined as previously described (Kerchev & Ivanov, Citation2008; Peñarrieta et al., Citation2008). The frozen pellet of a 5 ml culture was mixed with an extraction solution of 0.01 N HCl in the presence of 1 mM Na-EDTA (Sigma-Aldrich, Overijse, Belgium) at pH 1.7. Cell rupture was achieved by five cycles of freezing in liquid nitrogen and thawing at 37°C. After centrifugation at 10 000 × g (MiniSpin Eppendorf centrifuge), the supernatant containing the hydrophilic, low-molecular weight antioxidants was collected. Acetone of 100% purity (Sigma-Aldrich) was used to extract the lipophilic fraction of the remaining pellet.
To investigate if antioxidant components contributed to the variable ability of the strains P2 and P6 to cope with ionizing radiation (IR), we performed a total antioxidant assay for both strains before and after exposure to IR. The Ferric Reducing Antioxidant Power (FRAP) method we used determines the antioxidant potential of the water-soluble (hydrophilic) and non-soluble (lipophilic) cell fractions by spectrophotometrically recording the reduction of ferric iron (Fe3+) to ferrous iron (Fe2+) (Benzie & Strain, Citation1999; Hossain et al., Citation2016). The water-soluble, low molecular fraction in the crude extract includes phycocyanin, allophycocyanin and other principal antioxidants while the lipophilic fraction includes the various carotenoids, chlorophyll and phenolic complexes.
The antioxidant capacity of the extract was measured by the reduction of the FRAP reagent (2,4,6-Tris[2-pyridyl]-s-triazine) (Sigma-Aldrich) and time-wise spectrophotometric measurement (BMG Labtech CLARIOstar, Isogen LifeScience, De Meern, the Netherlands) of the reduced FRAP at 593 nm according to the original method (Benzie & Strain, Citation1999) with some modifications (Hossain et al., Citation2016). The reaction was done on 10 µl of extract with 150 µl of FRAP reagent in a 200 µl reaction volume. The final concentration of the antioxidant was measured with respect to the standard curve obtained for Trolox (6-hydroxy-2,5,7,8-tetramethylchromane-2-carboxylic acid) (Sigma-Aldrich), a water-soluble derivative of vitamin E. All TAC results were expressed in µmoles Trolox-equivalent mg−1 fresh weight (µmol TE mg FW−1).
Glutathione assay
The non-ribosomal thiol tripeptide glutathione and its analogues have an important ROS-detoxifying function in many prokaryotes including cyanobacteria (Smirnova & Oktyabrsky, Citation2005; Fahey, Citation2013; Narainsamy et al., Citation2016). Because a mutant strain of Synechocystis sp. PCC 6803 lacking the glutathione synthetase-encoding gene gshB (and hence unable to produce reduced glutathione) was found to be very sensitive to oxidative stress (Cameron & Pakrasi, Citation2010), and because our earlier work had shown that the expression of the gshB gene in strain PCC 8005 was strongly induced by 60Co gamma irradiation (Badri et al., Citation2015a, Citation2015b), we decided to monitor glutathione levels in P2 and P6 substrains of PCC 8005. The glutathione assay was performed as described previously (Badri et al., Citation2015a). Deep-frozen cell pellets of a 4 ml culture were thawed on ice. Cell lysis was achieved by sonicating the cells in acidic buffer of 0.2 N HCl (Merck, Darmstadt, Germany). The extracted supernatant was mixed with NaH2PO4 (pH 5.6) (Merck) and the final pH was adjusted to ~5.0 by adding an appropriate amount of 0.2 N NaOH (Merck). The total glutathione content (i.e. reduced and oxidized glutathione GSH+GSSG) was determined by monitoring the reduction of Ellman’s reagent (5,5′-dithiobis[2-nitrobenzoic acid], DTNB) (Sigma-Aldrich), which measures the concentration of thiol groups, at 412 nm in the presence of 10 mM NADPH (Apollo Scientific, Bredbury, UK) and glutathione reductase (Sigma Aldrich). The oxidized form GSSG was measured by blocking the reduced form GSH with 2-vinyl pyridine (Sigma-Aldrich). Total glutathione and the GSH/GSSG ratio were calculated by formulas [2] and [3], respectively:
Pigments and carotenoids
Frozen biomass of a 4 ml culture with OD750 ~1 was used to extract pigments and carotenoids in two separate assays. Carotenoid content was measured as reported elsewhere (Abomohra et al., Citation2016). The extraction was performed in 100% methanol (Sigma-Aldrich) by heating the cells on a block heater (Grant QBT2 Digital, ThermoFisher Scientific) at 55°C for 15 mins, and the natural absorbance of the supernatant was measured as OD at 452 nm, 665 nm and 650 nm using a CLARIOstar microplate reader (BMG Labtech, Isogen LifeScience) in the total absence of light. The total content of carotenoids (CAR) was calculated using the following formula:
where A452, A665 and A650 are the spectrophotometrically measured absorbance values at 452, 665 and 650 nm, respectively.
The pigments were measured as described previously (Badri et al., Citation2015b). Extractions of phycocyanin (PC) and allophycocyanin (APC) were performed in Na2HPO4 buffer (Merck) at pH 7.0 with cell rupture achieved by five cycles of freezing in liquid nitrogen and thawing at ambient temperature, with complete lysis achieved by the addition of 100 mg ml–1 lysozyme (Sigma-Aldrich). The supernatant was measured for phycocyanin and allophycocyanin contents at absorbances of 615 and 652 nm, respectively, using a CLARIOstar microplate reader (BMG Labtech, Isogen LifeScience) in the total absence of light. The concentration of PC and APC was measured according to the following formula:
where A615 and A652 are the spectrophotometrically measured absorbance values at 615 and 652 nm, respectively.
The remaining pellet was washed three times with 50 mM Na2HPO4 at a pH of 7.0 and total chlorophyll was extracted in complete darkness by sonicating the pellet in 100% methanol. The chlorophyll concentration in the supernatant was measured using the formula:
where A665 is the spectrophotometrically measured absorbance value at 665 nm.
Trehalose content determination
The disaccharide trehalose is present in many organisms, playing a role in signalling, carbohydrate storage and various stress responses (Elbein et al., Citation2003; Klähn & Hagemann, Citation2011). Because trehalose has been implicated in bacterial and fungal IR resistance (Webb & Diruggiero, Citation2012; Liu et al., Citation2017), and because we previously showed that the trehalose bioynthesis treSYZ pathway of Arthrospira sp. PCC 8005 was highly induced by gamma irradiation (Badri et al., Citation2015a), we decided to measure trehalose content in the current study. Trehalose was extracted and quantified using methods described before (Ohmori et al., Citation2009; Carrieri et al., Citation2010). In brief, trehalose was extracted from the deep-frozen −80°C pellet of irradiated and non-irradiated cell cultures (3 ml) by extracting at 65°C for 3 h in 70% ethanol (Merck). The supernatant was mixed with 100 mM of 2-morpholinoethanesulphonic acid/KOH (pH 6.0) (Sigma-Aldrich) and 5 × 10⁻³ U ml–1 trehalase (Sigma-Aldrich), an enzyme that converts trehalose to monosaccharides. The liberated monosaccharides were reacted with 0.2 g of anthrone (Alfa Aesar Chemicals – ThermoFisher Scientific) and heated at 100°C for 10 min on a Block Heater (Grant QBT2 – ThermoFisher Scientific). When anthrone reacts with monosaccharides it forms a green complex that can be colorimetrically measured at 620 nm using a CLARIOstar microplate reader (BMG Labtech, Isogen LifeScience). The final concentration of trehalose was determined by comparison with a standard curve obtained for glucose (Sigma-Aldrich).
Transmission electron microscopy
Ultrathin sectioning was performed as described by Van Eykelenburg (Citation1979) and Tomaselli et al. (Citation1993). The preparation for TEM was carried out following Hayat (Citation1981). Samples were fixed, 24 h after radiation exposure, in 2.5% formaldehyde and 2.5% glutaraldehyde in 0.05 M cacodylate buffer (pH 7.0) for 4 h at room temperature. Then, the material was rinsed in the same buffer and post-fixed in 1% osmium tetroxide in cacodylate buffer at 4°C overnight. Specimens were treated with 1% uranyl acetate in distilled water for 1 h, dehydrated in an acetone series and embedded in Spurr’s resin (Spurr, Citation1969). Serial ultrathin (60–100 nm) sections were cut with a diamond knife on a Sorvall MT 2B microtome. The material on the grids was post-stained with a saturated solution of uranyl acetate in 50% ethanol and 0.04% lead citrate. Observations were made using a FEI Tecnai BioTWIN transmission electron microscope operating at 120 kV.
DNA sequencing, sequence data deposition and genome comparison
Illumina sequencing was performed on the Illumina HiSeq 2500 platform using paired-end sequencing with a length of 125 nucleotides (Baseclear, Leiden, the Netherlands). The amount of paired-end reads produced for the P2 and P6 strains was 2 987 359 and 4 225 409, respectively, totalling 746 and 1056 Mbp, respectively (coverage of ~115× and 166×). Raw sequencing data are available at the NCBI Sequencing Read Archive (SRA) under BioProject number PRJNA517821 and BioSample number SUB5105069. The genome sequences of the Arthrospira sp. PCC 8005 P2 and P6 strains were compared at two levels with the strain PCC 8005 reference genome (Janssen et al., Citation2010) (updated version 5 of 15 February 2014, available at NCBI under GenBank assembly accession number GCA_000973065). First, for the single nucleotide polymorphisms (SNPs) and small indels, we used the Genome Analysis Toolkit (GATK) (Van Der Auwera et al., Citation2013). Before running GATK, all sequencing reads were aligned with the Arthrospira sp. PCC 8005 reference genome using the Burrows–Wheeler Aligner (BWA) software (Li & Durbin, Citation2010). The raw BWA output was converted to a sorted and indexed BAM file using the view, sort and index commands of the SAMtools package version 0.1.18 (Li et al., Citation2009) (a BAM file is a binary equivalent of a SAM, Sequence Alignment/Map, file). SNP prediction was performed on this BAM file by following the pipeline as described in Van Der Auwera et al. (Citation2013) with default parameters and using ploidy=1 when running the HaplotyperCaller command. Secondly, for larger structural variations (insertions and deletions) an in-house developed Perl script was used. This programme exploits the paired-end information and insert size distributions to predict these variations.
The annotation of individual SNPs used the SNPEff 4.3t software (Cingolani et al., Citation2012). First, a SnpEff database was built from the Arthospira sp. PCC 8005 reference genome (Janssen et al., Citation2010), updated version 5, GenBank GCA_000973065.1. Next, this database was used to annotate genetic variants within strains P2 and P6 and to predict the effects of these variations (e.g. amino acid changes).
Statistical analysis
All results are mean ± standard deviation (SD) of three measurements using biological triplicates. One-way ANOVA was performed and graphs were made in GraphPad Prism 7.00 software for Windows (GraphPad Software, La Jolla, California – www.graphpad.com). A confidence interval of 95% (p < 0.05) was considered statistically significant. All statistical calculations and data are available in Supplementary figs S3–S14 and Supplementary tables S1–S23.
Results
Morphology, physiology and growth
Two subcultures, P2 and P6, of Arthrospira sp. PCC 8005 were studied. While P6 remained in its original helical form for over six years (), the trichomes of the P2 subcultures did not and eventually formed straight trichomes only (). Concomitantly with this morphological change we also observed that the sedimentation behaviour of P2 subcultures differed: whereas the helical morphotype P6 had a capacity to settle when left undisturbed (), the straight morphotype (P2) did not and remained afloat (). The P2 strain consistently grew better than P6. Biomass measurements of three biological replicates for each strain at regular intervals during a 14-day period showed the P2 strain having a statistically significantly higher (p <0.05) mean growth rate than P6 (; Supplementary table S1).
Figs 1–4. The two representative strains of Arthrospira sp. PCC 8005 under study, displaying: Fig. 1. Helical trichomes (P6); Fig. 2. straight trichomes (P2); Fig. 3. sedimentation (P6) and Fig. 4. surface floating (P2). Figs 1, 2 scale = 32.5 µm.
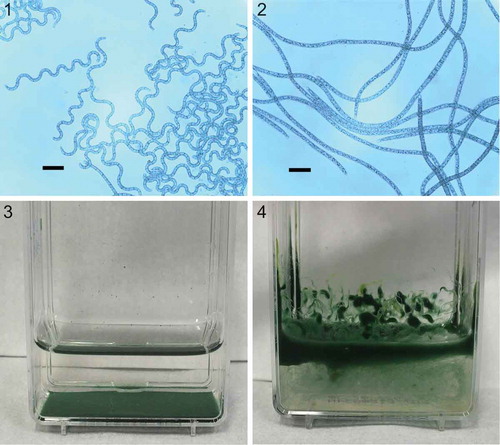
Fig. 5. Growth curves of Arthrospira sp. PCC 8005 strains P2 and P6 (n = 3); characteristic strain differences are indicated in the panel. Growth rates (GR) were calculated according to formula [1]. Data are mean values, bars = SD.
![Fig. 5. Growth curves of Arthrospira sp. PCC 8005 strains P2 and P6 (n = 3); characteristic strain differences are indicated in the panel. Growth rates (GR) were calculated according to formula [1]. Data are mean values, bars = SD.](/cms/asset/59436a8b-88f2-4705-972a-a6cb6b9ebdc8/tejp_a_1675763_f0002_oc.jpg)
Radiation resistance
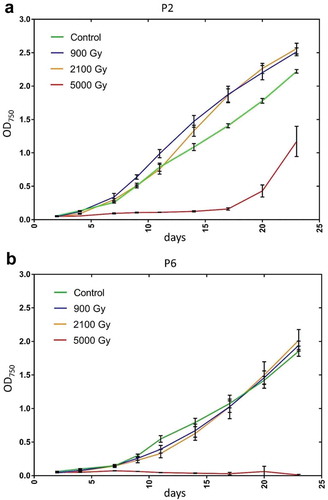
Although both strains were able to recover from cumulative radiation doses of up to 2100 Gy, only the P2 strain was able to recover from exposure to 5000 Gy of radiation, albeit with a long lag phase of more than 15 days (). P2 cells irradiated with a cumulative dose of 2100 Gy were actually growing faster (p = 0.0578; Supplementary table S2) than the non-irradiated control which was not the case for P6 cells.
Fig. 6. Recovery of: a. strain P2 (straight trichomes, floating) and b. strain P6 (helical trichomes, sedimenting) after exposure to three doses of 60Co gamma irradiation (mean ± SD, n = 3).
Cell composition differences before and after 60Co gamma irradiation
The responses of the two ‘morphotypes’ P2 (straight trichomes) and P6 (helical trichomes) to high doses of 60Co gamma radiation in terms of their cellular production of biocompounds such as antioxidants, pigments, phycobiliproteins and the compatible solute trehalose were as follows.
Total antioxidants assay (TAC)
We did not observe any significant differences in the water-soluble (hydrophilic) content of strains P2 and P6 in response to 60Co gamma irradiation (). In contrast, we noted a significant increase (p = 0.02; Supplementary table S6) in lipophilic content at a gamma irradiation dose of 5000 Gy in the P2 strain. The lipophilic content of strain P6 was not significantly affected by radiation (p > 0.05; Supplementary table S6). Comparing the hydrophilic and lipophilic contents of both strains for a given radiation dose, only the hydrophilic content of cells subjected to 2100 Gy differed significantly between P2 and P6 (p = 0.044) (Supplementary fig. S4 and Supplementary table S7) while lipophilic contents between the two strains was similar (Supplementary fig. S5 and Supplementary table S8).
Fig. 7. Antioxidant capacities of Arthrospira sp. PCC 8005 cells before (C = control) and immediately after 60Co gamma irradiation at three cumulative doses for the hydrophilic fraction (a, b) and lipophilic fraction (c, d) of strains P2 and P6. Results are expressed in micromoles Trolox-equivalent per mg of fresh weight (µmol TE/mgFW), using mean values, bars = SD.
Cellular glutathione content
We did not observe any significant decrease in GSH levels with an increasing dose of radiation, for either P2 or P6 (). Likewise, we did not see any significant difference in GSH/GSSG ratios for P2 at 900, 2100 or 5000 Gy or in P6 at 900 and 5000 Gy (). However, the increase of the GSH/GSSG ratio in P6 was statistically significant (p = 0.0382; Supplementary table S9) at 2100 Gy with respect to the non-irradiated control. We also noted that all amounts (per unit of weight) of reduced or oxidized glutathione, and hence total glutathione, in the P6 strain seemed to be generally higher than those for the P2 strain but only that for cells irradiated at 900 Gy was significantly different (Supplementary figs S6–S9 and Supplementary tables S10–S13).
Fig. 8. Glutathione concentrations for strains P2 and P6 before (C = control) and immediately after exposure to ionizing radiation at three cumulative doses of 60Co gamma irradiation. a, b, measured total glutathione concentration [GSH + GSSG] in nmoles per dry weight of pellet; c, d, calculated reduced glutathione concentration in nmoles per dry weight of pellet (GSH) calculated as total glutathione [GSH + GSSG] – 2 × [GSSG]; e, f, GSH/GSSG ratio calculated as ([GSH + GSSG] – 2 × [GSSG])/[GSSG]; and g, h, measured GSSG levels in nmoles per dry weight of pellet. Data are mean values, bars = SD.
![Fig. 8. Glutathione concentrations for strains P2 and P6 before (C = control) and immediately after exposure to ionizing radiation at three cumulative doses of 60Co gamma irradiation. a, b, measured total glutathione concentration [GSH + GSSG] in nmoles per dry weight of pellet; c, d, calculated reduced glutathione concentration in nmoles per dry weight of pellet (GSH) calculated as total glutathione [GSH + GSSG] – 2 × [GSSG]; e, f, GSH/GSSG ratio calculated as ([GSH + GSSG] – 2 × [GSSG])/[GSSG]; and g, h, measured GSSG levels in nmoles per dry weight of pellet. Data are mean values, bars = SD.](/cms/asset/abb6408a-58e1-4d30-97a5-d1c6f2b237b6/tejp_a_1675763_f0005_b.gif)
Pigments
Immediately after exposure of Arthrospira cells to a gamma irradiation dose of 5000 Gy we observed cell colouration change from normal dark blue-green to light green or yellow-green, indicating significant pigment degradation. Hence, we analysed these pigments separately in order to study the cellular effects of ionizing radiation in Arthrospira sp. PCC 8005.
A generally lower cellular content of chlorophyll was noted in P2 (the more IR resistant strain) with respect to P6 (the less resistant strain). Our analysis of the total chlorophyll content obtained after exposure to high doses of gamma irradiation indicated no significant effect on the total content of chlorophyll in both P2 and P6 strains (; Supplementary fig. S10 and Supplementary tables S14, S15).
Fig 9. Total cellular content of chlorophyll in: a. strain P2 and b. strain P6 before (C = control) and immediately after a given cumulative dose of 60Co gamma irradiation. Data are mean values, bars = SD.
In terms of carotenoid content, strains P2 and P6 responded to 60Co gamma irradiation in a similar fashion by displaying a threefold increase (p = 0.0139 for P2 and p = 0.0097 for P6) at an intermediate dose of 2100 Gy (; Supplementary tables S16, S17), exemplifying the role of carotenoids in the scavenging of IR-induced ROS. At the highest gamma irradiation dose (5 kGy) carotenoid levels dropped in both strains, perhaps because of the onset of cell damage or due to a saturation effect in antioxidant activity. Although the carotenoid levels in P2 and P6 at the lower dose of 900 Gy hinted at a different initial response for the two strains () this was not statistically supported (with p = 0.0944 for P6 at 900 Gy) (Supplementary fig. S11 and Supplementary table S18) and overall, the two strains behaved very similarly.
Fig. 10. Cellular content of carotenoids in: a. strain P2 and b. strain P6 before (C = control) and after a given cumulative dose of 60Co gamma irradiation using the TAC assay and applying formula [4]. Data are mean values, bars = SD.
![Fig. 10. Cellular content of carotenoids in: a. strain P2 and b. strain P6 before (C = control) and after a given cumulative dose of 60Co gamma irradiation using the TAC assay and applying formula [4]. Data are mean values, bars = SD.](/cms/asset/80939738-37fe-4e65-b7f5-f55d27720577/tejp_a_1675763_f0007_b.gif)
Phycocyanin (PC) and allophycocyanin (APC) concentrations in the P2 strain remained similar with respect to the non-irradiated control regardless of the applied dose of gamma irradiation () although for both phycobilins a slight increase at 5000 Gy could be seen (p = 0.1246; Supplementary table S19). Likewise, the PC values in strain P6 were also similar for all three irradiation doses in respect to their non-irradiated control but APC in strain P6 showed a significant decrease at 2100 Gy (p = 0.0382; Supplementary table S19). We noted also that overall APC values in strain P2 were much lower than in strain P6, irrespective of irradiation (p = 0.009; Supplementary fig. S12 and Supplementary table S20), while PC concentrations were similar across both strains (Supplementary fig. S13 and Supplementary table S21).
Fig. 11. Concentrations of: phycocyanin (PC) a. strain P2 and b. strain P6 and allophycocyanin (APC) c. strain P2 and d. strain P6, before (C = control) and after a given cumulative dose of 60Co gamma irradiation. Concentrations were measured by the TAC assay using formulas [5] and [6], respectively. Data are mean values, bars = SD.
![Fig. 11. Concentrations of: phycocyanin (PC) a. strain P2 and b. strain P6 and allophycocyanin (APC) c. strain P2 and d. strain P6, before (C = control) and after a given cumulative dose of 60Co gamma irradiation. Concentrations were measured by the TAC assay using formulas [5] and [6], respectively. Data are mean values, bars = SD.](/cms/asset/e0a2de91-bb14-4738-a610-61667f751b92/tejp_a_1675763_f0008_b.gif)
Trehalose content
Strains P2 and P6 seemed to behave differently in terms of trehalose concentrations in response to 60Co gamma irradiation. Whereas P2 displayed a significant decrease (p = 0.0276; Supplementary table S22) of trehalose concentrations at 2100 Gy () this was not the case in P6; in fact, trehalose concentrations in P6 cells at 2100 Gy went slightly up instead of down (p = 0.1627; Supplementary table S22). Hence, a statistical analysis of trehalose concentration data across both strains showed a clear difference in strain behaviour at 2100 Gy versus non-irradiated control (Supplementary fig. S14) (p = 0.007; Supplementary table S23).
Fig. 12. Trehalose concentration in cells of: a. strain P2 and b. strain P6 before (C = control) and after a given cumulative dose of 60Co gamma irradiation. Data are mean values, bars = SD.
Transmission electron microscopy (TEM)
Arthrospira P2 and P6 cells were not visibly damaged when exposed to 2100 Gy, major ultrastructural features (e.g. gas vesicles, carboxysomes, thylakoids, lipid inclusions, cyanophycin granules) were discernible and fully intact in all cells examined (Supplementary fig. S16). However, for the P2 and P6 cells exposed to 5000 Gy, TEM showed just a subset of these features (Supplementary fig. S17) and some thylakoid damage (Supplementary fig. S18).
Genome comparison and genetic differences between strains P2 and P6
Using the genome sequence for strain PCC 8005, vintage 2003 (Janssen et al., Citation2010: ARTHROv5 – updated version 5 of 15 February 2014, available at NCBI under GenBank assembly accession number GCA_000973065) as a reference sequence we were able to detect 301 single nucleotide polymorphism (SNPs) and 310 insertions or deletions (indels) in strain P2 and 355 SNPs and 314 indels in strain P6, of which 168 SNPs and 48 indels differed between P2 and P6 (; Supplementary file 2). These genome differences between P2 and P6 directly affected a total of 40 coding sequences (CDS) across both strains, taking into account multiple events occurring in the same CDS and excluding all synonymous variants (i.e. SNPs leading to no change at protein level because of the redundancy of the genetic code) (Sheet 3 of Supplementary file 2). Of those affected genes, only four were found in both strains, but in each case different SNPs and indels were involved. Nine proteins in P2 and seven proteins in P6 were considered dysfunctional owing to the introduction of a CDS frameshift, novel stop codon, in-frame insertion or CDS extension. The other genes (13 in P2 and 15 in P6) contained one or more SNPs resulting in a corresponding amino acid substitution in their encoded protein (Supplementary file 2; synonymous variants omitted). Taken together, of the 40 genes across strains P2 and P6 affected by SNPs and/or indels, only eight encoded a protein with a known function (indicated in bold text in Sheet 3 of Supplemetary file 2 and listed in ) and of those only three were severely shortened (a Ser/Thr protein kinase in P2 and a signal transduction histidine kinase in P6) or altered (a haemolysin-type Ca-binding protein in P2) while the remaining five contained single or multiple amino acid substitutions (that may or may not alter protein function).
Table 1. Genomic changes in the genomes of strains P2 and P6.
Table 2. Affected CDS with known function in strains P2 and P6 based on genome data.
A total of 56 SNPs or indels that were different between strains P2 and P6 but were located in an intergenic region (Supplementary file 2) were detected in 34 intergenic regions across both strains. The vast majority of the affected intergenic regions involved genes that encoded proteins of unknown function, gpII introns or transposases (or fragments thereof) and were not investigated further. Likewise, SNPs or indels located more than 250 nt away from the nearest downstream gene or located between two converging genes were also disregarded. The remaining six genes whose expression may have been affected by an upstream SNP or indel (all in the genome of strain P6) are ARTHROv5_11992 (ycf4, encoding a PS I assembly protein), ARTHROv5_11993 (psbD, encoding the PS II D2 protein), ARTHROv5_60118 (encoding a DNA-[cytosine-5-]-methyltransferase), ARTHROv5_60128 (a fibronectin-binding-A-like protein), ARTHROv5_60723 (a signal transduction histidine kinase) and ARTHROv5_61273 (part of a tetratricopeptide TPR_2 repeat protein).
In addition we detected four large insertions in the genomes of strains P2 and P6 (Sheet 4 of Supplementary file 2). Three of these insertions (one in P2 and two in P6) occur in intergenic regions while the fourth (in P6) disrupts gene ARTHROv5_30483 encoding a putative peptidase (additionally listed in ). No large deletions in the P2 and P6 genomes, with respect to the reference genome, were detected. Most notable is a 105 bp insertion located between the ycf4 and psbD genes, in addition to the smaller insertions in this intergenic region mentioned above, bringing the total size of the inserted DNA between the ycf4 and psbD genes to 158 bp.
Discussion
A change in linearity in our strain PCC 8005 during continuous subculturing for the purposes of strain maintenance gave us the opportunity to compare the functionality of linear and helical trichomes. P6 retained the helical geometry, and P2 changed permanently to linearity. We noted that the P2 line of strains (the P2 strain) grew significantly faster and was more resistant to gamma radiation than the P6 line of strains (the P6 strain) while the P6 strain appeared to have lost its buoyancy (, ).
It is possible that Arthrospira sp. PCC 8005 deploys trichome linearization as a mode of survival, because linear filaments of other species of Arthrospira have a lower metabolic rate and display a higher tolerance to adverse growth conditions (Wang & Zhao, Citation2005). Moreover, straight Arthrospira trichomes in agar seem to have a better gliding motility in terms of speed and directionality, allowing them to make snap turns (unavailable to the more rigid helical trichomes) and more easily escaping stressful biophysical conditions (Chaiyasitdhi et al., Citation2018). In view of the necessity to reculture Arthrospira continuously – owing to the lack of a reliable preservation method for this organism – and in view of the routine application of a 24/7 regime of artificial irradiance for its growth in the laboratory, it is plausible that such unnatural, arduous conditions have triggered genomic alterations, some of which may have given rise to specific morphological changes or may have affected particular traits such as cell (trichome) buoyancy or the ability of Arthrospira to respond to 60Co gamma irradiation. In view of our ongoing research on the tolerance of Arthrospira sp. strain PCC 8005 to ionizing radiation (Badri et al., Citation2015a Citation2015b) we were surprised to see in our current study that, while the new linear form P2 still had the ability to recover from 5000 Gy of gamma irradiation – albeit after a 2-week lag phase – the helical strain P6 had lost this ability. In addition, in spite of the fact that the helical form of Arthrospira has typically the full ability to reposition itself in the water column through the action of gas vacuoles, and normally does not sediment but floats either on or just below the surface (Tomaselli, Citation1997; Sili et al., Citation2012), we observed in our experiments that the helical P6 trichomes sedimented and the linear form of P2 floated (, ). Taken together, it is possible that the P2 and P6 substrains of Arthrospira sp. PCC 8005 have undergone, during long periods of strain maintenance, genetic changes in respect to the originally sequenced strain (Janssen et al., Citation2010), although some degree of phenotypic plasticity cannot be ruled out.
Although oxygenic photosynthesis produces a basal level of oxygen radicals, gamma rays in living cells generate additional reactive oxygen species (ROS) including •OH, O2•¯ and H2O2 (Riley, Citation1994; Reisz et al., Citation2014) causing up to a 20-fold increase in intracellular ROS (Agarwal et al., Citation2008). The ability of cells to recover growth after gamma irradiation is a crude measure of how well cells cope with the radiation-induced oxidative stress. Note that Arthrospira sp. PCC 8005, owing to its multicellularity and high gliding motility, cannot be plated out on agar for single-cell colony viable counts. However, P2 and P6 cells exposed to 5000 Gy appeared to show ultrastructural damage. This was highlighted by the fact that on many TEM pictures of cells exposed to 5000 Gy ultrastructures were missing. We are uncertain whether this is because of technical shortcomings or whether this is a sign of radiation-induced cellular damage or regulatory disturbance at 5000 Gy (perhaps by hindering proper biosynthesis of cellular components needed for these ultrastructures). In our opinion it is very difficult to assess the potential of a radiation-exposed bacterial culture to recover growth when transferred into fresh medium based only on optical microscopy or TEM images of a few trichomes or single cells: how many trichomes or cells need to survive in order to establish post-irradiation recovery in fresh medium? A thousand? Ten? It is hard to say. At what precise dose of gamma irradiation is there a ‘no point of return’ for a bacterial culture and how can one associate or predict survival or death based on cell images? Arthrospira are multicellular and it is likely that the cellular effects of gamma radiation are not uniform across all trichomes, or even across individual cells in the same trichome. A small number of unaffected (or barely affected) cells may (or may not) suffice to establish full post-irradiation recovery, hence the difference in recovery for P2-5000 (long lag phase of 17 days before recovery) and P6-5000 (no recovery after 23 days) (). We know from our previous and ongoing work that cumulative doses of > 6400 Gy will always lead (based on optical microscopy) to visible destruction of Arthrospira with no or much smaller trichomes, a lot of cell debris and no recovery of growth. However, we have never obtained any TEM images of such obliterated samples. It is interesting that P2 grew better after exposure to 900 Gy and 2100 Gy of gamma radiation than the non-exposed control. Such a stimulatory effect on cellular growth with low to moderate doses of gamma irradiation (1–2 kGy) has been noted in Arthrospira platensis (Wang et al., Citation1998; Moussa et al., Citation2015).
An additional difference in the way P2 and P6 responded to gamma irradiation was that the total antioxidant capacity of the lipophilic fraction (containing carotenoids and chlorophyll) in strain P2 was significantly higher at 5000 Gy than the non-irradiated control, but this shift was not seen in P6 (). In contrast, the total antioxidant capacity of the water-soluble fractions of strains P2 and P6 did not vary, irrespective of the dose of gamma irradiation applied. Nonetheless, the ratio of GSH/GSSG remained constant throughout () indicating a constant replenishment of reduced glutathione, which is in concordance with our previous work where the expression of the glutathione synthetase-encoding gene gshB in Arthrospira sp. PCC 8005 was strongly induced by 60Co gamma irradiation (Badri et al., Citation2015a, Citation2015b). Also, the essential role of glutathione (i.e. as GSH) in cyanobacteria to combat oxidative stress was demonstrated for a gshB defective mutant of Synechocystis sp. PCC 6803 (Cameron & Pakrasi, Citation2010). Although it seems that P2 and P6 were both successful in synthesizing cellular defences against the IR-induced oxidative stress, strain P6 nonetheless failed to survive the highest dose of radiation (5000 Gy). This may be explained by the multifaceted nature of bacterial resistance to ionizing radiation (Confalonieri & Sommer, Citation2011; Pavlopoulou et al., Citation2016; Jung et al., Citation2017; Singh, Citation2018) and the high probability that the genomes of P2 and P6 have undergone independent changes during strain maintenance.
Chlorophyll contents in strains P2 and P6 were not affected by the three doses of gamma irradiation (900–2100–5000 Gy) () but in both strains carotenoid levels peaked at 2100 Gy with a 3-fold increase over the non-irradiated controls (), in agreement with other studies (Moussa et al., Citation2015; Abomohra et al., Citation2016). The increase in carotenoids is unsurprising as carotenoids are excellent ROS detoxifiers and radical scavengers and most likely serve as a first-line defence against IR-induced ROS (Domonkos et al., Citation2013). However, when we exposed our Arthrospira strains P2 and P6 to 5000 Gy of gamma radiation, carotenoid degradation clearly superseded its production and hence the overall concentration decreased.
Phycobilins generally function as light-harvesting pigments covalently bound to proteins called phycobiliproteins, forming complexes such as phycocyanin (PC) and allophycocyanin (APC), the main constituents of Arthrospira light-harvesting antennae. In addition to their role in light harvesting, phycobilins exhibit important antioxidant activities in all oxygenic cyanobacteria (Saini et al., Citation2018). Generally, APC levels in the more IR resistant P2 strain were significantly lower than those in the lesser IR resistant P6 strain and there was a slight but consistent increase in PC and APC levels at 5000 Gy. In Arthrospira and other cyanobacteria, PC and APC accumulation in the antennae is strongly influenced by light intensity through light-sensitive gene regulation of the cpc and apc loci (Belknap & Haselkorn, Citation1987; Nomsawai et al., Citation1999) but little is known about the influence of ionizing radiation on antennae length and/or composition. The fact that PC and APC levels do not seem to be affected significantly by gamma irradiation – even at the highest dose of 5000 Gy – is rather unexpected, particularly in view of the gamma radiation-mediated activation of the nblA gene which encodes a protease specifically involved in phycobilisome degradation and the radiation-mediated down-regulation of the cpc and apc loci for, respectively, PC and APC biosynthesis (Badri et al., Citation2015b).
In many organisms trehalose functions as a reserve carbohydrate or as a transport molecule and serves to stabilize proteins and membranes during cellular stress (Arguelles, Citation2000; Elbein et al., Citation2003; Jain & Roy, Citation2009). It is also known as a protective agent against a wide variety of abiotic stresses including heat, cold, dehydration, desiccation, gamma radiation and oxygen radicals (Benaroudj et al., Citation2001; Carvalho et al., Citation2011; Reina-Bueno et al., Citation2012a, Citation2012b; Webb & Diruggiero, Citation2012). Based on genome data it appears that Arthrospira sp. PCC 8005 (strain vintage 2003, updated version v5 of 2014) has at least two trehalose biosynthetic pathways at its disposal: (1) through the isomerization of the α1-α4 bond in maltose by trehalose synthetase (TreS) and (2) through the conversion of the α1-α4 bond in maltodextrins by maltooligosyl trehalose synthase (TreY) and subsequent hydrolytic release of trehalose by maltooligosyl trehalose trehalohydrolase (TreZ). In previous irradiation experiments with Arthrospira sp. PCC 8005 strain (2012 vintage), the expression of the corresponding treS, treY and treZ genes increased by 300%, 70% and 70%, respectively, in response to 800 Gy, 1600 Gy and 3200 Gy of 60Co gamma irradiation (Badri et al., Citation2015a), indicating a possible role for trehalose in cellular protection in response to radiation damage in Arthrospira sp. PCC 8005. Our study showed a remarkable difference in trehalose content between the more IR resistant P2 strain (straight) versus the lesser IR resistant P6 strain (helical) at a high dose of gamma irradiation. This may indicate that the more IR resistant P2 strain metabolizes trehalose much faster than strain P6, presumably as a dedicated response to cellular radiation damage. Alternatively, it may be argued that the biosynthesis of trehalose in strain P2 is somehow attenuated. However, there were no genetic differences between the two strains located anywhere close to the treS or treYZ loci in either the P2 or P6 strain. Another possibility is that the treS and treYZ genes would be regulated differently in the two strains, but again, our genome data do not indicate that this is the case.
We are aware that the reference genome is not the true reference point for the P2 and P6 genomes since P2 and P6 are of vintage 2012 and their genomic DNAs were prepared in 2018, whereas the genomic DNA of the original PCC 8005 strain (vintage 2003) was prepared in the course of 2008–2009 (see Materials and methods and Supplementary fig. S1). In other words, as there are no genome data available for the PCC 8005 strain re-ordered in 2012 (referred to as the ‘mother culture’ of the initial P2 and P6 subcultures in Materials and methods), we cannot tell which genomic changes occurred in strain PCC 8005 (vintage 2003) between 2003 and 2009 during strain maintenance in our laboratory, which occurred in strain PCC 8005 between 2003 and 2012 during maintenance at the PCC collection, or which occurred in the P2 and P6 strains between 2012 and 2018 during their maintenance in our laboratory. Even so, some interesting observations can be made. First, our results clearly indicate that strain maintenance through continuous subculturing affects the genetic composition of Arthrospira, indicated by the many SNPs and indels detected (; Supplementary file 2). The P2 and P6 strains have 243 SNPs and 288 indels in common. Logic dictates that these common changes in respect to the reference genome were introduced during strain maintenance prior to the first subculturing in 2012 of strain PCC 8005, newly ordered from the Pasteur Culture Collection (the ‘mother culture’), into P2 and P6 subcultures and these changes fall beyond the scope of this study. The 220 genomic differences between P2 and P6 (168 SNPs, 48 indels and four large insertions; Supplementary file 2) affect a total of 41 CDS of which only nine have a known function (). It is tempting to speculate that the K135D substitution in GvpC (encoded by ARTHROv5_12033) of strain P6 might be the cause of the sedimenting behaviour, since this protein is essential for the integrity and stability of gas vesicles and therefore may play an important role in buoyancy (Miklaszewska et al., Citation2012; Wang et al., Citation2015). Another interesting case is the large insertion in the ycf4-psbD intergenic region of strain P6 (Supplementary fig. S15). The psbD gene encodes the D2 protein of the photosynthetic PSII complex and Ycf4 is an assembly protein of the PSI complex; if the expression of one or both of these proteins is altered (their genes are divergently oriented in a 104 bp intergenic region with promoters and/or regulatory region most likely overlapping) the photosynthetic capacity of the cells may also be affected, possibly explaining the slower recovery of strain P6 in respect to strain P2 ().
However, it is clear that additional research is required to explain the different behaviour of strains P2 and P6, starting with confirmation of the K135D substitution in the P6-gvpC gene and its involvement in the loss of buoyancy, supported by thorough bioinformatic analysis and literature review, and RT-PCR expression analysis of yfc4/psbD for both strains. Also, the functional elucidation of the 32 affected proteins of yet unknown function may give us important leads in the future. We recently have performed RNA extractions from P2- and P6-gamma-irradiated and non-irradiated cells and are now studying gene expression levels in both strains by RNAseq. This should soon enable us to address the genotype–phenotype associations for strains P2 and P6 in more detail.
Supplementary information
The following supplementary material is accessible via the Supplementary Content tab on the article’s online page at http://doi.org/10.1080/09670262.2019.1675763
Supplementary file 1: contains all supplementary figures and tables (see below for legends).
Supplementary file 2: contains all computational results of executed genome comparisons.
Supplementary fig. S1: genealogy of strain PCC 8005 and its substrains, with information on genome sequence dates (PCC: Pasteur Culture Collection).
Supplementary fig. S2: Regression line for variables OD750 versus dry weight of P2 cells.
Supplementary fig. S3: Regression line for variables OD750 versus dry weight of P6 cells.
Supplementary figs S4–14: graphs for statistical significance testing of experimental data.
Supplementary fig. S15: ycf4-psbD intergenic region with indicated differences between the genomes of P2 and P6 (see Results and Discussion).
Supplementary figs S16–S18: compilation of TEM images of P2 and P6 cells irradiated with either 2100 Gy or 5000 Gy.
Supplementary tables S1–23: tabulated values for Student’s t-test and obtained significance calls for experimental results using biological triplicates (n = 3) (see also Materials and methods).
Author contributions
A. Yadav: execution and design of experiments, data acquisition and interpretation, manuscript preparation; P. Monsieurs: DNA sequence analysis and genome comparative analysis, manuscript preparation; K. Waleron: selection and analysis of TEM images; A. Misztak: execution of experiments; P. Janssen: original concept, design of experiments, data acquisition and interpretation, manuscript preparation, communications and manuscript management. All authors: manuscript editing and revision.
Supplementary file 2
Download MS Excel (266.5 KB)Supplementary file 1
Download PDF (4.1 MB)Acknowledgements
We are grateful to Dr M. Mysara of SCK•CEN for performing SNPEff v4.3 analysis, to G. Grousserov of SCK•CEN for his help with sequence variant analysis and statistical analysis of experimental results, and Dr M. Narajczyk of the Electron Microscopy Laboratory – University of Gdansk for providing TEM images. We acknowledge the editor and reviewers of this manuscript for their useful critical appraisal of the original submission.
Disclosure statement
No potential conflict of interest was reported by the authors.
Additional information
Funding
Related Research Data
References
- Abomohra, A.E., El-Shouny, W., Sharaf, M. & Abo-Eleneen, M. (2016). Effect of gamma radiation on growth and metabolic activities of Arthrospira platensis. Brazilian Archives of Biology and Technology, 59: e16150476.
- Agarwal, R., Rane, S.S. & Sainis, J.K. (2008). Effects of (60)Co gamma radiation on thylakoid membrane functions in Anacystis nidulans. Journal of Photochemical Photobiology, 91: 9–19.
- Ainas, M., Hasnaoui, S., Bouarab, R., Abdi, N., Drouiche, N. & Mameri, N. (2017). Hydrogen production with the cyanobacterium Spirulina platensis. International Journal of Hydrogen Energy, 42: 4902–4907.
- Arguelles, J.C. (2000). Physiological roles of trehalose in bacteria and yeasts: a comparative analysis. Archives in Microbiology, 174: 217–224.
- Badri, H., Monsieurs, P., Coninx, I., Nauts, R., Wattiez, R. & Leys, N. (2015a). Temporal gene expression of the cyanobacterium Arthrospira in response to gamma rays. PLoS ONE, 10: e0135565.
- Badri, H., Monsieurs, P., Coninx, I., Wattiez, R. & Leys, N. (2015b). Molecular investigations of the radiation resistance of the edible cyanobacterium Arthrospira sp. PCC 8005. Microbiology Open, 4: 187–207.
- Battista, J.R. (2016). Radiation tolerance. In eLS. Wiley, Chichester. http://www.els.net [doi: 10.1002/9780470015902.a0020365]
- Beblo, K., Douki, T., Schmalz, G., Rachel, R., Wirth, R., Huber, H., Reitz, G. & Rettberg, P. (2011). Survival of thermophilic and hyperthermophilic microorganisms after exposure to UV-C, ionizing radiation and desiccation. Archives of Microbiology, 193: 797–809.
- Belknap, W.R. & Haselkorn, R. (1987). Cloning and light regulation of expression of the phycocyanin operon of the cyanobacterium Anabaena. EMBO Journal, 6: 871–884.
- Benaroudj, N., Lee, D.H. & Goldberg, A.L. (2001). Trehalose accumulation during cellular stress protects cells and cellular proteins from damage by oxygen radicals. Journal of Biological Chemistry, 276: 24261–24267.
- Benzie, I.F.F. & Strain, J.J. (1999). Ferric reducing antioxidant power assay: direct measure of total antioxidant activity of biological fluids and modified version for simultaneous measurement of total antioxidant power and ascorbic acid concentration. Oxidants and Antioxidants, Pt A, 299: 15–27.
- Cameron, J.C. & Pakrasi, H.B. (2010). Essential role of glutathione in acclimation to environmental and redox perturbations in the cyanobacterium Synechocystis sp. PCC 6803. Plant Physiology, 154: 1672–1685.
- Carrieri, D., Momot, D., Brasg, I.A., Ananyev, G., Lenz, O., Bryant, D.A. & Dismukes, G.C. (2010). Boosting autofermentation rates and product yields with sodium stress cycling: application to production of renewable fuels by cyanobacteria. Applied and Environmental Microbiology, 76: 6455–6462.
- Carvalho, A.L., Cardoso, F.S., Bohn, A., Neves, A.R. & Santos, H. (2011). Engineering trehalose synthesis in Lactococcus lactis for improved stress tolerance. Applied and Environmental Microbiology, 77: 4189–4199.
- Chaiyasitdhi, A., Miphonpanyatawichok, W., Riehle, M.O., Phatthanakun, R., Surareungchai, W., Kundhikanjana, W. & Kuntanawat, P. (2018). The biomechanical role of overall-shape transformation in a primitive multicellular organism: a case study of dimorphism in the filamentous cyanobacterium Arthrospira platensis. PLoS ONE, 13: e0196383.
- Chen, B. & Zhou, X.C. (2003). Protective effect of natural dietary antioxidants on space radiation-induced damages. Space Medicine & Medical Engineering (Beijing), 16: 514–518.
- Cheng, J., Lu, H.X., Li, K., Zhu, Y.X. & Zhou, J.H. (2018). Enhancing growth-relevant metabolic pathways of Arthrospira platensis (CYA-1) with gamma irradiation from 60Co. Royal Society of Chemistry Advances, 8: 16824–16833.
- Ciferri, O. (1983). Spirulina, the edible microorganism. Microbiological Reviews, 47: 551–578.
- Cingolani, P., Platts, A., Wang Le, L., Coon, M., Nguyen, T., Wang, L., Land, S.J., Lu, X. & Ruden, D.M. (2012). A program for annotating and predicting the effects of single nucleotide polymorphisms, SnpEff: SNPs in the genome of Drosophila melanogaster strain w1118; iso-2; iso-3. Fly, 6: 80–92.
- Cogne, G., Lehmann, B., Dussap, C.-G., & Gros, J.-B. (2003). Uptake of macrominerals and trace elements by the cyanobacterium spirulina platensis (Arthrospira platensis PCC 8005) under photoautotrophic conditions: Culture medium optimization. Biotechnology and Bioengineering, 81: 588–593.
- Confalonieri, F. & Sommer, S. (2011). Bacterial and archaeal resistance to ionizing radiation. Journal of Physics: Conference Series, 261: 012005.
- Cox, M.M. & Battista, J.R. (2005). Deinococcus radiodurans – the consummate survivor. Nature Reviews Microbiology, 3: 882–892.
- Domonkos, I., Kis, M., Gombos, Z. & Ughy, B. (2013). Carotenoids, versatile components of oxygenic photosynthesis. Progress in Lipid Research, 52: 539–561.
- Elbein, A.D., Pan, Y.T., Pastuszak, I. & Carroll, D. (2003). New insights on trehalose: a multifunctional molecule. Glycobiology, 13: 17R–27R.
- Ezraty, B., Gennaris, A., Barras, F. & Collet, J.F. (2017). Oxidative stress, protein damage and repair in bacteria. Nature Reviews in Microbiology, 15: 385–396.
- Fahey, R.C. (2013). Glutathione analogs in prokaryotes. Biochimica et Biophysica Acta, 1830: 3182–3198.
- Fernandez, A.F., Ooms, H., Brichard, B., Coeck, M., Coenen, S., Berghmans, F. & Decreton, M. (2002). SCK•CEN gamma irradiation facilities for radiation tolerance assessment. 2002 IEEE Radiation Effects Data Workshop, Workshop Record, pp. 171–176.
- Furmaniak, M.A., Misztak, A.E., Franczuk, M.D., Wilmotte, A., Waleron, M. & Waleron, K.F. (2017). Edible cyanobacterial genus Arthrospira: actual state of the art in cultivation methods, genetics, and application in medicine. Frontiers in Microbiology, 8: 2541.
- Gao, K.S., Li, P., Watanabe, T.R. & Helbling, E.W. (2008). Combined effects of ultraviolet radiation and temperature on morphology, photosynthesis, and DNA of Arthrospira (Spirulina) platensis (Cyanophyta). Journal of Phycology, 44: 777–786.
- Hayat, M.A. (1981). Principles and Techniques of Electron Microscopy: Volume I, Biological Applications. 2nd ed. Edward Arnold, London.
- Hendrickx, L., De Wever, H., Hermans, V., Mastroleo, F., Morin, N., Wilmotte, A., Janssen, P. & Mergeay, M. (2006). Microbial ecology of the closed artificial ecosystem MELiSSA (Micro-Ecological Life Support System Alternative): reinventing and compartmentalizing the Earth’s food and oxygen regeneration system for long-haul space exploration missions. Research in Microbiology, 157: 77–86.
- Hongsthong, A., Sirijuntarut, M., Prommeenate, P., Thammathorn, S., Bunnag, B., Cheevadhanarak, S. & Tanticharoen, M. (2007). Revealing differentially expressed proteins in two morphological forms of Spirulina platensis by proteomic analysis. Molecular Biotechnology, 36: 123–130.
- Hossain, M.F., Ratnayake, R.R., Meerajini, K. & Kumara, K.L.W. (2016). Antioxidant properties in some selected cyanobacteria isolated from fresh water bodies of Sri Lanka. Food Science and Nutrition, 4: 753–758.
- Hosseini, S.M., Khosravi-Darani, K. & Mozafari, M.R. (2013). Nutritional and medical applications of spirulina microalgae. Mini-Reviews in Medicinal Chemistry, 13: 1231–1237.
- Hu, X.Y., Ouyang, J., Liu, G.C., Gao, M.J., Song, L.B., Zang, J. & Chen, W. (2018). Synthesis and characterization of the conducting polymer micro-helix based on the Spirulina template. Polymers, 10: Article 882.
- Imlay, J.A. (2013). The molecular mechanisms and physiological consequences of oxidative stress: lessons from a model bacterium. Nature Reviews Microbiology, 11: 443–454.
- Jain, N.K. & Roy, I. (2009). Effect of trehalose on protein structure. Protein Science, 18: 24–36.
- Janssen, P.J., Morin, N., Mergeay, M., Leroy, B., Wattiez, R., Vallaeys, T., Waleron, K., Waleron, M., Wilmotte, A., Quillardet, P., De Marsac, N.T., Talla, E., Zhang, C.C. & Leys, N. (2010). Genome sequence of the edible cyanobacterium Arthrospira sp. PCC 8005. Journal of Bacteriology, 192: 2465–2466.
- Jeeji Bai, N. (1985). Competitive exclusion or morphological transformation? A case study with Spirulina fusiformis. Archiv für Hydrobiologie, Suppl. 71/1, Algological Studies, 38–39: 191–199.
- Jeeji Bai, N. & Seshadri, C.V. (1980). On coiling and uncoiling of trichomes in the genus Spirulina. Archiv für Hydrobiologie, Suppl. 60/1, Algological Studies, 26: 32–47.
- Ji, C., Han, J., Zhang, J., Hu, J., Fu, Y., Qi, H., Sun, Y. & Yu, C. (2018). Omics-prediction of bioactive peptides from the edible cyanobacterium Arthrospira platensis proteome. Journal of the Science of Food and Agriculture, 98: 984–990.
- Jung, K.W., Lim, S. & Bahn, Y.S. (2017). Microbial radiation-resistance mechanisms. Journal of Microbiology, 55: 499–507.
- Kamata, K., Piao, Z., Suzuki, S., Fujimori, T., Tajiri, W., Nagai, K., Iyoda, T., Yamada, A., Hayakawa, T., Ishiwara, M., Horaguchi, S., Belay, A., Tanaka, T., Takano, K. & Hangyo, M. (2014). Spirulina-templated metal microcoils with controlled helical structures for THz electromagnetic responses. Nature Scientific Reports, 4: 4919.
- Karkos, P.D., Leong, S.C., Karkos, C.D., Sivaji, N. & Assimakopoulos, D.A. (2011). Spirulina in clinical practice: evidence-based human applications. Evidence-Based Complementary and Alternative Medicine, 2011: 531053.
- Kerchev, P. & Ivanov, S. (2008). Influence of extraction techniques and solvents on the antioxidant capacity of plant material. Biotechnology and Biotechnological Equipment, 22: 556–559.
- Klähn, S. & Hagemann, M. (2011). Compatible solute biosynthesis in cyanobacteria. Environmental Microbiology, 13: 551–562.
- Komárek, J., Kaštovský, J., Mareš, J. & Johansen, J.R. (2014). Taxonomic classification of cyanoprokaryotes (cyanobacterial genera), using a polyphasic approach. Preslia, 86: 295–335.
- Kumar, S.K., Dahms, H.-U., Won, E.-J., Lee, J.-S. & Shin, K.-H. (2015). Microalgae – a promising tool for heavy metal remediation. Ecotoxicology and Environmental Safety, 113: 329–352.
- Lee, Y., Yang, T.-M. & Hsu, J.-H. (2015). A comparison of the growth characteristics of Arthrospira platensis in deep ocean water, surface ocean water, and artificial ocean water. Open Access Library Journal, 2: e1984.
- Lewin, R.A. (1980). Uncoiled variants of Spirulina platensis (Cyanophyceae: Oscillatoriaceae). Algological Studies/Archiv für Hydrobiologie, 60: 48–52.
- Li, H. & Durbin, R. (2010). Fast and accurate long-read alignment with Burrows-Wheeler transform. Bioinformatics, 26: 589–595.
- Li, H., Handsaker, B., Wysoker, A., Fennell, T., Ruan, J., Homer, N., Marth, G., Abecasis, G., Durbin, R. & 1000 Genome Project Data Processing Subgroup. (2009). The Sequence Alignment/Map format and SAMtools. Bioinformatics, 25: 2078–2079.
- Lin, C.-C., Wei, C.-H., Chen, C.-I., Shieh, C.-J. & Liu, Y.-C. (2013). Characteristics of the photosynthesis microbial fuel cell with a Spirulina platensis biofilm. Bioresource Technology, 135: 640–643.
- Liu, T., Zhu, L., Zhang, Z., Huang, H., Zhang, Z. & Jiang, L. (2017). Protective role of trehalose during radiation and heavy metal stress in Aureobasidium subglaciale F134. Scientific Reports, 7: 17586.
- Menezes, A.A., Cumbers, J., Hogan J.A. & Arkin A.P. (2015). Towards synthetic biological approaches to resource utilization on space missions. Journal of the Royal Society Interface, 12: 20140715.
- Miklaszewska M., Waleron M., Morin N., Całusinska M., Wilmotte A., Tandeau De Marsac N., Ripka, R. & Waleron, K. (2012). Elucidation of the gas vesicle gene clusters in cyanobacteria of the genus Arthrospira (Oscillatoriales, Cyanophyta) and correlation with ITS phylogeny. European Journal of Phycology, 47: 233–244.
- Morin, N., Vallaeys, T., Hendrickx, L., Natalie, L. & Wilmotte, A. (2010). An efficient DNA isolation protocol for filamentous cyanobacteria of the genus Arthrospira. Journal of Microbiological Methods, 80: 148–154.
- Motham, M., Peerapornpisal, Y., Tongsriri, S., Pumas, C. & Vacharapiyasophon, P. (2012). High subzero temperature preservation of Spirulina platensis (Arthrospira fusiformis) and its ultrastructure. Chiang Mai Journal of Science, 39: 554–561.
- Moussa, H.R., Ismaiel, M.M.S., Shabana, E.F., Gabr, M.A. & El-Shaer, E.A. (2015). The role of gamma irradiation on growth and some metabolic activities of Spirulina platensis. Journal of Nuclear Technology in Applied Science, 3: 99–107.
- Mühling, M., Harris, N., Belay, A. & Whitton, B.A. (2003). Reversal of helix orientation in the cyanobacterium Arthrospira. Journal of Phycology, 39: 360–367.
- Mühling, M., Somerfield, P.J., Harris, N., Belay, A. & Whitton, B.A. (2006). Phenotypic analysis of Arthrospira (Spirulina) strains (cyanobacteria). Phycologia, 45: 148–157.
- Narainsamy, K., Farci, S., Braun, E., Junot, C., Cassier-Chauvat, C. & Chauvat, F. (2016). Oxidative-stress detoxification and signalling in cyanobacteria: the crucial glutathione synthesis pathway supports the production of ergothioneine and ophthalmate. Molecular Microbiology, 100: 15–24.
- Nomsawai, P., De Marsac, N.T., Thomas, J.C., Tanticharoen, M. & Cheevadhanarak, S. (1999). Light regulation of phycobilisome structure and gene expression in Spirulina platensis C1 (Arthrospira sp. PCC 9438). Plant and Cell Physiology, 40: 1194–1202.
- Nowicka-Krawczyk, P., Mühlsteinová, R. & Hauer, T. (2019). Detailed characterization of the Arthrospira type species separating commercially grown taxa into the new genus Limnospira (Cyanobacteria). Scientific Reports, 9.
- Ohmori, K., Ehira, S., Kimura, S. & Ohmori, M. (2009). Changes in the amount of cellular trehalose, the activity of maltooligosyl trehalose hydrolase, and the expression of its gene in response to salt stress in the cyanobacterium Spirulina platensis. Microbes and Environments, 24: 52–56.
- Olsson-Francis, K. & Cockell, C.S. (2010). Use of cyanobacteria for in-situ resource use in space applications. Planetary and Space Science, 58: 1279–1285.
- Ovando, C.A., Carvalho, J.C.D., Vinícius De Melo Pereira, G., Jacques, P., Soccol, V.T. & Soccol, C.R. (2018). Functional properties and health benefits of bioactive peptides derived from Spirulina: a review. Food Reviews International, 34: 34–51.
- Pavlopoulou, A., Savva, G.D., Louka, M., Bagos, P.G., Vorgias, C.E., Michalopoulos, I. & Georgakilas, A.G. (2016). Unraveling the mechanisms of extreme radioresistance in prokaryotes: lessons from nature. Mutation Research – Reviews in Mutation Research, 767: 92–107.
- Peñarrieta, J.M., Alvarado, J.A., Akesson, B. & Bergenståhl, B. (2008). Total antioxidant capacity and content of flavonoids and other phenolic compounds in canihua (Chenopodium pallidicaule): an Andean pseudocereal. Molecular Nutrition and Food Research, 52: 708–717.
- Rahman, M.A., Aziz, M.A., Al-Khulaidi, R.A., Sakib, N. & Islam, M. (2017). Biodiesel production from microalgae Spirulina maxima by two step process: optimization of process variable. Journal of Radiation Research and Applied Sciences, 10: 140–147.
- Reina-Bueno, M., Argandoña, M., Nieto, J.J., Hidalgo-García, A., Iglesias-Guerra, F., Delgado, M.J. & Vargas, C. (2012a). Role of trehalose in heat and desiccation tolerance in the soil bacterium Rhizobium etli. BMC Microbiology, 12: 207.
- Reina-Bueno, M., Argandoña, M., Salvador, M., Rodriguez-Moya, J., Iglesias-Guerra, F., Csonka, L.N., Nieto, J.J. & Vargas, C. (2012b). Role of trehalose in salinity and temperature tolerance in the model halophilic bacterium Chromohalobacter salexigens. PLoS ONE, 7: e33587.
- Reisz, J.A., Bansal, N., Qian, J., Zhao, W. & Furdui, C.M. (2014). Effects of ionizing radiation on biological molecules – mechanisms of damage and emerging methods of detection. Antioxidants and Redox Signaling, 21: 260–292.
- Riley, P.A. (1994). Free-radicals in biology – oxidative stress and the effects of ionizing-radiation. International Journal of Radiation Biology, 65: 27–33.
- Sadovsky, D., Brenner, A., Astrachan, B., Asaf, B. & Gonen, R. (2016). Biosorption potential of cerium ions using Spirulina biomass. Journal of Rare Earths, 34: 644–652.
- Saini, D.K., Pabbi, S. & Shukla, P. (2018). Cyanobacterial pigments: perspectives and biotechnological approaches. Food & Chemical Toxicology, 120: 616–624.
- Shabana, E.F., Gabr, M.A., Moussa, H.R., El-Shaer, E.A. & Ismaiel, M.M.S. (2017). Biochemical composition and antioxidant activities of Arthrospira (Spirulina) platensis in response to gamma irradiation. Food Chemistry, 214: 550–555.
- Shiraishi, H. (2016). Cryopreservation of the edible alkalophilic cyanobacterium Arthrospira platensis. Bioscience Biotechnology & Biochemistry, 80: 2051–2057.
- Shuryak, I., Matrosov, V.Y., Gaidamakova, E.K., Tkavc, R., Grichenko, O., Klimenkova, P., Volpe, R.P. & Daly, M.J. (2017). Microbial cells can cooperate to resist high-level chronic ionizing radiation. PLoS ONE, 12: e0189261.
- Sili, C., Torzillo, G. & Vonshak, A. (2012). Arthrospira (Spirulina). In Ecology of Cyanobacteria II: Their Diversity in Space and Time (Whitton, B.A., editor), 677–705. Springer, Dordrecht.
- Singh, H. (2018). Desiccation and radiation stress tolerance in cyanobacteria. Journal of Basic Microbiology, 58: 813–826.
- Smirnova, G.V. & Oktyabrsky, O.N. (2005). Glutathione in bacteria. Biochemistry (Moscow), 70: 1199–1211.
- Sotiroudis, T.G. & Sotiroudis, G.T. (2013). Health aspects of Spirulina (Arthrospira) microalga food supplement. Journal of the Serbian Chemical Society, 78: 395–405.
- Spurr, A.R. (1969). A low-viscosity epoxy resin embedding medium for electron microscopy. Journal of Ultrastructure Research, 26: 31–43.
- Tomaselli, L. (1997). Morphology, ultrastructure and taxonomy of Arthrospira (Spirulina) maxima and Arthrospira (Spirulina) platensis. In Spirulina platensis (Arthrospira): Physiology, Cell-biology and Biotechnology (Vonshak, A., editor), 1–15. Taylor & Francis, London.
- Tomaselli, L., Palandri, M.R. & Tani, G. (1993). Advances in preparative techniques for observation of the fine structure of Arthrospira maxima Setch. et Gardner (syn. Spirulina maxima Geitler). Algological Studies/Archiv für Hydrobiologie, Supplement 71: 43–55.
- Van Der Auwera, G.A., Carneiro, M.O., Hartl, C., Poplin, R., Del Angel, G., Levy-Moonshine, A., Jordan, T., Shakir, K., Roazen, D., Thibault, J., Banks, E., Garimella, K.V., Altshuler, D., Gabriel, S. & Depristo, M.A. (2013). From FastQ data to high confidence variant calls: the Genome Analysis Toolkit best practices pipeline. Current Protocols in Bioinformatics, 43: 11.10.1 11–11.10.33.
- Van Eykelenburg, C. (1979). The ultrastructure of Spirulina platensis in relation to temperature and light intensity. Antonie van Leeuwenhoek, 45: 369–390.
- Van Eykelenburg, C. (1980). Ecophysiological studies on Spirulina platensis: effect of temperature, light intensity and nitrate concentration on growth and ultrastructure. Antonie Van Leeuwenhoek, 46: 113–127.
- Vanhoudt, N., Vandenhove, H., Leys, N. & Janssen, P. (2018). Potential of higher plants, algae, and cyanobacteria for remediation of radioactively contaminated waters. Chemosphere, 207: 239–254.
- Verseux, C., Baqué, M., Lehto, K., De Vera, J.-P.P., Rothschild, L.J. & Billi, D. (2016). Sustainable life support on Mars – the potential roles of cyanobacteria. International Journal of Astrobiology, 15: 65–92.
- Walter, J.M., Coutinho, F.H., Dutilh, B.E., Swings, J., Thompson, F.L. & Thompson, C.C. (2017). Ecogenomics and taxonomy of cyanobacteria phylum. Frontiers in Microbiology, 8: Article 2132.
- Wang, T.H., Kang, L., Li, J.H., Wu, W.J., Zhang, P.R., Gong, M.H., Lai, W.H., Zhang, C.Y., Chang, L., Peng, Y., Yang, Z.Z., Li, L., Bao, Y.Y., Xu, H.W., Zhang, X.H., Sui, Z.H., Yang, G.P. & Wang, X.H. (2015). Floating Escherichia coli by expressing cyanobacterial gas vesicle genes. Journal of Ocean University of China, 14: 84–88.
- Wang, X., Cai, J., Sun, L., Zhang, S., Gong, D., Li, X., Yue, S., Feng, L. & Zhang, D. (2019). Facile fabrication of magnetic microrobots based on Spirulina templates for targeted delivery and synergistic chemo-photothermal therapy. ACS Applied Materials & Interfaces, 11: 4745–4756.
- Wang, Z., Xu, B., Zhao, X., Jiang, J. & Chen, S. (1998). The effect of gamma-irradiation on different strains and morphological filaments of Spirulina. Acta Agriculturae Universitatis Zhejiangensis, 24: 121–125.
- Wang, Z.P. & Zhao, Y. (2005). Morphological reversion of Spirulina (Arthrospira) platensis (Cyanophyta): from linear to helical. Journal of Phycology, 41: 622–628.
- Webb, K.M. & Diruggiero, J. (2012). Role of Mn2+ and compatible solutes in the radiation resistance of thermophilic bacteria and archaea. Archaea, 2012: 845756.
- Wu, H.Y., Gao, K.S., Villafane, V.E., Watanabe, T. & Helbling, E.W. (2005). Effects of solar UV radiation on morphology and photosynthesis of filamentous cyanobacterium Arthrospira platensis. Applied and Environmental Microbiology, 71: 5004–5013.
- Wu, Q.H., Liu, L., Miron, A., Klimová, B., Wan, D. & Kuča, K. (2016). The antioxidant, immunomodulatory, and anti-inflammatory activities of Spirulina: an overview. Archives of Toxicology, 90: 1817–1840.
- Yu, L.Z.-H., Luo, X.-S., Liu, M. & Huang, Q. (2013). Diversity of ionizing radiation-resistant bacteria obtained from the Taklimakan Desert. Journal of Basic Microbiology, 55: 135–140.
- Zhang, HQ., Lin, AP., Sun, Y. & Deng, YM. 2001. Chemo- and radio-protective effects of polysaccharide of Spirulina platensis on hemopoietic system of mice and dogs. Acta Pharmacologica Sinica, 22: 1121–1124.