
ABSTRACT
The physiological plasticity of five cyanobacteria microbial mats from an extreme high temperature intertidal environment (SW Iceland) was analysed both daily and seasonally. Daily cycles under in situ natural conditions were monitored from June to October using pulse-amplitude modulated (PAM) fluorometry and pigment composition in order to study the photosynthetic performance of these microbial mats in relation to environmental fluctuations linked to irradiance and temperature. In vitro temperature and salinity experiments of photosynthetic responses were also conducted. A total of 10 taxa were identified, the most abundant species being Cyanobacterium sp. and Geitlerinema sp. The microbial mats showed a remarkable photosynthetic adaptation to daily and seasonal changes in temperature and solar radiation. For all microbial mats, rETRmax values decreased from June to October, while Fv/Fm remained constant in terms of absolute values. Although high irradiances during June and July affected photosynthesis through photoinhibition, recovery was observed under high temperatures (between 40–50°C), which supports the hypothesis that temperature is a determining factor in the photosynthetic performance of these cyanobacterial mats. Our results showed a significant increase in the Chla-b and phycobiliproteins content from June to October, as well as a significant decrease in total carotenoids content.
Introduction
Intertidal ecosystems are characterized by large and rapid fluctuations of environmental parameters such as salinity, desiccation, irradiance and nutrient availability, due to tidal cycles and seasonal environmental changes. This may result in high physiological plasticity of organisms inhabiting these ecosystems (Helmuth & Hofmann, Citation2001). If high temperature is added to these varying environmental conditions, these hot coastal habitats can be regarded as extreme environments, forcing the biota to become evolutionary forms of extreme microbial mats.
Intertidal hot environments are relatively rare in the world. They are found in Iceland due to the country’s high geothermal activity near the seashore. One of the largest such areas is Yngingarlindir, on the Reykjanes peninsula (SW Iceland), one of the most geothermally active places in Iceland. This area is structured into a series of shallow rock-pools located near the seashore, 10–50 m from the sea with tidal variations of up to 4 m. Since 2006, rock-pools are fed by a powerful water effluent (4400 l–2) from the Reykjanesvirkjun geothermal power plant (information from HS Orka Power Corp.), which leaks hot (75°C), nutrient-depleted brackish water out of a canal to the open sea across the intertidal zone and into the rock-pools, creating an unusual extreme environment. Organisms inhabiting these rock-pool environments are exposed on daily and seasonal cycles to temperature ranges from 15–50°C, with many being covered by the sea at high tides. Therefore, the organisms are subject to temperature fluctuations of almost 30°C twice per day in addition to other physicochemical fluctuations.
The biota of these extreme environments consists of thick microbial mats where photosynthesis relies on the presence of cyanobacteria. These organisms have to undergo significant adaptation and acclimation which follow daily and seasonal patterns in order to withstand the extreme environmental conditions of the habitat. Deciphering the mechanisms that support their physiological plasticity is essential to understand the presence and permanence of these biological structures in these extreme environments. In this context, these environments provide an excellent natural laboratory to understand the photophysiological processes that extreme environmental conditions impose on their associated biota.
In this study, the physiological plasticity of five cyanobacteria microbial mats in these environments was analysed on a daily and seasonal basis, both in situ and under laboratory-controlled conditions. Additionally, in vitro experiments were conducted in order to study the photosynthetic plasticity of the mats in the presence of different temperatures and salinities.
We have compared the seasonal microbial diversity as well as the in situ photosynthetic activity of five submerged microbial mats at different temperature conditions (constant and variable temperature), located in the coastal hot intertidal rock-pools on the Reykjanes peninsula (SW Iceland). Our goals were (1) to obtain insights into the bacterial diversity in these poorly investigated mats; (2) to assess the photosynthetic response of the different communities to the drastic seasonal reduction in light; (3) to study the effect of the daily temperature fluctuation on the photosynthetic response; and (4) to assess the in vitro physiological response of the different communities to salinity
Materials and methods
Study site and environmental parameters measurements
The study site was the hot intertidal Yngingarlindir area, located off the coast of the Reykjanes peninsula (SW Iceland, 63°52'52.9068"N, –22°27'11.214"W) (). For in situ PAM measurements, water sampling and biofilm analysis, five sites covered by green microbial mats were selected (Supplementary fig. 1S). The sampling sites were distributed from the seashore (Site 1, mats YL1.1 and YL1.2) to the start of the hot water supply channel (Site 2, mats YL2.1, YL3.1 and YL4.1), following a temperature gradient. The five sites were situated at the same tidal level, ~3.50 m above the shore baseline (Supplementary fig. 2S). Although some areas of the biofilms were exposed to air during low tides, the study was carried out in sections that remained permanently under water.
Fig. 1. Schematic representation of the sampling location.
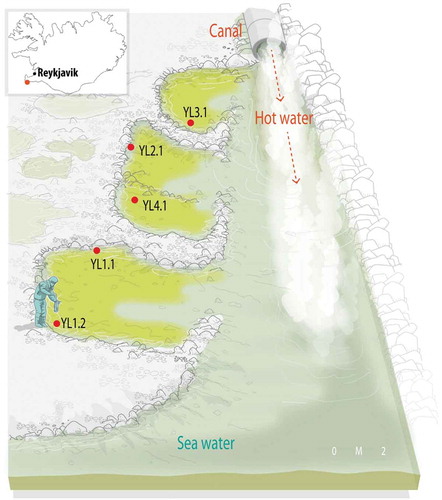
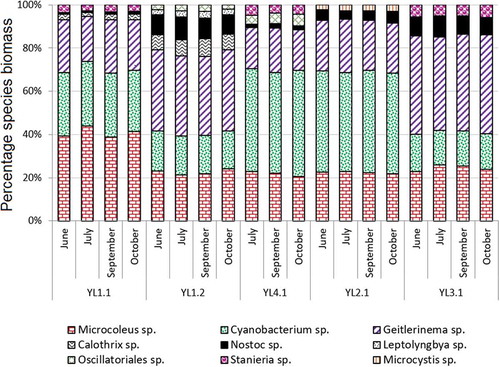
Fig. 2. Percentages of cyanobacterial communities in the different microbial mats.
Salinity was measured using an ATC-S/Milli-E refractometer (Atago, Japan). Underwater PAR irradiance and temperature measurements were recorded every 5–10 min throughout the course of the study with HOBO Pendant Data Loggers UA-002-08 (Onset, USA) submerged at the mat site and a LI-COR Underwater Quantum Sensor (Nebraska, USA) located at the surface of the microbial mats.
Species identification and cell counts
In June 2014, ~1 cm2 samples from each microbial mat were collected by scraping them from the rocky bottom with a sterile plastic spatula and transported to the laboratory in sterile 5 ml plastic tubes at 4°C. One of the biofilm subsamples was used for light microscopy species identification and cell counts. The sample was preserved in situ in formalin (4%) and kept at 4°C until the analyses were carried out. Species identification was to the lowest possible taxonomic level using different phenotypic features based on previous studies of these communities (Hobel et al., Citation2005; Bolhuis et al., Citation2013) and carried out using a Zeiss Axioscope II microscope.
In order to determine possible variations in microbial mat composition between June and October, samples from each mat were collected as described earlier in June, July, September and October (Supplementary fig. 3S), on the same days on which the PAM fluorometry measurements were made. Cell counts were performed, using a microscopic counting grid (156.25 mm2) and a Zeiss Axioscope II equipped with phase-contrast. Counts were made for each sample from 50 randomly chosen microscopic fields at 400-fold magnification. For filamentous organisms, cell numbers were counted as for unicellular organisms, since their total length usually exceeded the total length of the slide.
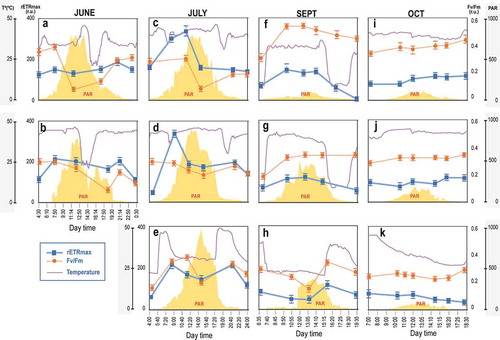
Fig. 3. Changes in relative maximum electron transport rate (rETRmax) and optimal quantum yield (Fv/Fm) for microbial mats under variable water temperature (Mat YL1.1: a, c, f, i; Mat YL1.2: b, d, g, j; Mat YL4.1: e, h, k) throughout the day from June to October. Data are expressed as means ± SD (n = 5).
In situ PAM fluorometry measurements during daily cycles
Four complete daily cycles (from sunrise to sunset) were carried out once a month from June to October 2014 (Supplementary fig. 3S). PAM fluorometry measurements were conducted every 2–3 h in quintuplicate on the five biofilms assayed during the daylight hours, as described above. At the same time, samples for pigment determination were collected and physicochemical water parameters were measured. Sampling days were selected taking into account sun irradiation, tide schedule and level as well as day length. In June, results are missing from the YL4.1 mat due to poor weather conditions which prevented data collection.
Photosynthetic performance was estimated by means of in vivo chlorophyll fluorescence of PSII with a Diving PAM (Walz GmbH, Effeltrich, Germany) equipped with a distance clip (provided with the equipment) at the end of the optic fibre. The background signal correction was achieved using the AUTO-ZERO mode with the fibreoptics end directed into the air. Optimal quantum yield was defined as the ratio of variable (Fv) to maximal fluorescence (Fm), of dark-adapted mats (for 20–30 min) as described previously (Schreiber, Citation1986). In this ratio Fv is calculated as Fv = Fm−F0, in which F0 is the initial fluorescence, i.e. when all PSII reaction centres are active or ‘open’, and Fm is the maximal fluorescence, that is, when all reaction centres of PSII are ‘closed’. Light curves were performed in order to monitor changes in the photosynthetic capacity. Microbial mats were exposed to increasing irradiances of actinic light (0–1132 µmol photons m–2 s–1), and every 30 s a saturating pulse (0.8 s white-light pulse of 10000 µmol photons m–2 s–1) was applied to estimate the effective quantum yield of photosynthesis (ΦPSII) before actinic irradiation was increased again. Effective quantum yield of PSII is defined as ((Fm’−Ft)/Fm), where Fm is the maximum fluorescence of light-acclimated thylakoids, and Ft is the fluorescence level caused by ambient light. Relative electron transport rate (ETRr) was calculated as ETRr = (ΦPSII) × PAR. Relative ETR values were plotted against PAR irradiance, and rETRmax was determined by curve fitting to the model of Jassby & Platt described previously (Medlin et al., Citation1998).
Pigment analysis
At the end of each daily survey, microbial mat samples were collected in quintuplicates and immediately frozen after harvesting. After grinding the biomass, quantification of chlorophyll a (Chla), chlorophyll b (Chlb) and total carotenoids (TC) was based on an extraction with cold methanol for 12 h at 4°C in dark conditions. Samples were centrifuged (5 min, 4000 rpm) and the absorbance was measured in a Ultrospec 3000pro spectrophotometer (Amersham Pharmacia, USA). Concentrations were determined following published equations (Chla =16.29 A 665.2−8.54 A 652.0; Chlb = 30.66 A 652.0−13.58 A 665.2; TC = (1000 A470−2.86 Chla−129.2 Chlb)/245) (Lichtenthaler & Wellburn, Citation1983; Porra et al., Citation1989). Phycobiliproteins were extracted in 0.01 M phosphate buffer (pH 7.0) containing 0.15 M NaCl. Biomass was sonicated on ice for 1 min five times using 8 W pulses, samples were centrifuged (10 min, 12 000 rpm) and concentrations were determined spectrophotometrically following Bennett & Bogorad (Citation1973) (Phycocyanin PC = (A615−0.474 A652)/5.34; Allophycocyanin (APC) = (A652−0.208 A615)/5.09; Phycoerythrin PE = (A562−2.41 (PC)−0.849 (APC)/9.62).
In vitro determination of photosynthesis response to temperature and salinity
To evaluate the effects of temperature and salinity on the photosynthetic activity of the different microbial mats analysed, biomass samples were taken in June from the sampling sites using a sterile plastic spatula (10 cm2) and then placed in 1 litre plastic open containers with water from each sampling point, kept in the dark and transported to the laboratory.
Five independent replicates of each microbial mat were incubated in 20 ml of natural water from their respective sampling points at five different temperatures (20, 30, 40, 50 and 60°C) and three salinity levels (5, 20 and 30‰) for 30 min in the dark and PAM fluorometry measurements were carried out as described above. Biofilms were incubated for 1 h at 30 µmol photons m–2 s–1 irradiance, provided by day-light fluorescent tubes, under the different experimental conditions before the measurements took place.
Statistical analysis
Because of heterogeneous variances in microbial parameters, Kruskal–Wallis non-parametric tests were used to analyse biodiversity differences between stations and sampling dates (Sokal & Rohlf, Citation1995). A 5% significance level (p < 0.05) was used for rejection of null hypothesis in all cases. Chlorophyll fluorescence and pigment data were compared by a two-way model I ANOVA. Pairwise multiple comparisons between treatments were performed only after significant ANOVA using the LSD calculated at a 95% confidence level by using the Holm–Sidak post hoc method. For the indoor experiment, a three-way ANOVA (microbial mat, temperature and salinity) was performed for rETRmax and Fv/Fm in order to test single and interactive effects between factors. In order to test the single and interactive effects of temperature and salinity on each microbial mat, two-way ANOVA was performed for the same physiological variables. Homoscedasticity of variances was checked by the Fmax test. A Holm–Sidak post hoc procedure of multiple comparisons was used when significant differences were found (significance value set at α = 0.001). All the statistical tests were performed using SigmaPlot (Systat Software Inc., v.11.0) (Sokal & Rohlf, Citation1995).
Results
Light radiation, water temperature and salinity
Fieldwork experiments were carried out on very sunny days. Slight differences were found in light intensities between June and July (Supplementary fig. 4S), reaching between 800 and 1100 µmol photons m–2 s–1 during the middle of the day (12:30–14:30). Light radiation decreased by 40% in September (up to 400 µmol photons m–2 s–1) at all sampling sites except in YL1.1, where light was reduced by 90% down to 100 µmol m–2 s–1 during the central hours. Additionally, light intensity was reduced by 60% from September to October, reaching values below 200 µmol photons m–2 s–1 at all sampling sites except YL1.1 where no differences were found between the two months. Daylight duration also decreased from more than 21 h in June to 9 h in October (Supplementary fig. 3S).
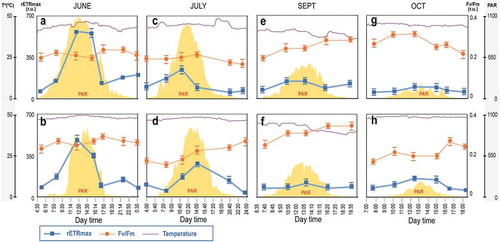
Fig. 4. Changes in relative maximum electron transport rate (rETRmax) and optimal quantum yield (Fv/Fm) for microbial mats under constant water temperature (Mat YL2.1: a, c, f, i; Mat YL3.1: b, d, g, j) throughout the day from June to October. Data are expressed as means ± SD (n = 5).
The highest average temperatures were recorded in sampling sites YL2.1 and YL3.1 which had a constant temperature of 45–50°C during the full daily cycles (Supplementary fig. 4S). In sampling sites YL1.1, YL1.2 and YL4.1, variations of up to 20°C were observed during the day depending on the tides. These differences in the temperature regime of the sampling stations could be due to their different distances from the hot water supply canal. Thus, sampling stations closest to the hot water canal (YL2.1 and YL3.1) showed a constant temperature even during high tide, when they were covered with cold water from the sea. However, stations located farther from the canal (YL1.1, YL1.2 and YL4.1) showed a decrease in the water temperature during high tide due to the lower amount of hot water in these areas. In June and July, temperature differences were lower in sites YL1.1 and YL1.2 (5–10°C), this difference increased in September (up to 20°C). Site YL4.1 showed the lowest average temperature during the day (30°C in July and 20°C in September), and also the highest temperature fluctuation within a day (more than 25°C between tides).
None of the sites showed daily or seasonal statistically significant differences in water salinity (1–33‰), with the exception of YL3.1 (Supplementary fig. 5S). In this area, salinity decreased from 33 to 25‰ during the entire day in June and during the low tides in July.
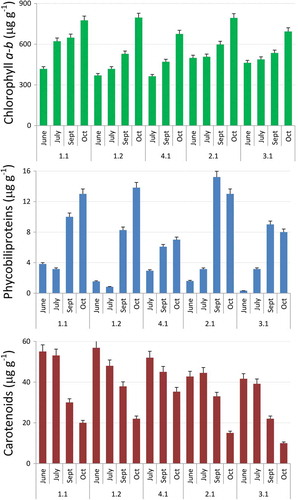
Fig. 5. Monthly variation of pigment content: Chlorophyll a-b (top), Phycobiliproteins (centre), Total carotenoids (bottom). Data are expressed as averaged daily pigment content ± SD (n = 5).
Biofilm species composition
All the microbial mats analysed were mainly formed by filamentous and unicellular cyanobacterial species. A total of nine taxa were identified in the samples (). Cyanobacterium sp. (Chroococcales) and Geitlerinema sp. (Oscillatoriales) were detected in all samples and were determined to be the most abundant. These species were followed by Microcoleus sp. (Oscillatoriales), Nostoc sp. (Nostocales) and Stanieria sp. (Pleurocapsales). Calothrix sp. (Nostocales) was identified in microbial mats YL1.1 and YL1.2, Leptolyngbya sp. (Oscillatoriales) in YL1.2 and Oscillatoriales sp. were also present in mats YL1.2 and YL4.1.
Cyanobacterium sp., Geitlerinema sp. and Microcoleus sp. were the most abundant species, constituting more than 80% of the biomass in all the biofilm analysed. Statistically significant differences were found in the distribution of these species among the biofilms (p = 0.004). Thus, Microcoleus sp. was the dominant species in the YL1.1 biofilm, representing ~40% of the total biomass. No statistically significant differences were found in the main species composition between biofilms YL1.2 and YL3.1 (p = 0.169) and biofilms YL2.1 and YL4.1 (p = 0.178), Cyanobacterium sp. being the most abundant species (50% of the total biomass in both cases). No significant differences were found in the dominant species composition in each biofilm during the months analysed (p = 0.342). In general, species diversity remained fairly constant during this part of the year at sampling points.
Daily cycles and in situ PAM fluorometry analysis
The area studied was wide, flat and rocky, ~50 m across the intertidal zone and protected from wave action. The tides had a regular semi-diurnal cycle with a tidal range from 2.5 to 4 m (Supplementary fig. 3S). Day length was reduced from almost 24 h during June to less than 9 h in October. All field measurements were conducted on sunny days, with almost no cloud cover during the entire day. Due to the difference in water temperature observed during the daily cycles, we divided the microbial mats into two categories, (1) mats at variable temperature (YL1.1, YL1.2 and YL4.1) and (2) mats at constant temperature (YL2.1 and YL3.1).
The photosynthetic parameters (rETRmax and Fv/Fm) of mats at variable water temperature (YL1.1, YL1.2 and YL4.1) are shown in . In general, for these three microbial mats, rETRmax values were often highest in July, and lower in September and October compared with June and July (from 300 ± 75 in July to less than 90 ± 12 in October), while Fv/Fm showed values between 0.1 ± 0.03 and 0.4 ± 0.05 from June to October.
Generally, in June and July (–), the mats showed significantly higher rETRmax values in the early morning (8:00) and evening (20:00–21:00), and the lowest values around noon and the central hours of the day (p = 0.0003). Additionally, after sunset, rETRmax values were usually significantly higher than those measured at sunrise (p = 0.0007). Fv/Fm values showed a similar pattern, with significantly lower values at noon (p = 0.0006) and higher values during early morning and afternoon. On the contrary, in September (–), electron flow in rETRmax increased significantly (p = 0.0004) from sunrise to noon, which agrees with the PAR curve throughout the day for mats YL1.1 and YL1.2 which showed the highest values during the middle hours of the day (~130 ± 5.5). Additionally, Fv/Fm values were significantly lower (p = 0.008) at sunset for both mats, with no significant differences during the day (p = 0.540). Conversely, microbial mat YL4.1 showed the lowest rETRmax measurements during sunset and midday, with some differences among them (p = 0.005), that increased significantly in the afternoon (p = 0.0008). Additionally, no significant differences were found in Fv/Fm values in this mat throughout the day (p = 0.715).
Completely different results were found in October, where rETRmax were significantly lower than in the other months analysed (p = 0.0007) (–). In the case of microbial mats YL1.1 and YL1.2, rETRmax did not follow the PAR curve as usual. No significant differences were found for rETRmax and Fv/Fm within the day (p = 0.450 and p = 0.390, respectively). However, mat YL4.1 showed a significant decrease in rETRmax data (p = 0.003) during the day, while Fv/Fm remained constant (p = 0.203).
summarizes the results of the microbial mats at a constant water temperature (YL2.1 and YL3.1). As for the other mats, rETRmax decreased significantly from June to October (from ~600 ± 25 to less than 200 ± 15) (p = 0.0007) while Fv/Fm values remained under the same threshold (between 0.23 ± 0.03 and 0.33 ± 0.04). However, in these microbial mats, rETRmax followed the PAR curve in all months analysed, with the highest values being observed during the central hours of the day. In contrast, Fv/Fm values did not show significant differences throughout the day and remained constant (p = 0.176).
Pigment analysis
The pigment content of the microbial mats during the different months analysed is summarized in . Chla-b increased significantly from June to October in all the mats (p = 0.0005), ranging from ~320 to almost 820 µg g–1. In general, statistically significant differences were also found among mats (p = 0.003) (Supplementary table 7S). Phycobiliproteins followed the same pattern: statistically significant lower amounts were found in June and July (p = 0.0008), which increased in September and October, ranging from 4 to 12 µg g–1. Statistically significant differences were also found among microbial mats, with mat YL 4.1 showing the lowest phycobiliprotein concentration (p = 0.004) (Supplementary table 7S). A statistically significant decrease in the amount of total carotenoids was also detected from June to October in all the microbial mats analysed (p = 0.002), varying from ~60 to less than 20 µg g–1 (Supplementary table 7S). In this case, mats YL2.1 and YL3.1 showed the lowest amount of total carotenoids.
In vitro photosynthetic responses to temperature and salinity
In vitro rETRmax values ranged from 1 to 68 r.u. (). Statistically significant higher rETRmax rates were obtained at 40°C and 50°C in all microbial mats when compared with the other temperatures analysed (p = 0.005). rETRmax values were significantly higher at 50°C in mat YL1.1 (p = 0.008) and no differences were found between the two temperatures (40°C and 50°C) in the remaining mats (p = 0.214), with the exception of YL4.1 where rETRmax values were higher at 40°C (p = 0.003). The lowest rETRmax values were reached at 20°C and 60°C in all the mats analysed (p = 0.004). Intermediate rETRmax were found at 30°C in all cases, although no statistically significant differences were found between the values at 20°C and 30°C in mats YL1.2 and YL3.1 (p = 0.163 and p = 0.211, respectively).
Table 1. Relative maximum electron transport rate (rETRmax) of five different microbial mats at different temperatures (20, 30, 40, 50 and 60ºC) and salinities (5, 20, 30‰) under controlled laboratory conditions.
Regarding salinity, the lowest rETRmax values were, in general, at 5‰ (p = 0.003) with the exception of mat YL4.1, where no statistically significant differences were found among salinity values (p = 0.121). Additionally, no significant differences were observed in the rETRmax between 20‰ and 30‰ for all the mats analysed (p = 0.032).
Discussion
To our knowledge, this is the first study showing the photosynthetic performance of cyanobacterial microbial mats from hot intertidal extreme environments along periods of strongly changing solar radiation conditions and water physicochemical changes such as temperature and salinity. Our results revealed the photosynthetic acclimation of the cyanobacterial microbial mats to these variable parameters under in situ and in vitro conditions.
Composition of microbial mats
All microbial mats analysed were mainly formed by cyanobacteria belonging to the genera Cyanobacterium, Microcoleus and Geitlerinema. This agrees with previous studies carried out on intertidal mats, in which cyanobacteria are usually the most conspicuous microorganism (Dijkman et al., Citation2010; Bolhuis et al., Citation2013). Cyanobacteria are important structuring agents of microbial mats in coastal zones, especially in the upper littoral zone, where they are subjected to strong temperature and salinity fluctuations, periodic desiccation due to tides and low nutrient conditions. Such conditions would greatly decrease the biodiversity of microbial mats, which are mainly suitable for cyanobacteria which need low nutrients for growth (Rothrock & Garcia-Pichel, Citation2005).
The species found in this study seem to be more related to mesophilic and temperate intertidal mats than to species usually found at higher temperature intertidal hot springs (>70°C), which are usually related to Chloroflexus, Phormidium or Lyngbya species (Hobel et al., Citation2005; Kale et al., Citation2013). This does not come as a surprise, as the temperature in the intertidal ponds does not exceed 50°C. However, Cyanobacterium, one of the main constituents of our microbial mats, has also been found in continental high temperature hot springs (Moro et al., Citation2007).
Temporal changes in photosynthetic performance
Our results revealed a remarkable pattern in terms of daily and seasonal adaptation of photosynthesis to solar radiation and temperature. In the case of microbial mats found at variable water temperature locations (YL1.1, YL1.2 and YL4.1; –), the significant decrease in the rETRmax and Fv/Fm values in June and July, when solar radiation was higher, is an indicator of the photoinhibition effect, which has been widely described for numerous phototrophs such as seaweeds (Zhang et al., Citation2017), microalgae (Stamenković & Hanelt, Citation2013; La Rocca et al., Citation2015) and other cyanobacteria (Soitamo et al., Citation2017). Photosystem II (PSII), the macromolecular complex that converts light energy to chemical energy, is susceptible to inactivation by strong light, and this phenomenon is referred to as the photoinhibition of PSII (Tyystjärvi, Citation2013).
Photoinhibition can be either a dynamic or chronic phenomenon: dynamic photoinhibition describes reversible fluctuations in the rate of photosynthesis with light intensity (Platt et al., Citation1980) and involves the reversible down-regulation of the photosynthetic apparatus PSII associated with the dissipation of excess energy (Tyystjärvi, Citation2013). The regulatory nature of the phenomenon is obvious, as the photosynthetic rate may increase immediately when the light intensity is lowered back to the saturating value. Conversely, chronic photoinhibition describes an irreversible inhibition that does not recover without protein synthesis. Our results showed that, although significant reductions in rETRmax and Fv/Fm occurred in response to increasing solar radiation (–), both photosynthetic parameters recovered relatively quickly and completely during the afternoon, when solar radiation decreased. This indicates that no persistent damage was induced in the photosynthetic apparatus, therefore supporting the presence of dynamic photoinhibition in these microbial mats, despite the extreme conditions of other environmental factors such as temperature. The potential for recovery from solar radiation stress is generally one important prerequisite for algae living in intertidal areas located in northern latitudes, allowing these species to cope with the drastic changes in irradiance in these locations (Halnet et al., Citation1997). This fast response might also be part of a physiological protection strategy in a highly variable environment, such as the intertidal zone.
Microbial mats found in constant water temperature locations (YL2.1 and YL3.1; –) displayed a completely different photosynthetic behaviour, where no photoinhibition was observed. Values for rETRmax followed the light curve throughout the day, and Fv/Fm remained constant. These results support the concept that constant and higher temperatures during the central hours of the day (~45°C) may compensate for photoinhibition, even those close to the tolerance limits (~50°C). Similar results have been obtained for other cyanobacteria (Allakhverdiev et al., Citation2002) and Antarctic green macroalgae (Allakhverdiev et al. Citation2002; Nishiyama et al., Citation2005). The extent of photoinhibition is a result of a balance between PSII photodamage (light-induced inactivation) and repair (Singh et al., Citation2005; Rautenberger & Bischof, Citation2006; Becker et al., Citation2009). Photoinhibition is observed when the rate of photodamage to PSII exceeds the rate of repair of PSII. Moreover, whereas the rate of photodamage is proportional to light intensity, PSII repair rate is very sensitive to various external factors, including low temperatures and salt (Aro et al., Citation1993; Adir et al., Citation2003; Murata et al., Citation2007). In addition, Fv/Fm values from microbial mats found at the constant temperature locations did not decrease in response to high PAR (–). This finding could be linked to the ability of cyanobacteria to produce sunscreen pigments, such as scytonemin and mycosporine-like amino acids (Wada et al., Citation2013). These pigments inhibit Reactive Oxygen Species (ROS) production by preventing excess light energy from reaching the insides of cells by absorbing UV light. The pigments can suppress cell damage by directly scavenging ROS produced under environmental stress conditions such as desiccation and strong light irradiation (Matsui et al., Citation2012). The multifunctional properties of these pigments are one of the important defence mechanisms in cyanobacteria to perform oxygenic photosynthesis in various environments (Wada et al., Citation2013).
Thus, in our microbial mats, low water temperatures (~20°C during low tides in mats YL1.1, YL1.2 and YL4.1) in combination with high light intensities, stressed the cyanobacteria and reduced photosynthetic performance. This is thought to be due to high light and low temperature conditions slowing enzymatic reactions, reducing the de novo synthesis of previously degraded D1 protein (one of the constituents of PSII and the one mainly responsible for the PSII repair mechanism), and consequently decreasing the PSII repair mechanism rates and triggering photoinhibition (Singh et al., Citation2005). However, higher temperatures in microbial mats YL2.1 and YL3.1 throughout the day could enhance the PSII repair mechanisms avoiding photoinhibition in these microbial mats.
In general, no photoinhibition was observed in September and October (, , , and –). This could be owing to the decrease in irradiance of more than 90% from June, as well as to the reduction in day length (from 21 to 9 h). These environmental parameters reduced the stress conditions, therefore allowing non-damaged photosynthetic activity throughout the day, although the rETRmax values were lower than in June and July. Biofilm YL4.1 showed a different photosynthetic behaviour with lower rETRmax and Fv/Fm at midday. This was probably owing to low temperatures during the low tide rather than light intensity. Water at the location of mat YL4.1 reached 20°C during the low tide, while the remaining mat temperatures (YL1.1 and YL1.2) were 33°C and 41°C during the same period of time, respectively. This suggests that temperature is a determining factor in the photosynthetic performance of these cyanobacterial mats.
Temporal changes in pigment composition
Cyanobacteria can acclimate to the potentially damaging consequences of the absorption of excess light energy in a number of ways. These include a marked decline in light-harvesting pigments, changes in the level and composition of photosynthetic reaction centres, the development of sinks to efficiently remove electrons from the electron transport chain, the establishment of mechanisms to eliminate reactive oxygen substances (ROS) that might potentially accumulate and the ability to repair damaged cellular components (Bailey & Grossman, Citation2008). Some of these acclimation responses were observed in the pigment composition measurements conducted in this study.
Our results showed a significant increase in the Chla and Chlb contents from June to October. This is in agreement with previous studies that reported that, under long-term low light conditions, photosynthetic organisms showed higher chlorophyll content in order to maximize light capture (Anderson et al., Citation1995; Walters, Citation2005). This is particularly true in Iceland, where solar light intensity is reduced more than 80% from June to October, and day length is also shortened from almost 24 h to less than 9 h. This increase in the chlorophyll content usually occurs at the expense of electron transport, resulting in lower photosynthetic rates (Anderson et al., Citation1995; Kumar & Murthy, Citation2007), which also occurred in our case. In addition, the lower amount of chlorophyll during June and July could also be due to the photoinhibition process displayed by the microbial mats analysed. On exposure to excess irradiance, a decrease in the amount of chlorophyll is one of the protective mechanisms available to avoid the accumulation of light excited chlorophyll triplets that could interact with oxygen to generate ROS (Krieger-Liszkay, Citation2005). The significant increase in the phycobiliprotein values from June to October observed in all the microbial mats analysed could be a result of decreasing light intensity and duration as the season progresses, and therefore the cells are acclimating to increase light absorption. These results also suggest that, at high light irradiances, there is a reduction in the absorbance of the light-harvesting antenna, which is clearly related to the decrease in the rETRmax and Fv/Fm ratio in these species during June and July.
On the other hand, total carotenoid values were higher in June and July and significantly reduced in September and October. These results may be related to the protection against and/or adaptation to high light conditions, as carotenes can act as a non-enzymatic antioxidant that can quench ROS, as well as reduce the amount of energy funnelled to photochemical reaction centres by screening or thermal energy dissipation (Wilson et al., Citation2006). It is also possible that the decrease in all photosynthetic pigments except carotenoids observed in this study may be a result of the oxidation of pigments under conditions of excess light (Bhandari & Shatma, Citation2006).
These physiological responses to ambient light intensity were also reported in cold-tolerant Leptolyngbya sp. cultures isolated from high latitudes in Antarctica (Chrismas et al., Citation2018), in which increases of Chla maximized light harvesting under low light, reduction of Chla minimized light capture under high light, and increases of total carotenoids contents maximized photoprotection under high light conditions.
In vitro photosynthetic responses to temperature and salinity
In general, the results obtained for the in vitro experiments showed higher rETRmax at 40°C and 50°C with no significant differences between 20‰ and 30‰ salinity. These results are well within the range of temperature and salinity values experienced by the microbial mat communities in their natural habitat, at which their photosynthetic activity was also higher. Furthermore, photosynthesis was strongly regulated by temperature at all experimental salinities, except at 5‰ where rETRmax values were significantly lower, independently of the temperature assayed (). Thus, within the range of in situ salinity values (usually 25–35‰), the microbial community is well-adapted to short-term salinity fluctuations. Biofilm YL4.1 was again the only exception to these patterns, showing no differences in the rETRmax among salinity values at each experimental temperature.
Although the microbial mats analysed followed the general pattern described in the previous paragraph, there were significant differences among mats in terms of rETRmax values. For example, mat YL3.1 showed higher rETRmax values at 40°C and 50°C than the remaining microbial mats. This is in agreement with previous reports, demonstrating that a specific cyanobacterial mat could produce different physiological ecotypes in relation to the range of environmental parameters present in its habitat, such as salinity or temperature, resulting in the development of mat-ecotypes (Karsten, Citation1996). The development of mat-ecotypes could lead to different responses to changes in environmental parameters of microbial mat communities growing in these habitats (Wieland & Kühl, Citation2006).
Little is known about the microbial ecology and physiology of thermophilic intertidal cyanobacterial microbial mats. The work presented here reveals a remarkable trend in terms of daily and seasonal adaptation of photosynthesis to solar radiation and temperature. In this regard, although high light affects photosynthesis causing photoinhibition, this phenomenon can be revoked by high temperatures (40–50°C), which supports the notion that temperature is a determinant factor in the photosynthetic performance of these cyanobacterial mats. Detailed analyses of the physiological capacity of individual members of mat communities, along with studies to elucidate ways in which the different organisms respond to changing environmental conditions, will greatly contribute to our understanding of the adaptive mechanisms of these organisms.
Supplementary information
The following supplementary material is accessible via the Supplementary Content tab on the article’s online page at http://doi.org/10.1080/09670262.2019.1690165
Supplementary fig. 1S. Panoramic view of sampling field localities. The sampling sites were distributed from the seashore (Site 1, biofilms YL1.1 and YL1.2) to the very beginning of the hot water supply channel (Site 2, biofilms YL2.1, YL3.1 and YL4.1), following a temperature gradient.
Supplementary fig. 2S. Panoramic view of the sampling field localities and microbial mats analysed. (a) Sampling location during low tide. (b) Sampling location during high tide. (c) Microbial mat near YL2.1 location during low tides. Scale bar 5 cm. (d) Microbial mat at YL2.1 location during high tide. Scale bar 10 cm. (e) Microbial mat at YL3.1 location. Scale bar 5 cm. (f) Microbial mat at YL1.2 location. Scale bar 10 cm.
Supplementary fig. 3S. Scheme of the daily cycles carried out from June to October.
Supplementary fig. 4S. Daily and monthly changes in underwater illuminance and water temperatures.
Supplementary fig. 5S. Daily and monthly changes in water salinity.
Supplementary table 1S. Results of Analysis of Variance (ANOVA) of rETRmax and Fv/Fm values using day hours and month conditions as factors.
Supplementary table 2S. Results of Analysis of Variance (ANOVA) of rETRmax and Fv/Fm values for YL1.1 microbial mat using day hours and month conditions as factors.
Supplementary table 3S. Results of Analysis of Variance (ANOVA) of rETRmax and Fv/Fm values for YL1.2 microbial mat using day hours and month conditions as factors.
Supplementary table 4S. Results of Analysis of Variance (ANOVA) of rETRmax and Fv/Fm values for YL4.1 microbial mat using day hours and month conditions as factors.
Supplementary table 5S. Results of Analysis of Variance (ANOVA) of rETRmax and Fv/Fm values for YL2.1 microbial mat using day hours and month conditions as factors.
Supplementary table 6S. Results of Analysis of Variance (ANOVA) of rETRmax and Fv/Fm values for YL3.1 microbial mat using day hours and month conditions as factors.
Supplementary table 7S. Results of Analysis of Variance (ANOVA) of pigments values (Chla-b, phycobiliproteins and carotenoids) using microbial mat and month conditions as factors.
Author contributions
A. Aguilera: original concept, drafting and editing manuscript; A. Suominen, S. Pétursdóttir, E. Olgudóttir, E.E. Guðmundsdóttir: sampling, in situ and in vitro experiments; M. Altamirano: statistical analysis, data processing and interpretation; E. González-Toril: statistical analysis, data processing and interpretation; G.O. Hreggviðsson: provided material support and funding for this project.
TEJP-2018-0132-File007.pdf
Download PDF (1.2 MB)Acknowledgments
We would like to thank Carlos Aguilera for the graphic work (, ) (www.elpixel21.com), as well as to the staff from Reykjanesvirkjun Power plant for their logistic support during the field samplings. AA was funded by a Mobility Grant Salvador de Madariaga (Ministry of Education, Spain) and NILS European Program in Science and Sustainability (ABEL-IM-2013 and 010-2BBRR). This work has been supported by Grants CGL2011-02254/BOS, CGL2015-69758-P and CGL2017-92086-EXP and RTI2018-094867-B-I00 (Ministry of Economy and Competitivity, Spain) and EU grant SeaBioTech 311932.
References
- Adir, N., Zer, H., Shochat, S. & Ohad, I. (2003). Photoinhibition: a historical perspective. Photosynthesis Research, 76: 343–370.
- Allakhverdiev, S.I., Nishiyama, Y., Miyairi, S., Yamamoto, H., Inagaki, N., Kanesaki, Y. & Murata, N. (2002). Salt stress inhibits the repair of photodamaged photosystem II by suppressing the transcription and translation of psbA genes in Synechocystis. Plant Physiology, 130: 1443–1453.
- Anderson, J., Chow, W. & Park, Y. (1995). The grand design of photosynthesis: acclimation of the photosynthetic apparatus to environmental cues. Photosynthesis Research, 46: 129–139.
- Aro, E.M., Virgin, I. & Andersson, B. (1993). Photoinhibition of photosystem II: inactivation, protein damage and turnover. Biochimica et Biophysica Acta, 1143: 113–134.
- Bailey, S. & Grossman, A. (2008). Photoprotection in cyanobacteria: regulation of light-harvesting. Photochemical Photobiology, 84: 1410–1420.
- Becker, S., Walter, B. & Bischof, K. (2009). Freezing tolerance and photosynthetic performance of polar seaweeds at low temperatures. Botanica Marina, 52: 609–616.
- Bennett, A. & Bogorad, L. (1973). Complementary chromatic adaptation in a filamentous blue green alga. Journal of Cell Biology, 58: 419–435.
- Bhandari, R. & Shatma, P.K. (2006). High-light-induced changes on photosynthesis, pigments, sugars, lipids and antioxidant enzymes in freshwater (Nostoc spongiaeforme) and marine (Phormidium corium) cyanobacteria. Photochemical Photobiology, 82: 702–710.
- Bolhuis, H., Fillinger, L. & Stal, L.J. (2013). Coastal microbial mat diversity along a natural salinity gradient. PLoS ONE, 8: e63166.
- Chrismas, N., Williamson, C.J., Yallop, M.L., Anesio, A.M. & Sánchez-Baracaldo, P. (2018). Photoecology of the Antarctic cyanobacterium Leptolyngbya sp. BC1307 brought to light through community analysis, comparative genomics and in vitro photophysiology. Molecular Ecology, 27: 5279–5293.
- Dijkman, N.A., Boschker, H.T.S., Stal, L.J. & Kromkamp, J.K. (2010). Composition and heterogeneity of the microbial community in a coastal microbial mat as revealed by the analysis of pigments and phospholipid-derived fatty acids. Journal of Sea Research, 63: 62–70.
- Halnet, D., Wiencke, C. & Nultsch, W. (1997). Influence on UV radiation on the photosynthesis of Arctic macroalgae in the field. Journal of Photochemistry and Photobiology B Biology, 38: 40–47.
- Helmuth, B.S. & Hofmann, G.E. (2001) Microhabitats, thermal heterogeneity, and patterns of physiological stress in the rocky intertidal zone. Biological Bulletin, 201: 374–384.
- Hobel, C.F.V., Marteinsson, V.T., Hreggvidsson, G.O. & Kristjansson, J.K. (2005). Investigation of the microbial ecology of intertidal hot springs by using diversity analysis of 16S rRNA and chitinase genes. Applied and Environmental Microbiology, 71: 2771–2776.
- Kale, V., Björnsdóttir, S.H., Fridjónsson, O.H., Pétursdóttir, S.K., Omarsdóttir, S. & Hreggvidsson, G.O. (2013). Litorilinea aerophila gen. nov., sp. nov., an aerobic member of class Caldilineae, phylum Chloroflexi, isolated from an intertidal hot spring. International Journal of Systematics Evolutionary Microbiology, 63: 1149–1154.
- Karsten, U. (1996). Growth and organic osmolytes of geographically different isolates of Microcoleus chthonoplastes (Cyanobacteria) from benthic microbial mats: response to salinity change. Journal of Phycology, 32: 501–506.
- Krieger-Liszkay, A. (2005). Singlet oxygen production in photosynthesis. Journal of Experimental Botany, 56: 337–346.
- Kumar, D.P. & Murthy, S.D.S. (2007). Photoinhibition induced alterations in energy transfer process in phycobilisomes of PS II in the cyanobacterium, Spirulina platensis. Journal of Biochemistry and Molecular Biology, 40: 644–648.
- La Rocca, N., Sciuto, K., Meneghesso, A., Moro, I., Rascio, N. & Morosinotto, T. (2015). Photosynthesis in extreme environments: responses to different light regimes in the Antarctic alga Koliella antarctica. Physiologia Plantarum, 153: 654–667.
- Lichtenthaler, H.K. & Wellburn, A.R. (1983). Determination of total carotenoids and chlorophyll a and b of leaf extract in different solvents. Biochemical Society Transactions, 11: 591–592.
- Matsui, K., Nazifi, E., Hirai, Y., Wada, N., Matsugo, S. & Sakamoto, T. (2012). The cyanobacterial UV-absorbing pigment scytonemin displays radical scavenging activity. Journal of General and Applied Microbiology, 58: 137–144.
- Medlin, L., Elwood, H.J., Stickel, S. & Sogin, M.L. (1998). The characterization of enzymatically amplified eukaryotic 16S-like rRNA-coding regions. Gene, 71: 491–499.
- Moro, I., Rascio, N., Larocca, N., Dibella, M. & Andreoli, C. (2007). Cyanobacterium aponinum, a new Cyanoprokaryote from the microbial mat of Euganean thermal springs (Padua, Italy). Algological Studies, 123: 1–15.
- Murata, N., Takahashi, S., Nishiyama, Y. & Allakhverdiev, S.I. (2007). Photoinhibition of photosystem II under environmental stress. Biochimica et Biophysica Acta, 1767: 414–421.
- Nishiyama, Y., Allakhverdiev, S.I. & Murata, N. (2005). Inhibition of the repair of photosystem II by oxidative stress in cyanobacteria. Photosynthesis Research, 84: 1–7.
- Platt, T., Gallegos, C.L. & Harrison, W.G. (1980). Photoinhibition of photosynthesis in natural assemblages of marine-phytoplankton. Journal of Marine Research, 38: 687–701.
- Porra, R.J., Thompson, W.A. & Kriedemann, P.E. (1989). Determination of accurate extinction coefficients and simultaneous equations for assaying chlorophylls a and b extracted with four different solvents: verification of the concentration of chlorophyll standards by atomic absorption spectrometry. Biochimica et Biophysica Acta, 975: 384–394.
- Rautenberger, R. & Bischof, K. (2006). Impact of temperature on UV susceptibility of two species of Ulva (Chlorophyta) from Antarctic and subantarctic regions. Polar Biology, 29: 988–996.
- Rothrock, M. J. & Garcia-Pichel, F. (2005). Microbial diversity of benthic mats along a tidal desiccation gradient. Environmental Microbiology, 7: 593–601.
- Schreiber, U. (1986). Detection of rapid induction kinetics with a new type of high-frequency modulated chlorophyll fluorimeter. Photosynthesis Research, 9: 261–272.
- Singh, M., Yamamoto, Y., Satoha, K., Aroc, E.M. & Kanervoc, E. (2005). Post-illumination-related loss of photochemical efficiency of Photosystem II and degradation of the D1 protein are temperature-dependent. Journal of Plant Physiology, 162: 1246–1253.
- Soitamo, A., Havurinne, V. & Tyystjärvi, E. (2017). Photoinhibition in marine picocyanobacteria. Physiologia Plantarum, 161: 97–108.
- Sokal, R.R. & Rohlf, F.J. (1995). Biometry: The Principles and Practice of Statistics in Biological Research. 3rd ed. W.H. Freeman and Co., New York.
- Stamenković, M. & Hanelt, D. (2013). Protection strategies of Cosmarium strains (Zygnematophyceae, Streptophyta) isolated from various geographic regions against excessive photosynthetically active radiation. Photochemistry and Photobiology, 89: 900–910.
- Tyystjärvi, E. (2013). Photoinhibition of Photosystem II. International Review of Cell Molecular Biology, 300: 243–303.
- Wada, N., Sakamoto, T. & Matsugo, S. (2013). Multiple roles of photosynthetic and sunscreen pigments in cyanobacteria focusing on the oxidative stress. Metabolites, 3: 463–483.
- Walters, R. (2005). Towards an understanding of photosynthetic acclimation. Journal of Experimental Botany, 56: 435–447.
- Wieland, A. & Kühl, M. (2006). Regulation of photosynthesis and oxygen consumption in a hypersaline cyanobacterial mat (Camargue, France) by irradiance, temperature and salinity. FEMS Microbial Ecology, 55: 195–210.
- Wilson, A., Ajlani, G., Verbavatz, J.M., Vass, I., Kerfeld, C.A. & Kirilovsky, D. (2006). A soluble carotenoid protein involved in phycobilisome-related energy dissipation in cyanobacteria. Plant Cell, 18: 992–1007.
- Zhang, D., Zhang, Q.S. & Yang, X.Q. (2017). Seasonal dynamics of photosynthetic activity in the representative brown macroalgae Sargassum thunbergii (Sargassaceae Phaeophyta). Plant Physiology and Biochemistry, 120: 88–94.