
ABSTRACT
Series Maximi is a group within Desmodesmus (Chlorophyta) which contains the three species D. maximus, D. perforatus and D. tropicus. Besides their large cell sizes, the most striking morphological trait unique to the members of this genus is the presence of large perforations between the coenobial cells. The perforations are either present (D. perforatus and D. tropicus) or the space between the cells is completely sealed (D. maximus). We report here a fourth species of the series based on two strains (AICB 1155 and AICB 1572) from freshwater environments of the Danube Delta, Romania. The ultrastructure of the cell walls revealed a partial closure of the space between the cells which creates slightly visible perforations in light microscopy. Analyses of DNA sequences and secondary structure of the ITS2 fragment by coalescent (PTP, GMYC), distance (ASAP), and evolutionary modelbased methods (ML, BI) indicated a fourth candidate species which included both the AICB strains investigated and other strains with similar morphological traits from reference literature. Despite its poor representation in public databases, analysis of the SSU rDNA gene for the series Maximi strengthened the ITS2 results. Therefore, based on its larger cell sizes relative to the other members of the series, cell morphology, the presence of partial perforations and other peculiarities of the cell wall ultrastructure, the independent phylogenetic position, CBCs analysis, and a different ‘DNA signature’ within the ITS2 fragment we suggest that this clade should be described as a new taxon of the series Maximi, Desmodesmus pseudoperforatus sp. nov.
Highlights
Morphological differences and DNA-based lines of evidence indicate new species.
Microperforations of the space between the coenobial cells.
Strains have the largest cell sizes in the series Maximi.
Introduction
Desmodesmus (R.Chodat) S.S.An, T.Friedl & E.Hegewald is a genus comprising unicellular green algae well known for their phenotypic plasticity (An et al., Citation1998; Van Hannen et al., Citation2002), present in the freshwater plankton of eutrophic lakes, reservoirs, ponds and swamps (Chang et al., Citation1989). Its substantial intra- and interspecific morphological variation has led to the description of many morphospecies (Uherkovich et al., Citation1966; Hortobágyi, Citation1969, Citation1971, Citation1980; Pankow, Citation1986). Hegewald (Citation2000) cleared up much of the confusion, reducing the genus to 32 morphospecies and 23 varieties (Hegewald, Citation2000). In defining morphospecies boundaries, the ultrastructure of the cell wall was used as a reliable character in many taxonomic studies (Bisalputra & Weir, Citation1963; Bisalputra et al., Citation1964; Komárek & Ludvík, Citation1971, Citation1972; Massalski et al., Citation1974; Staehelin & PickettHeaps, Citation1975a, Citation1975b; Hegewald & Schnepf, Citation1979; Chang & An, Citation1989; Hegewald, Citation1997; Jeon & Hegewald, Citation2006).
The emergence of molecular data overcame the difficulties related to morphological data. The correspondence between morphological concepts and the phylogenetic concept in the taxonomy of the genus Desmodesmus was assessed in many studies (Kessler et al., Citation1997; Lewis, Citation1997; An et al., Citation1998; van Hannen et al., Citation2002; Hegewald & Wolf, Citation2003; Vanormelingen et al., Citation2007; Hegewald et al., Citation2010). The benefits and constraints of the one-concept approach have led to several researchers advocating a synergistic use of both morphological and molecular data (Milstein & Saunders, Citation2012; Škaloud & Rindi, Citation2013). Consequently, in recent papers, algal species delimitation is based on molecular data corroborated with morphology, ecology or (eco) physiology of the specimens (Leliaert et al., Citation2014; Demura et al., Citation2021; Krivina et al., Citation2022). However, morphological/ecological divergence often lags, making species delimitation on phenotypic grounds problematic (i.e. recently diverging species or taxonomic groups that are morphologically very similar) (John & Maggs, Citation1997; Leliaert et al., Citation2014; Leliaert & De Clerck, Citation2017; Struck et al., Citation2018).
Various molecular methods have been put forward to define species including coalescent, distance and evolutionary model-based methods (Mutanen et al., Citation2015; Zou et al., Citation2016; Krivina et al., Citation2022; Sciuto et al., Citation2023). Specific evolutionary models are required in maximum likelihood (ML) and Bayesian inference (BI), the two methods that are extensively used in phylogenetic studies (Luo et al., Citation2010). Another popular approach is the General Mixed Yule Coalescent (GMYC) method which estimates species boundaries directly from the branching rates of an ultrametric tree (Fujisawa & Barraclough, Citation2013). The algorithm detects the transition from where the branch length can be explained by speciation (phylogeny) to when it can be explained by the intra-species coalescent process (species genealogy) (Pons et al., Citation2006). The Poisson Tree Process method (PTP) likewise uses coalescent theory to distinguish species (Zhang et al., Citation2013). Identifying a ‘barcode gap’ between inter- and intraspecific diversity is another procedure to identify putative species as implemented in the ASAP (Assemble Species by Automatic Partitioning) algorithm (Puillandre et al., Citation2012, Citation2021).
In recent years, analysis of ITS2 has been extensively exploited as a phylogenetic tool in Desmodesmus taxonomy (An et al., Citation1998; Hegewald & Wolf, Citation2003; Jeon & Hegewald, Citation2006; Hegewald et al., Citation2010, Citation2013; Fawley et al., Citation2011; Markert et al., Citation2012; Hegewald & Braband, Citation2017; Dragoș et al., Citation2019; Demura et al., Citation2021; Nguyen et al., Citation2023) which seems to correlate with the ultrastructural features of the cell wall. The distinctive characteristics of its secondary structure enhanced precision and robustness in reconstruction of phylogenetic trees (Keller et al., Citation2010). Although its sequence may vary, the secondary structure is conserved throughout eukaryotes and consists of four helices, the third being the longest (Mai & Coleman, Citation1997; Joseph et al., Citation1999; Schultz et al., Citation2005). The ITS2 database (Ankenbrand et al., Citation2015) is a useful tool providing both the primary and the secondary structures of ITS2 records. Most of the ITS2 structural conformations are homology modelled (Wolf et al., Citation2005), based on a limited number of directly folded templates, following the structure proposed by An et al. (Citation1998). This model was later revised based on a minimum energy folding and helix I folded into an atypical Y-shape structure (Van Hannen et al., Citation2002), and re-revised by Markert et al. (Citation2012). For each new taxon sampled, the benefit of using the Y-shaped structure has to be tested (Markert et al., Citation2012).
The fast-evolving ITS2 sequence maintains its function by Compensatory Base Change (CBC), where a base substitution on one side is balanced by a substitution on its base pair. The occurrence of CBCs in helix II or helix III of the ITS2 secondary structure is said to be correlated with species delineation and sexual incompatibility in eukaryotes (Coleman, Citation2000). A large-scale analysis that examined the concept further revealed that in 93% of cases, at least one CBC indicates distinct species and the lack of it indicates the same species in 76% of cases (Müller et al., Citation2007). Thus, the absence of CBCs in ITS2 secondary structures is not always an indicator that two organisms belong to the same species, confirmed by studies of cases of recent speciation (Caisová et al., Citation2011, Citation2013).
Series Maximi (Hegewald, Citation1978) is a subsection of the genus and includes three species: D. perforatus (Lemmermann) E.Hegewald, D. tropicus (W.B.Crow) E.Hegewald and D. maximus (West & G.S.West) Hegewald (Jeon & Hegewald, Citation2006). The first two species exhibit conspicuous perforations between coenobial cells while D. maximus lacks perforations (Jeon & Hegewald, Citation2006). So far, all members of the series Maximi share the same cell wall ultrastructure (Jeon & Hegewald, Citation2006). We showed the existence of a fourth cluster (Dragoș et al., Citation2019) based on ITS2 sequence-structure phylogeny and CBC analysis. Unfortunately, only one of the strains has been morphologically characterized (GenBank AF421876) (Jeon & Hegewald, Citation2006) as the analysis of AM410649 has not been published and KP878506 has not been characterized (Leliaert et al., Citation2014), thus the status of this cluster remained unresolved. A new strain subsequently assigned to D. tropicus (dSgDes-eco6) fell into the same lineage (Demura et al., Citation2021).
In this study we strengthened the fourth clade by adding two more strains isolated from the Danube Delta (Romania) (AICB 1155 and AICB 1572) and named a fourth species of the series Maximi, Desmodesmus pseudoperforatus sp. nov. Morphological traits of the AICB strains were assessed by light and electron microscopy and their size and shape were fully analysed. We explored the congruence of different taxonomic methods: coalescent (GMYC, PTP), distance (ASAP), and evolutionary model-based methods using both sequence-only and sequence-structure ITS2 data (CBCs included). Small ribosomal SSU gene analysis was used to support the ITS2 results.
Materials and methods
Strain cultures and growth assay
Four-cell coenobia were isolated from the Danube Delta: Nebunu Lake in 2016 (AICB 1155) and Partizani village pond in 2019 (AICB 1572) (Supplementary table S1). They are currently deposited in the Algal Culture Collection of the Institute of Biological Research (AICB), Cluj-Napoca, Romania (Dragoș et al., Citation1997). AICB 1155 was also deposited as a fixed specimen in 10% formalin solution in the Herbarium of Babeș-Bolyai University, Cluj-Napoca (No. CL672118). The algae were grown on Bold’s Basal Medium (BBM) (Bold, Citation1949; Bischoff & Bold, Citation1963) at room temperature (22 ± 2°C), in sunlight (southern exposure) or fluorescent light (20 µmol m‒2 s‒1), with/without aeration. Both strains were cultured for approximately 3 years. Samples were taken at different time points during their growth and analysed with light and electron microscopy.
Light and electron microscopy
Photographs were taken with a Nikon TE-2000 Eclipse microscope equipped with a Nikon D90 digital camera. The cell measurements, and the frequency of the 2-, 4- and 8-cell coenobia were analysed from at least 50 photographs, which seems to be a reliable threshold to detect most of the morphological variations (Dragoș et al., Citation2019). In order to show the mucilaginous sheath and the perforations between the cells, some samples were stained with Indian ink. For transmission electron microscopy (TEM) thin sections were prepared following Hegedűs et al. (Citation2015) and examined with a Jeol JEM1010 microscope. The scanning electron microscopy (SEM) procedure involved fixation with 4% glutaraldehyde in BBM medium and followed Dragoș et al. (Citation2019).
Cell measurements and statistical analysis
Cell length, cell width, spine length, and the length of the adhesion area between the cells were measured. To survey as much of the morphological variability as possible, we examined coenobia from different cultures, over 3 years for each strain. Strains of D. communis (AICB 1007, AICB 1554) and D. pseudocommunis (AICB 1004, 1558) were analysed in the same manner to address the intraspecific vs. interspecific variability. JASP v.0.17.3 (2023) was used to explore relationships among the cell measurements by Pearson’s correlation, analysis of variance by one-way ANOVA and MANOVA, and paired-samples t-test. To explore the within-species and across-species variability, the similarity percentage (SIMPER), the analysis of similarity (ANOSIM) (Clarke, Citation1993), Principal Components Analysis (PCA) and Linear Discriminant Analysis (LDA) were carried out in PAST 4.13 software (Hammer et al., Citation2001).
DNA extraction, PCR amplification and DNA sequencing
Genomic DNA was extracted using the Quick-DNA™ Faecal/Soil Microbe Kits (Zymo Research, Irvine, California, USA) according to the manufacturer’s instructions. PCR and DNA sequencing were carried out with the primers designed by Sawayama et al. (Citation1995) for the SSU rRNA genes and primers designed for the ITS1-5.8S-ITS2 region (Hegedűs et al., Citation2015).
The PCR mix contained 1.25 units of DreamTaq DNA Polymerase (Fermentas, Canada) in the manufacturer’s buffer, 1.5 mM MgCl2, 0.2 mM dNTP and 0.4 μM primer in a final volume of 50 μl. The tubes were incubated using a TGradient thermal cycler (Biometra, Germany) with an initial denaturation at 95°C for 5 min followed by 32 cycles of 95°C for 45s, 56°C for 55s, 72°C for 2 min and a final incubation at 72°C for 10 min. Direct sequencing was carried out by Macrogen Europe BV (the Netherlands). The sequences were submitted to GenBank (Benson et al., Citation2013) (Supplementary table S1).
ITS2 sequence analysis
The ITS2 phylogenetic analysis was built on 144 Desmodesmus sequences and two sequences from Ankistrodesmus falcatus as outgroup. Fifteen sequences were newly sequenced strains from the AICB collection (Supplementary table S1) and the rest were retrieved from the ITS2 database (Ankenbrand et al., Citation2015). The sequences were aligned by Clustal W (Larkin et al., Citation2007), implemented in MEGA X software (Kumar et al., Citation2018). The symmetrical model with gamma distribution (SYM+G4) was the best-fit evolutionary model calculated with Model Finder (Kalyaanamoorthy et al., Citation2017) based on both the Akaike Information Criterion (AIK) and the Bayesian Information Criterion (BIC). Subsequently, the ML tree was generated using the IQ-Tree online tool (http://iqtree.cibiv.univie.ac.at/) (Trifinopoulos et al., Citation2016) with SYM+G4 (shape parameter 0.43) as evolutionary model. The branch support analysis was inferred by 1000 ultrafast bootstrap alignments (Hoang et al., Citation2018), SH-aLRT branch test (1000 replicates), and approximate Bayes support.
We tested species boundaries by assessing intra- and interspecific divergence using the ASAP webserver for species delimitation (Puillandre et al., Citation2021). The Kimura 80 (Kimura, Citation1980) substitution model was used to compute the distance matrix.
The Poisson Tree Process (PTP) method infers speciation events based on a shift in the number of substitutions between internal nodes (Zhang et al., Citation2013). Species delimitation was determined on the PTP webserver (https://species.h-its.org/ptp/), using the Maximum Likelihood implementation (hereafter mlPTP) and the Bayesian implementation (bPTP). The input tree was generated with the IQ-Tree online tool using the SYM+G4 evolutionary model and SH-aLRT branch support (1000 replications).
For GMCY analysis, an ultrametric tree was first constructed in BEAST v. 2.7.5 (Bouckaert et al., Citation2019) which uses a Bayesian framework. The priors designated in BEAUTi (from the BEAST suite) were: GTR+G as substitution model, empirical base frequencies, Yule speciation model and an optimized relaxed clock. The rest of the settings were left as default. The length of the MCMC chain was 50 × 106, sampling every 5000. The ESS values (>200) were evaluated with Tracer v.1.5.0 (20% burn-in). Subsequently, TreeAnnotator 1.10.4 (Drummond & Rambaut, Citation2007) was applied to summarize the information from the sample of trees produced by BEAST into a maximum clade credibility tree (10% burn-in). This tree was used to generate the GMCY tree in R v.4.3.1 (2012) using the ‘ape’ (Paradis & Schliep, Citation2019) and ‘splits’ (Ezard et. al.¸ Citation2009) packages. The trees were edited with iTOL v6.
ITS2 sequence-structure analysis
The ITS2 database was utilized for hidden-Markov model (HMM)-based sequence annotation (Keller et al., Citation2009) and homology modelling of individual secondary structures (Wolf et al., Citation2005; Selig et al., Citation2008) of the newly sequenced strains. The models were selected based on a 100% helix transfer for all four helixes.
Two sets of 146 sequences including their primary and secondary structures were generated. The first set contained the secondary structures derived from the ITS2 database. Within this database, most of the ITS2 secondary structures are inferred by homology modelling (Wolf et al., Citation2005; Selig et al., Citation2008), based on a few templates that were directly folded (Markert et al., Citation2012).
The primary sequences from the ITS2 database were used to generate a second set of secondary structures, directly folded on a minimum free energy basis. Individual secondary structures were created with RNA structure (Mathews et al., Citation1999). Thus, two different secondary structure models (modelled by homology and directly folded on a minimum energy basis) were used to build two sequence-structure alignments. The alignments were carried out in 4SALE 1.7 (Seibel et al., Citation2006, Citation2008) following the procedure outlined by other authors (Schultz & Wolf, Citation2009; Koetschan et al., Citation2012; Markert et al., Citation2012; Merget et al., Citation2012; Wolf et al., Citation2014; Heeg et al., Citation2015).
Sequence-structure based phylogenetic relationships were inferred by ML using General Time Reversible (GTR) as substitution model and a bootstrap support of 1000 replications. The sequence-structure ML trees were constructed in R v.4.3.1 using the ‘phangorn’ package (Schliep, Citation2011). Briefly, a one-letter coded alignment file containing sequence and structure information was generated in 4SALE 1.7 using a specified scoring matrix, fitted to a 12-letter alphabet. For calculating the ML tree in R, a starting Neighbour Joining (NJ) tree was constructed and the GTR+I+G evolutionary model was applied, following the protocol suggested by Wolf et al. (Citation2014). An example of the functions used in R, developed specifically for this type of analysis, can be found in the 4SALE 1.7 manual, section ‘ML structure trees’ (https://4sale.bioapps.biozentrum.uni-wuerzburg.de/mlseqstr.html). The CBCs matrix and the ITS2 secondary structures from the ITS2 database were further analysed using the CBCAnalyzer option implemented in 4SALE 1.7.
18S rRNA gene analysis
The SSU rDNA phylogenetic analysis was built on 49 sequences for Desmodesmus and two sequences for Ankistrodesmus as outgroup. Sixteen sequences were newly sequenced strains from the AICB collection (Supplementary table S1) and the rest were retrieved from GenBank. The sequences were aligned by the Clustal W algorithm in MEGA X. The ML tree was generated using the IQ-Tree online tool with TN+I + F as the best-fit evolutionary model calculated with Model Finder based on the BIC criterion. The branch support analysis was inferred by 1000 ultrafast bootstrap alignments, SH-aLRT branch test (1000 replicates), and approximate Bayes support.
Results
Morphological study of AICB 1155 and AICB 1572
The cell parameters varied for the two strains. Cell lengths (minimum-(mode)-maximum) were 15.5-(23.4)-35.7 µm in AICB 1155, and 15.3-(19.8)-28.2 µm in AICB 1572. Cell widths were 4.6-(7.4)-14.6 µm for AICB 1155 and 4.9-(6.4)-11.2 µm for AICB 1572. Spine length was 10.4-(21.9)-27.6 µm in AICB 1155 and 14-(19)-26.3 µm in AICB 1572. The length of the contact area between the cells was 8.8-(14.5)-25.7 µm in AICB 1155 and 11.6-(15.7)-22.9 µm in AICB 1572.
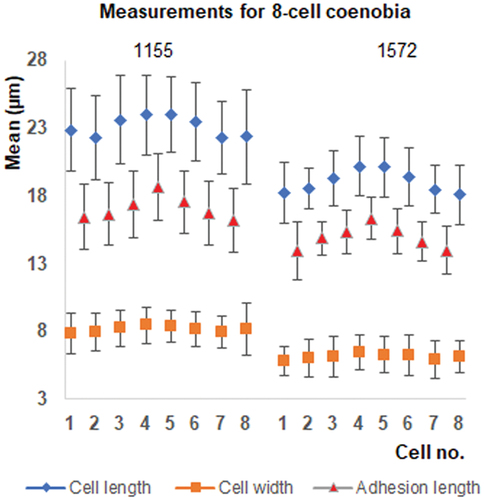
The matrix of ranked dissimilarities generated by ANOSIM (9999 permutations, Euclidean similarity index) showed a low level of dissimilarity (R = 0.07, p = 0.0001). A Pearson product-moment correlation showed strong correlation between cell length and cell adhesion area and a weak positive correlation between cell length and width in AICB 1155 (R = 0.83, R = 0.66, p < 0.001) and in AICB 1572 (R = 0.92, R = 0.74, p < 0.001). No relationship with the spine length was found. The MANOVA showed a difference in cell sizes related to the number of cells in the coenobium (AICB 1155 – Pillai’s Trace = 0.402, F(8, 1514) = 47.639, p < 0.001 and AICB 1572 – Pillai’s Trace = 0.361, F(8, 614) = 16.92, p < 0.001). In follow-up testing by one-way ANOVA (Supplementary table S2) of post-hoc comparisons using the Bonferroni correction, cell length and width increased with decreasing numbers of coenobial cells, the 2-cell coenobia having larger and wider cells (p < 0.001) than the 8-cell coenobia in both strains (Supplementary table S3). The 4-cell coenobial sizes were in between the 2- and the 8-cell coenobia (). A significant T-test result (p < 0.001) for 4- and 8-cell coenobia showed that the inner cells of the 8-cell coenobia are larger, with a larger adhesion area than the outer cells (). No significant cell width difference between the inner and the outer cells was observed (Supplementary table S4).
Fig. 1. Cell measurements (means and standard deviations) in strains AICB 1155 and 1572, showing the number of cells in the coenobium.
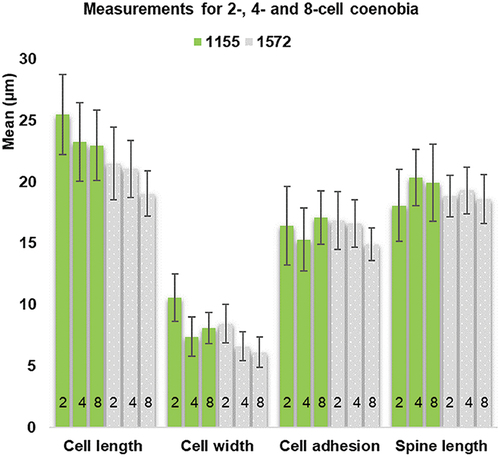
Fig. 2. Size differences among the cells of the 8-cell coenobia (mean and standard deviation) for strains AICB 1155 and 1572. The coenobial cells were counted from left to right.
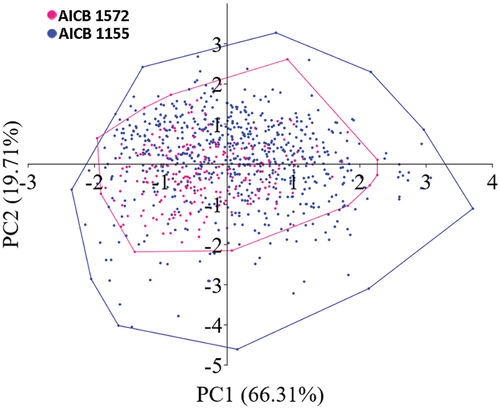
Investigation of variability of D. pseudoperforatus in 2- to 8-cell coenobia with equal number of cells showed a significant difference (post hoc comparison in one-way ANOVA; Supplementary table S5) between the strains (). AICB 1155 had larger and wider cells than AICB 1572 (p > 0.001) (, Supplementary table S6), which account for most of the within-species variation. The cell length and width, and cell adhesion area explained 66.31% of the variance within the species, while the spine length accounted for 19.71% (). SIMPER showed that cell length accounts for c. 35% of the dissimilarity between the strains, followed by cell adhesion area (24%), spine length (24%) and cell width (17%).
Fig. 3. Scatter plot of principal component analysis (PCA) indicates a near-complete overlap between cell measurements for AICB 1155 and AICB 1572. (The axis labels indicate the % variance explained by the two principal components (PC)).
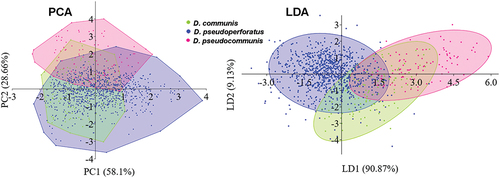
To compare the within-species and across-species variability, four strains of D. communis (AICB 1007, 1554) and D. pseudocommunis (AICB 1004, 1558) were analysed (). ANOSIM showed significant differences (p = 0.0001), but the effect on the cell parameters was low (R = 0.37) (, Supplementary tables S7, S8). The three species had similar cell sizes, and D. pseudoperforatus and D. communis almost completely overlapped (PCA analysis; ). In the LDA analysis, cell width (0.74) and length (0.62) parameters were more effective in differentiating among species than the cell adhesion area (0.32) and spine length (0.32); LD1 accounted for 90.87% of the separation among species ().
Fig. 4. Scatter plots of principal component analysis (PCA) and linear discriminant analysis (LDA), based on cell measurements of Desmodesmus communis, D. pseudocommunis and D. pseudoperforatus. The PC axes indicate the % variance explained by the principal components and the LDA axes indicate the % of the separation between groups explained by the discriminant functions (LD).
AICB 1155 and AICB 1572 cultures had coenobia with 4 cells (75.93% and 80.46%), 8 cells (8.62% and 7.01%) and 2 cells (15.45% and 12.53%), arranged in linear series (), straight () or slightly curved in side view (). The cells were long, cylindrical with rounded () or slightly truncated poles (). The poles of the outer cells were slightly curved towards the spine attachment site (). The side margin of the outer cells was slightly convex, almost straight in some coenobia (). Long, slightly curved, conspicuous spines were attached to the poles of the outer cells (). Some coenobia (c. 7%) had supplementary spines on the outer/inner cells (), shifted cells (c. 2%) () or were 1 or 3 cells in length (≤ 0.5%) ().
Figs 5–23. Morphological traits of AICB 1155 () and AICB 1572 () strains. Coenobia with 1 cell (), 3 cells (), 2 and 4 cells (), 8 cells (), showing shifted cells () and additional spines (). The coenobia may be curved in side view () and show the mucilaginous sheath and slightly visible perforations between the cells when stained with Indian ink (). Fig. 15. A 4-celled coenobium at the end of cell division when each cell was releasing a new 4-celled coenobium. Fig. 18. Fine rib-like structures are interrupted by rosettes and tubular structures protruding through the honeycomb mesh, appearing as fine granules at the surface, can be seen on the empty coenobia. Fig. 17. Bristles which originate in the rosettes surround the coenobium.
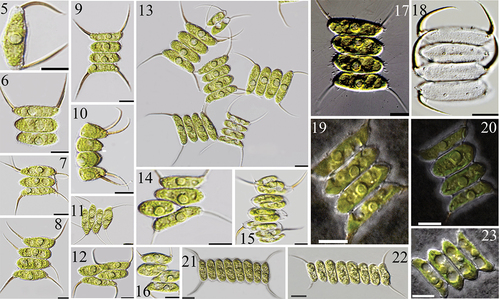
Irregular tubular structures named props (Bisalputra et al., Citation1964; Komárek & Ludvík, Citation1971) were scattered over the cell surface, supporting the hexagonal network of the cell wall (). These tubes clustered into spines (), fine longitudinal rib-like structures (Hegewald & Schnepf, Citation1979) () or circular openings termed rosettes (Komárek & Ludvík, Citation1972) (). The fine rib-like structures were difficult to observe (), except in empty coenobia (). Each coenobium was surrounded by numerous mucilaginous threads which were interconnected and formed the mucilaginous sheath () that covered the rosettes and enclosed the spines (). The presence of the rosettes on the truncated poles of the inner cells created the impression of ‘short spines’ () (Tsarenko et al., Citation1996). The chimney-like rosettes (Hegewald, Citation1997) were surrounded by tubes (). Inside the rosettes, various numbers of mushroom-like structures, ‘inner props’ (Massalski & Trainor, Citation1974), were disposed in a circle with 1–3 in the middle (). The rosettes were more elongated (two times higher than wide), with an opening <500 µm in diameter in D. tropicus AICB 1471 (Dragoș et al., Citation2019) () and AICB 1138 (), than rosettes in AICB 1155 and AICB 1572 () which were wider than high, with an opening > 1 µm in diameter (). The number of mushroom-like structures varied in different rosettes (), and at the bottom of the inner props, a cell wall thickening appeared less dense (). Delicate appendages named bristles were produced by the inner props and protruded through the mucilaginous sheath ().
Figs 24–39. Transmission electron microscopy of Desmodesmus pseudoperforatus AICB 1155 (), AICB 1572 () and D. tropicus AICB 1471 ), AICB 1138 (). b = bristles; ca = coenobial adhesive; chl = chloroplast; g = granules; in = inner layer adjacent to the plasmalemma; k = cell wall thickening at the bottom of the rosettes; mc = mucilaginous sheath; ms = mushroom-like structures; nt = hexagonal mesh sustained by tubular structures; p = perforations; pl = plasmalemma; ps = pseudoperforations; py = pyrenoid; r = rosettes; s = spine; t = fibrillar layer; tb = tubular structures; TLS = trilaminar structure.
Figs 40-45. Scanning electron microscopy of the AICB 1155 strain. Figs 40, 41. Cells are displayed linearly and rosettes are visible over the cell surface and at the cell Poles. Fig. 42. Rib-like structures can be seen along the cell wall, interrupted by rosettes. Fig. 43. Magnified rosette (side view) with visible bristles throughout its surface. Fig. 44. Magnified rosette (side view) and tubular structures that protrude through the honeycomb net. Fig. 45. Magnified rosette (front view) with mushroom-like structures at the bottom and visible honeycomb mesh.
Cross sections through the cell wall showed: (1) the outer reticulate layer that contained the epistructural elements (i.e. irregular tubes and rosettes) holding the honeycomb mesh and anchored in (2) the TLS (trilaminar structure), an electron translucent lamella sandwiched between two electron-dense leaflets; and (3) the inner layer adjacent to the plasma membrane (). In addition to the props, the surface of the TLS was covered by granules mostly seen in the contact area between the cells (). Numerous strands of fibrous material seemed to originate from the granules, stretched from one TLS to the other in the space between the cells (). The chloroplast, with a prominent pyrenoid, was located at the periphery of the cell () (Chang & An, Citation1989; Tsarenko et al., Citation1996).
The neighbouring cells were connected at their poles at the point of the V-shape between the cells by a fibrous strand of coenobial adhesive (), both ends of which were covered by a microfibrillar layer (). In both strains, the coenobial adhesive was approximately 1 µm in length with interruptions alongside the cell contact area (), resembling the perforations of D. tropicus (). Although actual perforations (sensu D. tropicus) were not seen (), the appearance of micro-perforations was clearly observed in TEM but barely seen in LM ().
Phylogenetic position of AICB 1155 and AICB 1572
The ITS2 secondary structure was identical to the model assigned to D. tropicus detailed by Jeon & Hegewald (Citation2006; Supplementary fig. S5). All D. pseudoperforatus members () shared a similar ITS2 pattern and had the DNA signature TTTCCCAACGCGCGTTAGCGTG identified in D. tropicus Hegewald Citation1998–18 (Nguyen et al., Citation2023).
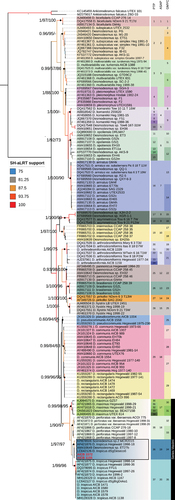
Fig. 46. ML tree of 146 ITS2 sequences generated with the IQ-Tree online tool (http://iqtree.cibiv.univie.ac.at/). Each clade that corresponds to a morphospecies is marked by a different colour and is supported by Bayesian PPs/Bootstrap analysis (1000 ultrafast bootstrap alignments)/Bootstrap support (1000 replicates) from the secondary ML phylogenetic tree (homology-modelled structures) (Supplementary fig. S1). Branches are coloured according to the SH-aLRT branch test results (1000 replicates). The candidate species provided by PTP (37 species), ASAP (20 species) and GMYC (35 species) are shown on the right. The numbering of the candidate species is in ascending order following the tree topology, beginning with Desmodesmus bicellularis. Series Maximi is marked by a black line and the D. pseudoperforatus cluster is framed. AICB 1155 and 1572 strains are in red. The tree was edited with iTOL (https://itol.embl.de).
Series Maximi consisted of three CBC-clades (sensu Coleman). D. pseudoperforatus was separated by 1–2 CBCs from D. maximus and by one CBC from D. perforatus. All CBCs were located at the tip of helix II (Supplementary fig. S5). No CBCs, but 3 hCBCs, were identified between D. tropicus and D. pseudoperforatus in helices I, II and III (Supplementary fig. S5). No CBC occurred between D. tropicus and D. perforatus (Supplementary dataset S1, Supplementary fig. S1).
The ITS2 sequence analysis yielded an ML tree (hereafter primary ML tree) with 21 distinct clades, 20 of them being strengthened with significant bootstrap and Bayesian support (). The number of clades corresponded to the number of species selected based on their taxonomic affiliation in public databases. D. pseudoperforatus formed a distinct cluster with high bootstrap and Bayesian support (1/97) and it was placed as sister taxon of D. tropicus.
Two sequence-structure alignments with different ITS2 secondary structures produced two ML sequence-structure trees (hereafter secondary ML trees). The structural conformations modelled by direct folding resembled the structure proposed by Van Hannen et al. (Citation2002) with a Y-shaped helix I (data not shown). The D. pseudoperforatus cluster was supported by both approaches with high bootstrap support (97 and 92 BP) (Supplementary fig. S1). Within the series Maximi, D. maximus and D. perforatus (except for CCAP 276–18) sequences formed distinct clusters with high bootstrap support in both secondary ML trees. In the secondary ML tree where the ITS2 structural conformations were directly modelled, the D. tropicus clade was not resolved, and two of its strains were linked to the other members of the series. This atypical topology had low bootstrap support (<70%). D. pseudoperforatus was linked to D. perforatus species with 84% BP. In the secondary ML tree where the structures were homology-modelled (provided by the ITS2 database), all D. tropicus sequences formed a cluster with 96% BP and three subclades (Supplementary fig. S1) and it was linked to D. pseudoperforatus with 71% BP. In both secondary ML trees with different structural conformations, the rest of the ITS2 sequences formed almost identical groups. Overall, the secondary ML trees and the primary ML tree showed no major incongruences (Fig. 50, Supplementary fig. S1) and D. pseudoperforatus sequences formed a robust cluster in all ML trees.
The D. pseudoperforatus clade shared a common ancestor with D. tropicus in the SSU rRNA ML tree (Supplementary fig. S6). The taxa in series Maximi formed a single group with full bootstrap and Bayesian support (100/1). Due to the poor representation of series Maximi SSU records in public databases, the consistency of the series Maximi clusters was weak (Supplementary fig. S6). Nevertheless, there was a clear separation between D. tropicus and D. pseudoperforatus, and the addition of new sequences will most likely strengthen and validate the separation.
In the distance-based approach (ASAP), candidate clusters/species were sorted and ranked by scores. The first partition with the lowest ASAP score (5.50) split Desmodesmus strains into 20 candidate species (Supplementary fig. S2) with a threshold distance of 3.6%. Most of the proposed species corresponded to the clusters from the phylogenetic trees with some exceptions (). According to this algorithm, D. communis, D. pseudocommunis and D. rectangularis were considered a single species, D. multivariabilis and D. pleiomorphus were grouped and D. komarekii and D. asymmetricus were split into two distinct species. The barcode-gap analysis split the series Maximi into four distinct clades that were congruent with the morphospecies, all D. pseudoperforatus sequences falling in a distinct cluster (Supplementary figs S2, S9).
The mlPTP tree showed a tree with 37 species in contrast to Bayesian identification that recovered 93 species. Thirteen of the 37 entities were consistent with the character-based analysis results of the groups revealed by ASAP (). The rest of them were split into multiple clusters within each species. Within the series Maximi, this algorithm recognized D. perforatus, D. tropicus and D. pseudoperforatus as candidate species, but D. maximus was split into five species (Supplementary fig. S3).
The GMYC results were similar to the mlPTP partition and showed 35 candidate species, 10 of them congruent with the primary ML phylogenetic tree (Supplementary figs S4, S5). This algorithm resolved D. tropicus and D. pseudoperforatus as distinct species but split D. maximus and D. perforatus into two species each.
Taxonomic assessment
GENUS: Desmodesmus (R. Chodat) S.S.An, T.Friedl & E.Hegewald (An et al., Citation1998)
TYPE SPECIES: Desmodesmus pseudoperforatus A., Hegedűs et N.Dragoș, sp. nov. ()
DIAGNOSIS: Straight, sometimes curved coenobia, 2-, 4- and 8-cells long, linearly disposed. Oblong cells (15.6–35.7 μm × 4.6–14.6 μm) with round or truncated poles, external cells with side margin straight to convex with the apex slightly curved towards the spine attachment site. Cells often shifted from linear disposition. Coenobia with 1 and 3 cells occasionally present. Micro-perforations between the cells, hardly distinguishable in light microscopy. A conspicuous spine (10.4–27.6 μm) inserted in each pole of the external cells. Supplementary spines on the inner and/or the outer cell poles sometimes present. Rosettes present along fine rib-like structures, at the pole of each cell and the base of the spine attachment site. Cell wall with hexagonal network. This species differs from other members of the series Maximi by its large cell sizes, partially sealed space between the coenobial cells, cell wall ultrastructural traits, SSU rRNA gene sequence, and primary and secondary structure of the ITS2 sequence.
ETYMOLOGY: The prefix pseudo- (from Greek ψευδής, pseudes, ‘false’) is for the presence of the cryptic perforations between the cells which cannot be considered as ‘true’ perforations (sensu D. perforatus and D. tropicus) and -perforatus (from the Perfect Passive Participle of the Latin verb perforō., ‘pierced’, ‘penetrated’) which was used to indicate that the space between the cells contains micro-perforations.
TYPE LOCALITY: Danube Delta, Nebunu Lake, Romania.
HOLOTYPE: AICB 1155 is currently deposited as living material in the AICB collection at the Institute of Biological Research, Cluj-Napoca, Romania, and as fixed material in 10% formalin at the Herbarium of Babeș-Bolyai University, Cluj-Napoca (No. CL672118).
HOLOTYPE DNA ACCESSION NUMBER: GenBank ID: OR576697 (partial SSU rDNA, complete ITS1, complete 5.8S rDNA, complete ITS2, partial 28S rDNA).
Discussion
This study focused on describing a new species from the genus Desmodesmus, series Maximi, based on two strains isolated from the Danube Delta region, Romania. Comparative morphological analysis of AICB 1155 and AICB 1572 strains aimed to identify similar traits (species-specific traits), and to define within-species variation. We addressed the issue with caution due to the known morphological plasticity of Desmodesmus species.
The relationships among the cell parameters were similar for the two strains, despite the AICB 1155 strain exhibiting greater values than AICB 1572. Three of the four parameters tested accounted for most of the variation within species, with cell length and width having the greatest impact. However, the cell measurements varied widely for each parameter and often overlapped those of closely related taxa which explains why identifying Desmodesmus species from field samples may be very difficult based on shape and cell size alone so that additional analyses are required to define species boundaries.
Cell wall ultrastructure is an important taxonomic feature for Scenedesmaceae. The ultrastructural traits of D. pseudoperforatus strains matched those of Maximi strains, including cell wall layers (Bisalputra & Weier, Citation1963, Citation1964; Komárek & Ludvík, Citation1972; Staehelin & Pickett-Heaps, Citation1975a, Citation1975b), coenobial adhesive morphology (Dragoș et al., Citation2019), chimney-like rosettes (Komárek & Ludvík, Citation1971, Citation1972; Hegewald & Schnepf, Citation1979; Hegewald, Citation1997; Hegewald & Braband, Citation2017), and the presence of bristles (Trainor & Burg, Citation1965; Tsarenko et al., Citation1996; Jeon & Hegewald, Citation2006; Hegewald & Braband, Citation2017; Dragoș et al., Citation2019). In some respects, D. pseudoperforatus differed from the other series members. Less developed mucilaginous sheet, but not lacking as in D. maximus (Jeon & Hegewald, Citation2006), rosettes resembling the description for D. maximus (Komárek & Ludvík, Citation1971, Citation1972; Chang & An, Citation1989; Tsarenko et al., Citation2005), and the presence of micro-perforations were the traits that distinguished D. psudoperforatus from the closely related D. tropicus. The reduced size of the perforations may explain why they are difficult to spot and they may explain the thickness of the cell contact area which was observed in light microscopy. Interestingly, the incomplete closure of the cell walls was encountered by others (Staehelin & Pickett-Heaps, Citation1975b) in the daughter coenobia of D. maximus, in the process of TLS and coenobial adhesive formation (which occur at the same time). The authors described the different stages of the coenobial adhesive formation, ending with a complete enclosure of the space between the cells, before the cell division of the mother cell. In contrast, in both AICB strains, the coenobial adhesive remained incomplete in fully developed coenobia. The presence of these micro-perforations creates a certain looseness in the contact area which may explain the occurrence of the coenobia with shifted cells, a phenomenon also observed in D. tropicus (Dragoș et al., Citation2019). The presence of micro-perforations in all our micrographs, and the consistency in the size of the coenobial adhesive and its location (towards the cell poles) ruled out the possibility of an artefact. Interestingly, the sporadic and poorly developed nature of perforations was seen in other strains assigned to D. tropicus such as dSgDeseco6 (Demura et al., Citation2021) and Hegewald Citation1998–18 (Jeon & Hegewald, Citation2006), which grouped with AICB 1155 and AICB 1572 strains in the phylogenetic analysis. The AICB strains share these traits with Hegewald Citation1998–18: larger cells, longer spines and a poorly developed mucilaginous sheath (Jeon & Hegewald, Citation2006). From their measurements, corroborated with our data from AICB 1155, we conclude that these strains have the greatest cell lengths, cell widths, and spine lengths within the series Maximi.
To address the challenges associated with phylogenetic reconstruction and species delimitation many authors advocate multi-locus approaches (e.g. tufA, rbcL, SSU rRNA, ITS1, ITS2), often concatenated (Caisová et al., Citation2013; Zou et al., Citation2016; Krivina et al., Citation2022). Unfortunately, in public databases, most of the gene records for the series Maximi (SSU rRNA and ITS2) were from different strains. Of 24 strains with ITS2 records, only six had SSU rRNA sequences, and rbcL was deposited for only one strain of D. maximus (GenBank ID HG514365). Thus, given the wider availability of analytical tools and ITS2 barcodes for the series Maximi deposited in the ITS2 Ribosomal DNA Database, we used this marker for phylogenetic analysis and the SSU rDNA to support it.
The morphological differences between D. pseudoperforatus and D. tropicus were supported by the analysis of the ITS2 secondary structure. The ITS2 secondary structure of AICB 1155 and 1572 matched the model of the four helices described previously in green algae and plants (Mai & Coleman, Citation1997) and throughout Eukaryota (Schultz et al., Citation2005). The presence of three hCBCs may suggest two varieties of the same species as for D. perforatus var. perforatus and D. perforatus var. iberaësis (Jeon & Hegewald, Citation2006), but there are conspicuous morphological differences. The absence of CBCs does not preclude the recognition of different species as two organisms that lack a CBC have only 76% probability of being the same species (Müler et al., Citation2007). The absence of CBCs in different species was also encountered in some Ulvophycean species (Caisová et al., Citation2011), and species of Coelastrella (Kaufnerová & Eliáš, Citation2013), Chodatodesmus (Sciuto et al., Citation2015) and Desmodesmus (Caisová et al., Citation2013).
Another distinction between D. tropicus and D. pseudoperforatus is their relationship with the other two members of the series Maximi. Based on the CBCs occurrence, the D. pseudoperforatus clade was more closely related to D. tropicus than D. pseudoperforatus and D. maximus. These substitutions were located in helix II, which has functional and evolutionary significance and it and helix III are the most conserved regions in the ITS2 secondary structure (Coleman, Citation2009). The close phylogenetic relationship between D. tropicus and D. pseudoperforatus could be explained by a recent speciation event where insufficient time has passed to increase the ‘gap’ between the species (Struck et al., Citation2018; Struck & Cerck, Citation2019).
The existence of a ‘DNA signature’ that served as a species boundary marker (Nguyen et al., Citation2023) in the primary structure of ITS2 provided another argument for supporting D. pseudoperforatus as a distinct species. More recently, the authors used these ‘DNA signatures’ to affiliate sequences to the genera Tetradesmus, Desmodesmus and Scenedesmus (Mai et al., Citation2023). In the phylogenetic analysis, both the primary and the secondary ML trees recovered four clades within the series Maximi, including D. pseudoperforatus, which had significant bootstrap and Bayesian support. Homology-modelled and directly folded secondary ML trees produced similar ITS2 topologies, with minor differences, mostly related to unaffiliated sequences. Overall, the use of homology-modelled structures resulted in a more robust tree, with four strengthened clades within the series Maximi. The reason for the tree’s robustness is presumably because homology modelling reduces the impact of artefacts. The artefacts can easily occur when structures are individually folded and in most cases, they have to be manipulated to achieve consistency among the structures of a given dataset (Markert et al., Citation2012). The phylogenetic relationships among the members of the series Maximi resembled those obtained by Hegewald et al. (Citation2010) who generated homology-modelled ITS2 structures based on a single template. Thus, D. maximus was more closely related to D. perforatus than D. tropicus and formed one clade (Hegewald et al., Citation2010). Interestingly, a subclade that included the Hegewald Citation1998–18 strain was present in the D. tropicus cluster (Hegewald et al., Citation2010). New sequences in our study separated this subclade into a distinct cluster (i.e. D. pseudoperforatus), closely related to D. tropicus.
Overall, using secondary structures directly folded on a minimum energy basis, the components of the clusters were almost identical to the phylogenetic tree built on the sequence-only ITS2 data. In addition, all the sequences that fell into the D. pseudoperforatus clade were also recognized as a distinct species by ASAP, mlPTP and GMYC approaches. On the whole, the ITS2 sequences were over-split by the GMYC and PTP models (35 and 37 putative species) relative to the ASAP ‘barcode-gap’ analysis (20 species) which was more congruent with the number of morphospecies (21) included in the analysis. This result was not surprising as PTP and GMYC algorithms often produce similar estimates of species limits (Lang et al., Citation2015; Luo et al., Citation2018). While our results were obtained with a specific data set and may not be directly applicable to other cases, other researchers have noticed that GMYC entities overestimate the number of morphospecies (Talavera et al., Citation2013). This incongruence may result from the overlap between inter- and intraspecific divergences. Although several efforts have been made to define a threshold, none can be generalized to all organisms (Meier et al., Citation2008), but an interval of 1–3% is considered reasonable for metazoans for mitochondrial gene cytochrome c oxidase I (COI) (Puillandre et al., Citation2012). In Scenedesmus, the mean intraspecific distance for ITS ranged from 0–4.1% while the mean interspecific distances varied from 1.1% to 21.7% (Zou et al., Citation2016). The overlapping values indicate the difficulty in establishing boundaries in species delimitation in this genus known for its morphological plasticity, with no apparent ecophysiological or sexual reproductive boundaries. The distance among D. communis, D. rectangularis and D. pseudocommunis is probably in the intraspecific range, and consequently they tend to form one entity according to the ASAP results. Moreover, speciation is a process, and therefore uncertainty about precise species boundaries is inevitable in recently diverged lineages.
D. pseudoperforatus is the third member of the Maximi series isolated from the Danube Delta (Romania) (Cărăuș, Citation2017; Dragoș et al., Citation2019). Given the extensive biodiversity of the Danube Delta, this is not surprising. Furthermore, the River Danube gathers a wide variety of phytoplanktonic organisms across the 10 European countries it traverses.
The morphological differences between D. pseudoperforatus and the other three members of the series are the expression of morphological plasticity, a well-known phenomenon in response to grazing pressure (Lürling, Citation2003). The primary and secondary structure of the ITS2 showed notable distinctions, resulting in the formation of a distinct phylogenetic branch with high bootstrap support. With a partially closed space between the cells, D. pseudoperforatus occupies an intermediate position between the phenotype with a completely sealed space (D. maximus) and the phenotype with perforations (D. tropicus/perforatus) which may be explained by a recent divergence event. This species may not yet have had enough time to accumulate substantial morphological differences. The high level of genetic flexibility makes room for further Maximi species – possible cryptic species – that have not yet been discovered.
Author contributions
Hegedűs: responsible for the culturing, conception and design, DNA extraction, PCR amplification, and sequencing assay, analysis and interpretation of the data, drafting of the article, and obtaining financial support; S. Porav: responsible for the scanning electron microscopy analysis; S. Cassian Tripon: responsible for the transmission electron microscopy analysis. N. Dragoș: responsible for the light microscopy assay, the cell measurements, the critical revision of the article, and the final approval of the article.
Supplemental Material
Download Zip (4.4 MB)Acknowledgements
We would like to thank Cristian Coman who collected the samples from Danube Delta.
Disclosure statement
No potential conflict of interest was reported by the author(s).
Supplementary material
The following supplementary material is accessible via the Supplementary Content tab on the article’s online page at https://doi.org/10.1080/09670262.2024.2338510
Supplementary table S1. AICB_strains
Supplementary table S2. Coenobium type and the morphological parameters
Supplementary table S3. Comparisons of the coenobium type
Supplementary table S4. The Paired Samples T-Test
Supplementary table S5. ANOVA
Supplementary table S6. The Post Hoc coenobium types of the two strains
Supplementary table S7. The matrix of ranked dissimilarities
Supplementary table S8. Statistical analysis of morphological parameters
Supplementary figure S1. ML_2D_phylogenetic_tree
Supplementary figure S2. ASAP_tree
Supplementary figure S3. PTP_tree
Supplementary figure S4. GMYC_tree
Supplementary figure S5. ITS2 secondary
Supplementary Figure S6_SSU 18S_phylogenetic_tree
Supplementary dataset S1. CBC_matrix
Additional information
Funding
References
- An, S.S., Friedl, T. & Hegewald, T.E. (1998). Phylogenetic relationships of Scenedesmus and Scenedesmus-like coccoid green algae as inferred from ITS-2 rDNA sequence comparisons. Plant Biology, 1: 418–428.
- Ankenbrand, M.J., Keller, A., Wolf, M., Schultz, J. & Förster, F. (2015). ITS2 database V: twice as much. Molecular Biology and Evolution, 32: 3030–3032.
- Benson, D.A., Cavanaugh, M., Clark, K., Karsch-Mizrachi, I., Lipman, D.J., Ostell, J. & Sayers, E.W. (2013). GenBank. Nucleic Acids Research, 41: D36–D42.
- Bisalputra, T. & Weier, T.E. (1963). The cell wall of Scenedesmus quadricauda. American Journal of Botany, 50: 1011–1019.
- Bisalputra, T., Weier, T.E., Risley, E.B. & Engelbrecht, A.H.P. (1964). The pectic layer of the cell wall of Scenedesmus quadricauda. American Journal of Botany, 51: 548–551.
- Bischoff, H.W. & Bold, H.C. (1963). Phycological studies IV. Some soil algae from enchanted rock and related algal species. University of Texas, Austin.
- Bold, H.C. (1949). The morphology of Chlamydomonas chlamydogama sp. nov. Bulletin of the Torrey Botanical Club, 76: 101–108.
- Bouckaert, R., Vaughan, T.G., Barido-Sottani, J., Duchêne, S., Fourment, M., Gavryushkina, A., Heled, J., Jones, G., Kühnert, D., De Maio, N., Matschiner, M., Mendes, F.K., Müller, N.F., Ogilvie, H.A., du Plessis, L., Popinga, A., Rambaut, A., Rasmussen, D., Siveroni, I., Suchard, M.A., Wu, C.H., Xie, D., Zhang, C., Stadler, T. & Drummond, A.J. (2019). BEAST 2.5: an advanced software platform for Bayesian evolutionary analysis. PLOS ONE, 15: e1006650.
- Caisová, L., Marin, B. & Melkonian, M. (2011). A close-up view on ITS2 evolution and speciation - a case study in the Ulvophyceae (Chlorophyta, Viridiplantae). BMC Evolutionary Biology, 11: 262.
- Caisová, L., Marin, B. & Melkonian, M. (2013). Consensus secondary structure of ITS2 in the Chlorophyta identified by phylogenetic reconstruction. Protist, 164: 482–496.
- Cărăuş, I. (2017). Algae of Romania. A distributional checklist of actual algae. Version 2.4. Studii și Cercetări– biologie. Universitatea Bacau, 7: 1–1002.
- Chang, Y.K. & An, S.S. (1989). A taxonomic study of the genus Desmodesmus in Korea. The Korean Journal In Phycology, 4: 79–85.
- Clarke, K.R. (1993). Non-parametric multivariate analyses of changes in community structure. Australian Journal of Ecology, 18: 117–143.
- Coleman, A.W. (2000). The significance of a coincidence between evolutionary landmarks found in mating affinity and a DNA sequence. Protist, 151: 1–9.
- Coleman, A.W. (2009). Is there a molecular key to the level of “biological species” in eukaryotes? A DNA guide. Molecular Phylogenetics & Evolution, 50: 197–203.
- Demura, M., Noma, S. & Hayashi, N. (2021). Species and fatty acid diversity of Desmodesmus (Chlorophyta) in a local Japanese area and identification of new docosahexaenoic acid-producing species. Biomass, 1: 105–118.
- Dragoș, N., Chiriac, C., Porav, S., Szőke-Nagy, T., Coman, C., Tӧrӧk, L. & Hegedűs, A. (2019). Desmodesmus tropicus (Chlorophyta) in the Danube Delta – reassessing the phylogeny of the series Maximi. European Journal of Phycology, 54: 300–314.
- Dragoș, N., Péterfi, L.Ș., Momeu, L. & Popescu, C. (1997). An introduction to the algae and the culture collection of algae at the institute of biological research cluj-napoca. 1st ed. Cluj University Press, Cluj-Napoca.
- Drummond, A.J. & Rambaut, A. (2007). BEAST: bayesian evolutionary analysis by sampling trees. BMC Evolutionary Biology, 7: 214.
- Ezard, T., Fujisawa, T. & Barraclough, T.G. (2009). SPLITS: species’ limits by threshold statistics. R package version 1.0-18/r45.
- Fawley, M.W., Fawley, K.P. & Hegewald, E. (2011). Taxonomy of Desmodesmus serratus (chlorophyceae, chlorophyta) and related taxa on the basis of morphological and DNA sequence data. Phycologia, 50: 23–56.
- Fujisawa, T. & Barraclough, T.G. (2013). Delimiting species using single-locus data and the generalized mixed yule coalescent approach: a revised method and evaluation on simulated data sets. Systematic Biology, 62: 707–724.
- Hammer, Ø., Harper, D.A.T. & Ryan, P.D. (2001). PAST: paleontological statistics software package for education and data analysis. Palaeontologia Electronica, 4: 1–9.
- Heeg, J.S. & Wolf, M. (2015). ITS2 and 18S rDNA sequence-structure phylogeny of Chlorella and allies (Chlorophyta, Trebouxiophyceae, Chlorellaceae). Plant Gene, 4: 20–28.
- Hegedűs, A., Mocan, A., Barbu-Tudoran, L., Coman, C., Drugă, B., Sicora, C. & Dragos, N. (2015). Morphological, biochemical, and phylogenetic assessments of eight Botryococcus terribilis strains collected from freshwaters of Transylvania. Journal of Applied Phycology, 27: 865–878.
- Hegewald, E. (1978). Eine neue unterteilung der gattung Scenedesmus Meyen. Nova Hedwigia, 30: 343–376.
- Hegewald, E. (1997). Taxonomy and phylogeny of Scenedesmus. Algae, 12: 235–246
- Hegewald, E. (2000). New combinations in the genus Desmodesmus (Chlorophyceae, Scenedesmaceae). Algological Studies, 96: 1–18.
- Hegewald, E., Bock, C. & Krienitz, L. (2013). A phylogenetic study on Scenedesmaceae with the description of a new species of Pectinodesmus and the new genera Verrucodesmus and Chodatodesmus (Chlorophyta, Chlorophyceae). Fottea, Olomouc, 13: 149–164.
- Hegewald, E. & Braband, A. (2017). A taxonomic revision of Desmodesmus serie Desmodesmus (Sphaeropleales, Scenedesmaceae). Fottea, Olomouc, 17: 191–208.
- Hegewald, E. & Schnepf, E. (1979). Geschichte und stand der sistematik der grünalgengattung Scenedesmus. Schweizerische Zeitschrift Fur Hydrobiologie, 40: 320–343.
- Hegewald, E. & Wolf, M. (2003). Phylogenetic relationships of Scenedesmus and Acutodesmus (Chlorophyta, Chlorophyceae) as inferred from 18S rDNA and ITS-2 sequence comparisons. Plant Systematics and Evolution, 241: 185–191.
- Hegewald, E., Wolf, M., Keller, A., Friedl, T. & Krienitz, L. (2010). ITS2 sequence-structure phylogeny in the Scenedesmaceae with special reference to Coelastrum (Chlorophyta, Chlorophyceae), including the new genera Comasiella and Pectinodesmus. Phycologia, 49: 325–335.
- Hoang, T.H., Chernomor, O., von Haeseler, A., Minh, B.Q. & Vinh, L.S. (2018). UFBoot2: improving the ultrafast bootstrap approximation. Molecular Biology Evolution, 35: 518–522.
- Hortobágyi, T. (1969). Phytoplankton organisms from three reservoirs on the Jamuna River, India. Studia Biologica Hungarica, 8: 1–80.
- Hortobágyi, T. (1971). Neue Scenedesmus mit säulenartig verbreiterter Stachelbasis. Studia Biologica Hungarica, 17: 83–89.
- Hortobágyi, T. (1980). New Scenedesmus taxa from the Budapest section of the Danube. Studia Biologica Hungarica, 26: 317–337.
- Jeon, S.L. & Hegewald, E. (2006). A revision of the species Desmodesmus perforatus and D. tropicus (Scenedesmaceae, Chlorophyceae, Chlorophyta). Phycologia, 45: 567–584.
- John, D.M. & Maggs, C.A. (1997). Species problems in eukaryotic algae: a modern perspective. In Species: the units of biodiversity (Claridge, M.F., Dawah, H.A. & Wilson, M.R., eds.), 83–107. London.
- Joseph, N., Krauskopf, E., Vera, M.I. & Michot, B. (1999). Ribosomal internal transcribed spacer 2 (ITS2) exhibits a common core of secondary structure in vertebrates and yeast. Nucleic Acids Research, 27: 4533–4540.
- Kalyaanamoorthy, S., Minh, B., Wong, T., von Haeseler, A. & Jermiin, L.S. (2017). ModelFinder: fast model selection for accurate phylogenetic estimates. Nature Methods, 14: 587–589.
- Kaufnerová, V. & Eliáš, M. (2013). The demise of the genus Scotiellopsis Vinatzer (Chlorophyta). Nova Hedwigia, 97: 415–428.
- Keller, A., Förster, F., Müller, T., Dandekar, T., Schultz, J. & Wolf, M. (2010). Including RNA secondary structures improves accuracy and robustness in reconstruction of phylogenetic trees. Biology Direct, 5: 4.
- Keller, A., Schleicher, T., Schultz, J., Müller, T., Dandekar, T. & Wolf, M. (2009). 5.8S-28S rRNA interaction and HMM-based annotation. Gene, 430: 50–57.
- Kessler, E., Schafer, M., Hummer, C., Kloboucek, A. & Huss, V.A.R. (1997). Physiological, biochemical, and molecular characters for the taxonomy of the subgenera of Scenedesmus Chlorococcales, Chlorophyta). Botanica Acta, 110: 244–250.
- Kimura, M. (1980). A simple method for estimating evolutionary rate of base substitutions through comparative studies of nucleotide sequences. Journal of Molecular Evolution, 16: 111–120.
- Koetschan, C., Hackl, T., Müller, T., Wolf, M., Förster, F. & Schultz, J. (2012). ITS2 database IV: interactive taxon sampling for internal transcribed spacer 2 based phylogenies. Molecular Phylogenetics & Evolution, 63: 585–588.
- Komárek, J. & Ludvík, J. (1971). Die Zellwandultrastruktur als taxonomisches Merkmal in der Gattung Scenedesmus. 1. Die Ultrastrukturelemente. Algological Studies, 5: 301–333.
- Komárek, J. & Ludvík, J. (1972). Die Zellwandultrastruktur als taxonomisches Merkmal in der Gattung Scenedesmus. 2. Taxonomische auswertung der untersuchten Arten. Algological Studies, 6: 11–47.
- Krivina, E.S., Temraleeva, A.D. & Bukin, Y. (2022). Species delimitation and microalgal cryptic diversity analysis of the genus Micractinium (Chlorophyta). Vavilov Journal of Genetics and Breeding, 26: 74–85.
- Kumar, S., Stecher, G., Li, M., Knyaz, C. & Tamura, K. (2018). MEGA X: molecular evolutionary genetics analysis across computing platforms. Molecular Biology and Evolution, 35: 1547–1549.
- Lang, A.S., Bocksberger, G. & Stech, M. (2015). Phylogeny and species delimitations in European Dicranum (Dicranaceae, Bryophyta) inferred from nuclear and plastid DNA. Molecular Phylogenetics & Evolution, 92: 217–225.
- Larkin, M.A., Blackshields, G., Brown, N.P., Chenna, R., McGettigan, P.A., McWilliam, H., Valentin, F., Wallace, I.M., Wilm, A., Lopez, R., Thompson, J.D., Gibson, T.J. & Higgins, D.G. (2007). Clustal W and Clustal X version 2.0. Bioinformatics, 23: 2947–2948.
- Leliaert, F. & De Clerck, O. (2017). Refining species boundaries in algae. Journal of Phycology, 53: 12–16.
- Leliaert, F., Verbruggen, H., Vanormelingen, P., Steen, F., López-Bautista, J.M., Zuccarello, G.C. & De Clerck, O. (2014). DNA based species delimitation in algae. European Journal of Phycology, 49: 179–196.
- Lewis, L.A. (1997). Diversity and phylogenetic placement of Bracteacoccus Tereg (Chlorophyceae, Chlorophyta) based on 18S ribosomal RNA gene sequence data. Journal of Phycology, 33: 279–285.
- Luo, A., Ling, C., Ho, S.Y.W. & Zhu, C.-D. (2018). Comparison of methods for molecular species delimitation across a range of speciation scenarios. Systematic Biology, 67: 830–846.
- Luo, A., Qiao, H., Zhang, Y., Shi, W., Ho, S.Y.W., Xu, W., Zhang, A. & Zhu, C. (2010). Performance of criteria for selecting evolutionary models in phylogenetics: a comprehensive study based on simulated datasets. BMC Ecology and Evolution, 10: 242.
- Lürling, M. (2003). Phenotypic plasticity in the green algae Desmodesmus and Scenedesmus with special reference to the induction of defensive morphology. Annales De Limnologie-International Journal of Limnology, 39: 85–101.
- Mai, J.C. & Coleman, A.W. (1997). The internal transcribed spacer 2 exhibits a common secondary structure in green algae and flowering plants. Journal of Molecular Evolution, 44: 258–271.
- Mai, X.C., Shen, C.R., Liu, C.L., Trinh, D.M. & Nguyen, M.L. (2023). “DNA signaturing” database construction for Tetradesmus species identification and phylogenetic relationships of Scenedesmus‐like green microalgae (Scenedesmaceae, Chlorophyta). Journal of Phycology, 59: 775–784.
- Markert, S.M., Müller, T., Koetschan, C., Friedl, T. & Wolf, M. (2012). ‘Y’ Scenedesmus (Chlorophyta, Chlorophyceae): the internal transcribed spacer 2 rRNA secondary structure revisited. Plant Biology, 14: 987–996.
- Massalski, A., Trainor, F.R. & Shubert, E. (1974). Wall ultrastructure of Scenedesmus culture N 46. Archives of Microbiology, 96: 145–153.
- Mathews, D.H., Sabina, J., Zuker, M. & Turner, D.H. (1999). Expanded sequence dependence of thermodynamic parameters provides improved prediction of RNA Secondary Structure. Journal of Molecular Biology, 288: 911–940.
- Meier, R., Zhang, G. & Ali, F. (2008). The use of mean instead of smallest interspecific distances exaggerates the size of the “barcoding gap” and leads to misidentification. Systematic Biology, 57: 809–813.
- Merget, B., Koetschan, C., Hackl, F., Dandekar, F., Müller, T., Schultz J, T. & Wolf, M. (2012). The ITS2 database. Journal of Visualized Experiments, 61: e3806.
- Milstein, D. & Saunders, G. (2012). DNA barcoding of Canadian Ahnfeltiales (Rhodophyta) reveals a new species – Ahnfeltia borealis sp. nov. Phycologia, 51: 247–259.
- Müller, T., Philippi, N., Dandekar, T., Schultz, J. & Wolf, M. (2007). Distinguishing species. RNA, 13: 1469–1472.
- Mutanen, M., Kekkonen, M., Prosser, S.W., Hebert, P.D. & Kaila, L. (2015). One species in eight: DNA barcodes from type specimens resolve a taxonomic quagmire. Molecular Ecology Resources, 15: 967–984.
- Nguyen, M.L., Mai, X.C., Chu, N.H., Trinh, D.M., Liu, C.-L. & Shen, C.-R. (2023). DNA signaturing derived from the internal transcribed spacer 2 (ITS2): a novel tool for identifying Desmodesmus species (Scenedesmaceae, Chlorophyta). Fottea, 23: 1–7.
- Pankow, H. (1986). Taxonomische und nomenklatorische Änderungen in der Gattung Scenedesmus Meyen 1829. Archiv Für Protistenkunde, 132: 137–166.
- Paradis, E. & Schliep, K. (2019). Ape 5.0: an environment for modern phylogenetics and evolutionary analyses in R. Bioinformatics, 35: 526–528.
- Pickett‐Heaps, J.D. & Staehelin, L.A. (1975b). The ultrastructure of Scenedesmus (Chlorophyceae). II. cell division and colony formation 1. Journal of Phycology, 11: 186–202.
- Pons, J., Barraclough, A., Duran, T.G., Gomez-Zurita, J., Cardoso, D.P., Hazell, S., Kamoun, S., Sumlin, W.D. & Vogler, A.P. (2006). Sequence-based species delimitation for the DNA taxonomy of undescribed insects. Systematic Biology, 55: 595–609.
- Puillandre, N., Brouillet, S. & Achaz, G. (2021). ASAP: assemble species by automatic partitioning. Molecular Ecology Resources, 21: 609–620.
- Puillandre, N., Lambert, A., Brouillet, S. & Achaz, G. (2012). ABGD, Automatic barcode gap discovery for primary species delimitation. Molecular Ecology, 21: 1864–1877.
- Sawayama, S., Inoue, S. & Yokoyama, S. (1995). Phylogenetic position of Botryococcus braunii (Chlorophyceae) based on small subunit ribosomal RNA sequence data. Journal of Phycology, 31: 419–420.
- Schliep, K.P. (2011). Phangorn: phylogenetic analysis in R. Bioinformatics, 27: 592–593.
- Schultz, J., Maisel, S., Gerlach, D., Müller, T. & Wolf, M. (2005). A common core of secondary structure of the internal transcribed spacer 2 (ITS2) throughout the Eukaryota. RNA, 11: 361–364.
- Schultz, J. & Wolf, M. (2009). ITS2 sequence-structure analysis in phylogenetics: a how-to manual for molecular systematics. Molecular Phylogenetics & Evolution, 52: 520–523.
- Sciuto, K., Lewis, L.A., Verleyen, E., Moro, I. & La Rocca, N. (2015). Chodatodesmus australis sp. nov. (Scenedesmaceae, Chlorophyta) from Antarctica, with the emended description of the genus Chodatodesmus, and circumscription of Flechtneria rotunda gen. et sp. nov. Journal of Phycology, 51: 1172–1188.
- Sciuto, K., Wolf, M.A., Mistri, M. & Moro, I. (2023). Appraisal of the genus Pleurastrum (Chlorophyta) based on molecular and climate data. Diversity, 15: 650.
- Seibel, P.N., Müller, T., Dandekar, T., Schultz, J. & Wolf, M. (2006). 4SALE - A tool for synchronous RNA sequence and secondary structure alignment and editing. BMC Bioinformatics, 7: 498.
- Seibel, P.N., Müller, T., Dandekar, T. & Wolf, M. (2008). Synchronous visual analysis and editing of RNA sequence and secondary structure alignments using 4SALE. BMC Research Notes, 1: 91.
- Selig, C., Wolf, M., Müller, T., Dandekar, T. & Schultz, J. (2008). The ITS2 Database II: homology modelling RNA structure for molecular systematics. Nucleic Acids Research, 36: D377–D380.
- Škaloud, P. & Rindi, F. (2013). Ecological differentiation of cryptic species within an asexual protist morphospecies: a case study of filamentous green alga Klebsormidium (Streptophyta). Journal of Eukaryotic Microbiology, 60: 350–362.
- Staehelin, L.A. & Pickett-Heaps, J.D. (1975a). The ultrastructure of Scenedesmus (Chlorophyceae). I. Species with the “reticulate” or “warty” type of ornamental layer. Journal of Phycology, 11: 163–185.
- Struck, T.H. & Cerca, J. (2019). Cryptic species and their evolutionary significance. In Els. John Wiley & Sons, Ltd, Chichester.
- Struck, T.H., Feder, J.L., Bendiksby, M., Birkeland, S., Cerca, J., Gusarov, V.I., Kistenich, S., Larsson, K.H., Liow, L.H., Nowak, M.D., Stedje, B., Bachmann, L. & Dimitrov, D. (2018). Finding evolutionary processes hidden in cryptic species. Trends In Ecology and Evolution, 33: 153–163.
- Talavera, G., Dincă, V. & Vila, R. (2013). Factors affecting species delimitations with the GMYC model: insights from a butterfly survey. Methods In Ecology and Evolution, 4: 1101–1110.
- Trainor, F.R. & Burg, C.A. (1965). Detection of bristles in Scenedesmus species. Journal of Phycology, 1: 139–144.
- Trifinopoulos, J., Nguyen, L.T., von Haeseler, A. & Minh, B.Q. (2016). W-IQ-TREE: a fast, online phylogenetic tool for maximum likelihood analysis. Nucleic Acid Research, 44: W232–W235.
- Tsarenko, P., Hegewald, E. & Braband, A. (2005). Scenedesmus-like algae of Ukraine. 1. Diversity of taxa from water bodies in Volyn Polissia. Algological Studies, 118: 1–45.
- Tsarenko, P., Hegewald, E. & Krienitz, L. (1996). LM and SEM studies on Scenedesmus of lake Tollense (Baltic Lake district, Germany). Algological Studies, 82: 13–36.
- Uherkovich, G. (1966). Die Scenedesmus-Arten Ungarns. Akadémiai Kiadó, Budapest.
- Van Hannen, E.J., Fink, P. & Lürling, M. (2002). A revised secondary structure model for the internal transcribed spacer 2 of the green algae Scenedesmus and Desmodesmus and its implication for the phylogeny of these algae. European Journal of Phycology, 37: 203–208.
- Vanormelingen, P., Hegewald, E., Braband, A., Kitschke, M., Friedl, T., Sabbe, K. & Vyverman, W. (2007). The systematics of a small spineless Desmodesmus species, D. costato-granulatus (Sphaeropleales, Chlorophyceae), based on ITS2 rDNA sequence analyses and cell wall morphology. Journal of Phycology, 43: 378–396.
- Wolf, M., Achtziger, M., Schultz, J., Dandekar, T. & Müller, T. (2005). Homology modelling revealed more than 20,000 rRNA internal transcribed spacer 2 (ITS2) secondary structures. RNA, 11: 1616–1623.
- Wolf, M., Koetschan, C. & Müller, T. (2014). ITS2, 18S, 16S or any other RNA-simply aligning sequences and their individual secondary structures simultaneously by an automatic approach. Gene, 546: 145–149.
- Zhang, J., Kapli, P.P. & Stamatakis, A. (2013). A general species delimitation method with applications to phylogenetic placements. Bioinformatics, 29: 2869–2876.
- Zou, S., Fei, C., Wang, C., Gao, Z., Bao, Y., He, M. & Wang, C. (2016). How DNA barcoding can be more effective in microalgae identification: a case of cryptic diversity revelation in Scenedesmus (Chlorophyceae). Scientific Reports, 6: 36822.