
Abstract
Aim
To systematically develop and test stimuli for inclusion within the revised Alcohol Expectancy Task (rAET)-a pictographic assessment of alcohol-related beliefs.Using a UK adult sample of regular social drinkers, this paper documents the (1) selection (2)development and (3)testing of stimuli, along with (4)initial validation of the rAET.
Method
A hierarchy of common alcoholic beverages was established, along with a consensus regarding beverage presentation format.A professional artist iteratively developed pictographs of characters exhibiting different emotions in everyday scenarios and specialised photography of beverages was undertaken. Accurate identification/recognition of these stimuli was then established using a response box, whereby participants indicated which word (from eight) matched the onscreen images presented.Finally, developed stimuli were included within the rAET.
Results
Informing stimuli development and selection, wine, beer and vodka were the most common alcoholic beverages that participants reported consuming, with a preference for photographic representations.Inverse efficiency scores (based on accuracy and reaction time) suggested some variability in the recognition of certain beverage types and emotional stimuli, highlighting which stimuli may be best for inclusion in the rAET. Confirmatory factorial analyses of rAET responses suggests it has good construct validity.
Conclusion
Maximising the transparency of stimuli selection, development and assessment provides a solid basis for systematic and valid scenario-based assessments of alcohol-related beliefs.
Introduction
Background
Self-report questionnaires are generally considered to be a reliable and valid method of assessing substance use related behaviours and cognitions (Del Boca & Noll, Citation2000; Glovannucci et al., Citation1991; Greenfield & Kerr, Citation2008). Despite their widespread implementation and advantages (e.g. Brace, Citation2018) there are several concerns surrounding their use, including the potential for demand characteristics (see for example, Davies & Best, Citation1996), question comprehension (Schwarz, Citation1999), and intoxication (Walker & Hunter,Citation1978; Weissenborn & Duka, Citation2003) to affect responses. Researchers have also highlighted that self-report questionnaires are frequently distributed in contexts that are far removed from the contexts in which alcohol-consumption typically occurs (Monk & Heim, Citation2013b, Citation2013c), meaning that there is a lack of contextual cues to aid recall (see Godden & Baddeley, Citation1975 classic work). Researchers have therefore begun to develop other methods for collecting data which do not rely on self-report to the same degree. To date, however, the process of developing such alternative measures has not always been documented fully, especially with regards to early phases of tool development. This is important because, while advantageous in their performance, such alternative measures are more complex in their development than questionnaire-based measures. To share practice, promote cross-fertilisation between developers and researchers, and encourage confidence in their use, the current paper details the development and initial validation of a non-self-report measure of the beliefs that people hold about alcohol and its effects.
Moving beyond self-reported alcohol-related beliefs
While traditionally treated as relatively static, there is a growing body of research which points to both within and between participant variability in alcohol-related beliefs that are assessed by self-report. Specifically, that cognitions such as drinking motives and alcohol-related outcome expectancies (beliefs about the likely consequences/outcomes of consumption) appear to vary depending on social and environmental influences at the time of assessment (e.g. Arterberry et al., Citation2013; Monk & Heim, Citation2013a, Citation2013b, Citation2014; Monk et al., Citation2015; Thrul et al., Citation2016). Indeed, these findings accord with theoretical accounts that suggest that these beliefs are activated in memory to guide behaviour dependent on one’s context (Goldman & Darkes, Citation2004). In this way, the way a person thinks about alcohol can change depending on where they are with whom they are drinking. Likewise, there may be between group contextual differences. For instance, a male amongst a group of other males may have different beliefs from those of another male who is drinking with women. Such contextual differences, while potentially subtle, are nevertheless important are they may manifest in varying drinking behaviours.
This awareness of the contextually varying nature of alcohol-related belief has advanced the discipline’s understanding of alcohol consumption and the complex contextual milieu in which is takes place (Monk & Heim, Citation2021). However, the self-report questionnaires upon which this research has been based have also been questioned for a number of reasons. First, they are ultimately dependent on respondents’ ability to reliably and accurately self-reflect on their thoughts and behaviour. They also require participants to recall motives and beliefs from past drinking events and such retrospective recall may be influenced by perceived demands of the researchers (Davies & Best, Citation1996; Schwarz, Citation1999). Alcohol consumption may also impair memory on which responders must rely when answering questions (Walker & Hunter, Citation1978; Weissenborn & Duka, Citation2003). Furthermore, it has been noted that self-report assessments of alcohol expectancies can be time-consuming, and that the language used can be prohibitive to those with lower or as-yet undeveloped literacy skills (Kuntsche & Kuntsche, Citation2017). Finally, they typically provide participants with a predefined association (e.g. ‘drinking = happiness’) which participants are invited to (dis)agree with (Gmel et al., Citation2010; Kuntsche & Kuntsche, Citation2017). This means that it is possible that participants’ responses are an artefact of the questioning process rather than a reflection of beliefs or states. As such, researchers have begun to point towards the need for research tools which can assess alcohol-related beliefs that are not reliant on language comprehension, and can assess cognitions without leading participants by supplying narrowly confined response options (Kuntsche & Kuntsche, Citation2017).
This is not to say that the development of self-report questionnaires has been without rationale. Indeed, to the contrary, papers from Goldman and Darkes (Citation2004) and Morean et al. (Citation2012) outline their advanced explorations of expectancy assessments. For example, Goldman and Darkes (Citation2004) take a multiaxial approach to assessment, based on memory networks. Nevertheless, despite taking great strides to overcome issues surrounding the exploration of alcohol-related beliefs, such approaches do not avoid our aforementioned concerns surrounding the reliance on language comprehension and the presentation of forced associations. Indeed, these studies involve the assessment of participant responses to the statements such as ‘alcohol makes me…’ paired with 132 different expectancy words (e.g. happy), to which participants were asked to respond to on a 7 point likert scale. Similarly, the Anticipated Effects of Alcohol Scale (Morean et al., Citation2012), is derived based on participant ratings of the alcohol-relatedness of a series of valence (e.g. happy) and arousal (e.g.) words on a 10-point rating scale (from no relation to drinking alcohol” to “certain relation to drinking alcohol). As such, while the expectancy models have contributed substantially to our understanding of alcohol-related beliefs, the assessment tools upon which these models are based support may still warrant further development.
Developing on such criticism of self-report measures, a number of implicit tasks have been developed, including the Implicit Association Test (IAT) for the indirect assessment of beliefs/attitudes, including those relating to alcohol (e.g. Wiers et al., Citation2002) and Alcohol Approach Avoidance Task (e.g. Wiers et al., Citation2011). The IAT, for instance, is a categorization task whereby, rather than answering questions about alcohol-related beliefs, participants are required to follow instructions and sort stimuli based on attributes (e.g. positive or negative), and targets (e.g. alcoholic or non-alcoholic beverages), with changes in response times indicating participants’ underlying beliefs. While the IAT has faced mounting scrutiny (see Greenwald et al., Citation2020 for full review), with some research questioning its underlying assumptions (see Yamaguchi & Beattie, Citation2020), such implicit assessments have been developed to include pictorial and contextual information, with such stimuli able to better mimic real-life drinking episodes (Monk et al., Citation2016; Nees et al., Citation2011) and take into consideration research which suggest that context can also impact alcohol-related beliefs (e.g. Monk & Heim, Citation2013b, Citation2013c, Citation2014). Utilising an implicit relational assessment procedure, Monk et al., (Citation2016) found that participants more readily endorsed positive alcohol-related expectancies when items were presented alongside alcohol-congruent stimuli (e.g. a picture of a beer bottle in a bar environment). These implicit measures also remain dependent on providing set associations, which participants are required to consider and respond (depending on pre-test instructions). Furthermore, this research provides a set association between alcohol and context by default (Kuntsche & Kuntsche, Citation2017; e.g. a beer bottle embedded in the picture of the environment), while no neutral condition was presented (e.g. a soft drink in the same context). Finally, this approach also incorporates questionnaire‐based expectancy items, which remain susceptible to the aforementioned limitations of more traditional self-report approaches (see Kuntsche & Kuntsche, Citation2017 for full critique). In short, despite attempts to advance beyond self-report questionnaires, there remains a need to assess alcohol-related beliefs without a reliance on language and avoiding forced choice associations which may oblige participants to a response pattern that does not fully reflect their underlying beliefs.
Consequently, researchers have begun to develop pictographic assessments of alcohol-related beliefs and cognitions. For example, Pronk et al. (Citation2015) created the Amsterdam Beverage Picture Set (ABPS) to aid the examination of cognitive biases by presenting pictures with and without alcohol, in different contexts (e.g. serving, opening or drinking). Lopez-Caneda and Carbia (Citation2018) also created a resource for researchers by collating and standardising a range of licenced images of alcoholic and non-alcoholic drinks in real-life scenarios. A limitation of this welcome addition to the methodological repertoire of alcohol researchers, however, is that only positive and neutral images were used which may constrain possible response patterns. Similarly, Fey et al., (Citation2016) database of alcoholic beverages and neutral objects (e.g. a wheelbarrow) excludes non-alcoholic drinks, ostensibly due to potential associations with alcohol.
In response, the Alcohol Expectancy Task (AET; Kuntsche & Kuntsche, Citation2017) was designed to assess expectancies about the effects of alcohol in a more ‘neutral’ way, by using different contexts and beverages without presenting respondents with predefined associations between outcomes and alcohol. Specifically, building on the electronic Appropriate Beverage Task (eABT; Kuntsche et al., Citation2016), the AET presents several pictographic representations of everyday scenes in which characters display a variety of emotions, representing each of the emotions outlined in the Circumplex Model of Affect (CMA; Russell, Citation1980; e.g. excited [positive arousal], annoyed [negative arousal], relaxed [positive sedation], sad [negative sedation]). For each scene, the participants’ task is to select the beverage they believe the characters have consumed, selecting from an array of concurrently presented alcoholic and non-alcoholic drinks. This removes any pre-defined association between alcohol consumption and certain outcomes/beliefs (an insurmountable limitation of self-report questionnaires) and means that responses represent participants’ natural beliefs about the situations/emotions associated with alcohol consumption. For example, if alcohol is frequently paired with happy everyday scenes, this indicates that alcohol is associated with happiness –a positive alcohol expectancyFootnote1. This approach also has the advantage that assessments can be carried out without a reliance on written language, which is a prerequisite for traditional questionnaires. Further, it acknowledges the importance of both valance and arousal characteristics when measuring alcohol-related beliefs (Goldman & Darkes, Citation2004; Morean et al., Citation2012).
Such pictographic approaches therefore constitute a significant step forward in the assessment of alcohol-related beliefs. However, the AET does not balance fully the emotions displayed (e.g. sad, joyful etc.) with different kinds of activities shown in the scenarios (e.g. watching TV, playing outdoors etc; Kuntsche & Kuntsche, Citation2017). Furthermore, while the emotions and beverages used in the AET exhibit apparent face validity, there was no systematic assessment of the validity of the stimuli used in the task.
The current paper therefore outlines how we developed and systematically tested pictographic alcohol stimuli for inclusion within the refined Alcohol Expectancy Task (rAET). These stimuli depicted three different settings in which characters display each of the emotions represented in the Circumplex Model of Affect (Russell, Citation1980). To maximise transparency and allow researchers to critically examine the development of the stimuli, and to allow researchers to develop the rAET further or transfer it to different cultures, we outline in this paper the development phases of this project, including how we determined which stimuli to examine and how we produced and piloted these stimuli. We then provide initial data on validation. In so doing, we hope that other researchers seeking to use the rAET, or to adapt the stimuli produced here for their own purposes, can understand in more detail how we tried to ensure that the images utilised were recognisable, valid and reliable.
In the following, we describe d the development of the rAET, dividing the reporting into four sub sections: Phase 1) Stimuli selection; Phase 2)stimuli development; Phase 3) stimuli testing; Phase 4) Initial validation by way of confirmatory factor analysis. This research project was approved by the lead author’s institutional ethics committee and was carried out in accordance with APA ethical standards and the Declaration of Helsinki in the treatment of participants.
Phase 1 – stimuli selection
In this phase, we describe the how we determined our starting position. Specifically, which beverages should be assessed and how these should be visually presented for exploration. This involved producing a hierarchy of the most commonly consumed alcoholic beverages and establishing a consensus regarding beverage presentation format. This was important in order to ensure that pictographic assessments such as the rAET contain beverages that are commonly consumed rather than relying in researcher assumptions, as there can be preference variability even amongst (predominantly western) drinking cultures, in which alcohol consumption is omnipresent (Gordon et al., Citation2012; Room & Mäkelä, Citation2000). To aid recognisability of the beverages and engagement with the task, participants were also asked how they would prefer presentation of the alcoholic beverages (i.e. in a drawn picture/pictogram or in photographic form).
Method
Participants
A convenience sample of 117 UK university students and staff who reported that they were regular social drinkers (Female 88%, Mage 21.84, SD = 5.03) were recruited in response to campus advertisements.
Materials and procedure
Interested participants were provided with a blank form and asked to list what they thought were the four most commonly consumed alcoholic beverage types (avoiding brand names). They were also asked ‘if you had to instantly recognise an alcoholic beverage (i.e. within a fraction of a second), would you prefer a drawn picture/pictogram or a photograph?’).
Results
Vodka (n = 105; 90%), beer (n = 94; 80%) and wine (n = 68; 58%) were the most commonly listed beverages among respondents, followed by gin (n = 66; 56%) and cider (n = 42; 36%). When asked if they would prefer a drawn picture/pictogram or a photograph of an alcoholic beverage, respondents preferred a photograph (n = 117; 100%) over a drawn picture (n = 0). It was therefore decided that the beverage stimuli should be photographic and should include at least beer, vodka and wine as popular and recognisable beverages.
Phase 2 – stimuli development
Having determined which beverages should be included in our assessment, and how best to visually represent them, the next phase was then to produce the materials. This section therefore first describes the development of the emotion pictographs. An artist was hired to produce black-and-white drawings displaying the CMA emotions (Russell, Citation1980). Here, an iterative process of development and alterations was undertaken by the artist, with feedback from the research team, in order to optimise the stimuli prior to validation testing. It then goes on to outline the professional production of the beverage photographs. In order to standardise lighting and appearance, professional photography sessions were undertaken to capture the alcoholic beverages. This was done with the intention of maximising participant engagement and to ameliorate any concerns about variability in attention.
Method
Materials and procedure
We reached out to several professional artists regarding the systematic development of a set of black and white illustrations of individuals engaged in various culturally ubiquitous activities and displaying a range of emotions. Based on previous versions of the task and the aims of the project, researchers discussed and developed a set of 23 illustrations. These displayed seven neutral settings (e.g. family camping) and four everyday scenarios (e.g. a woman watching TV). Each of these settings was replicated four times to represent each of the emotional states from the CMA (Russell, Citation1980: arousal-positive, sedation-positive, sedation-negative, arousal-negative). This culminated in drawings which displayed characters, in everyday scenarios, exhibiting different emotions (e.g. Angry Man watching the TV, Depressed Man watching the TV, Cheerful Man TV and Relaxed Man TV). Researchers then engaged in a collaborative process with the artist involving several iterations of the prospective illustrations, designed to ensure clarity of the emotions. Illustrations were discussed between all researchers until a final set were agreed upon (see Supplementary material doc 1).
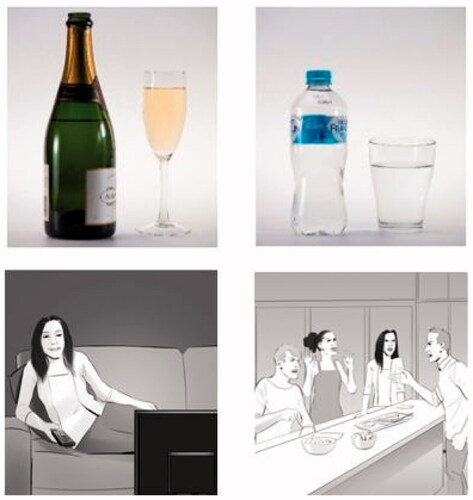
A professional photographer was engaged to take photos of the beverages to be used in the task (beer, champagne, coffee, cordial/squash, cola, juice, energy drinkFootnote2, sports drink, tea, vodka, water, whisky, wine, smoothie). Beverages were photographed in a similar format to previous versions of the task. Specifically, the images displayed beverages in their most common container (e.g. a bottle or tea pot) and accompanied with an appropriate drinking vessel (e.g. a glass or cup). The beverages were displayed against a plain white background and the positioning and orientation of all containers and vessels were displayed consistently (e.g. container on the left, vessel on the right). Frontal beverage labels were obscured to minimise brand identification. See for example (the full set – in grey scale – can be seen in Supplementary material 2).
Figure 1. Top: Example of Beverage Photographs (left: Champagne, right: Water). Bottom: Examples of Emotional Scenario Drawings (left: Female Sedation-Positive, right: Group Arousal-Negative).
Results
15 beverage items were finalised for Phase 3 testing. These consisted of alcoholic (n = 5) and non-alcoholic beverages (n = 10). Furthermore, 16 emotion images were developed for Phase 3 testing. Each greyscale drawing scenario had four variations to represent the four factors of Russell’s (Citation1980) CMA.
Phase 3 - stimuli testing
This section outlines the stimuli testing phase research, where recognition speed and accuracy of both the beverages and the emotional scenarios was tested, in order to inform which would warrant inclusion in the rAET. This was done to ensure that the beverage and emotions depicted were recognisable and thus could be deemed accurate representations. Inverse efficiency scores (a measure combining speed and accuracy, specifically ‘response time/1 – error rate’) were also calculated in order to evidence how efficiently participants processed the stimuli.
Method
Participants
Fifty-three regular social drinkers aged 18–61 years from the North West of England were recruited through opportunity samplingFootnote3. Three cases were excluded due to missing gender values or outlying age. The remaining net sample used for analysis consisted of 50 participants (52% female) aged 18–53 (M = 29.40, SD = 9.99), with a mean AUDIT score of 5.98 (SD = 6.15). 98.1% identified as White and 1.9% as Asian or mixed Asian/White. 50% of the sample were current University students.
Materials
The 31 images (of emotion and beverages) developed in Phase 2 were utilised in this phase (see Supplementary material 1 & 2).
Procedure
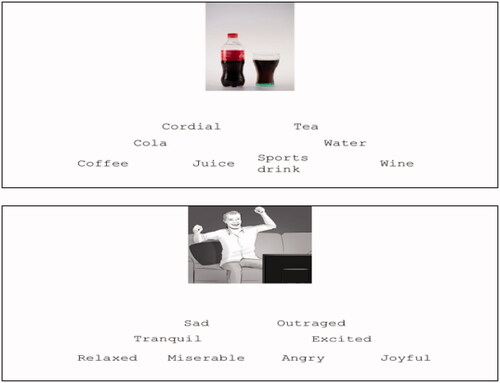
Participants were placed in front of a laptop and a response box, while the researcher explained that the task required participants to indicate which word (from a choice of eight) matched the image that was presented on the screen. Each image was presented on the screen in an 800 × 800 pixel box and remained on-screen until the participants responded (see ). The names of 8 beverages or emotions were shown under the image, with their location corresponding to the location of the buttons on the response box. Participants were asked to select which item was present (the correct answer was always present on the screen).
Participants initially completed three practice blocks, with one block of emotional image trials (n = 8), one block of alcohol beverage image trials (n = 5) and one block of non-alcoholic beverage trials (n = 7). These were followed by the main experiment. This also consisted of three blocks, two of consumable image trials (alcohol and non-alcoholic beverages; n = 16 for each block) and one block of emotional image trials (n = 32). The presentation order of the blocks in both the practice and experimental sections were randomised, as was the order of the image trials within each block. For beverage trials, eight words (2 alcoholic and 6 non-alcoholic beverages) were written beneath each image. For emotion trials, each picture was accompanied with eight emotion adjectives, representing the four emotion categories assumed by the CMA (Russell, Citation1980): Joyful, Excited (arousal-positive); Relaxed, Tranquil (sedation-positive), Sad, Miserable (sedation-negative), Angry, Outraged (arousal-negative). Selection of either of the two adjectives within the target emotion category was taken as a correct response. After this task, participants were asked to complete the AUDIT questionnaire (Saunders et al., Citation1993) and provide demographic information. Finally, participants were debriefed and reimbursed for their time with the task taking approximately 30 min in total.
Analytic strategy
Accuracy scores were defined as one minus the proportion of errors to each image. Responses were coded as correct if the right response to the consumable item was selected. For the affective scenes, pressing one of two affective adjectives was scored as correct (for example, both ‘Angry’ and ‘Outraged’ were correct for an arousal-negative image). Response time was defined as the time between image display and button press in milliseconds. Inverse Efficiency Score (IES) was then calculated from accuracy and response times according to Townsend and Ashby (Citation1983) guidelines. For IES (response time/1 – error rate), higher values indicate greater processing costs/difficulties in responding, with lower values suggesting better performance/less difficulty in responding. By default, there are no overall minimum and maximum values, though the individual minimum value will be the same as that response time value (e.g. lowest possible IES value will be response time when accuracy is 100%). Likewise, the maximum individual value will be, assuming the error rate is a maximum of 99%, 100 times that particular response time value.
As noted previously, it is easy for researchers to make value judgments about the face validity of their stimuli. However, by combining speed and accuracy, efficiency scores allowed us to assess more objectively whether participants could easily and correctly identify the stimuli. We were also able to evaluate whether participant demographics and alcohol consumption habits affected this process.
Following baseline assessments and test of normality assumptions, Efficiency scores were then input into mixed-model analyses of covariance (ANCOVAs). Beverages had two factors (alcohol content and drink type) while emotion stimuli had three factors (type of scenario, arousal [e.g. sedation] and valence [e.g. positive]). Gender, student status and AUDIT score were included as between participant factors and participant age was input as covariate, to control for any age-related differences within the sample. Only significant interactions are reported.
Results
Inverse efficiency scores in response to beverage pictures
Overall, mean IES was significantly lower for non-alcoholic (M = 1963.78, SD = 519.98) than alcoholic drinks (M = 2068.96, SD = 538.67; F (1, 48) = 5.40, p = .02, η2p = .10, and there was an interaction with age: F (1, 48) = 3.91, p = .054, η2p = .08), suggesting less efficient responses to non-alcoholic drinks as age increased, while there was no such relationship for alcoholic drinks. There was also a significant interaction between drink type, gender, student status and AUDIT score (F (1, 41) = 6.01, p = .02, η2p = .13; means displayed in , Supplementary material 3). Simple tests found no significant main effects for non-alcoholic drinksFootnote4.
Repeated measures ANOVA revealed IES was significantly different between each beverage (F (5.73, 120.27) = 1.02=, p < .05, η2p =.05. Mean IES for each drink is displayed in . Examination of pairwise comparisons indicate mean responses to cola were significantly more efficient than to all other beverages (ps < .05). Responses to cordial had the poorest efficiency, and was statistically similar to sports drink (Lucozade), energy drink and champagne (ps > .05). Responses to wine were the most efficient of those in the alcoholic beverage category, and these responses were statistically compatible to vodka, beer and whisky (p < .05). Age had moderate positive relationships with energy drink (rs =.36,p < .05), vodka (rs = .42, p < .01), water (rs = .57, p < .001) and sports drink (Powerade) (rs = .31, p < .05). Mixed ANOVA revealed a significant interaction between responses to each drink, student status and AUDIT F (4.91, 73.66) = 2.75, p = .03, η2p = .16. However, simple tests did not detect any interaction effects between individual beverages.
Table 1. Inverse efficiency responses to 15 alcoholic and non-alcoholic beverages (most to least efficient; left-right).
Inverse efficiency scores in response to emotion stimuli
Overall, responses to positive (M = 2840.08,SD = 842.13) and negative (M = 2737.98,SD = 980.84) valence images were not significantly different F (1, 48) = .69, p = .41, η2p = .01). However, responses to emotionally aroused images were significantly more efficient (M = 2579.14,SD = 660.88) than sedate images (M = 3007.69SD = 1216.48); F (1, 49) = 5.43, p < 05, η2p = .10 (, Supplementary material 3).
Figure 2. Example image from soft drink (top) and alcoholic (bottom) stimuli testing.
Phase 4 – initial validation
Informed by the findings from phases 1–3, the developed images were incorporated within the rAET, to facilitate initial validation testing. A four-factor model, based on the assumptions of the CMA (positive arousal, negative arousal, positive sedation and negative sedation) were expected.
Method
Participants
The rAET was administered online to an age-stratified UK convenience sample (N = 405) of regular social drinkers (female: 50.5%, Mage = 36.7, SD = 13.8; mean AUDIT score = 5.60, SD = 5.15).
Materials
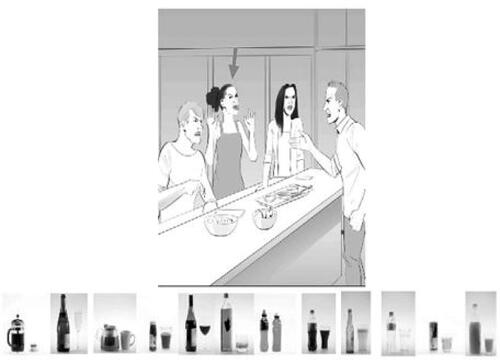
The beverage stimuli and emotional scenes that were developed in phase 2 and tested in phase 3 we incorporated into the rAET for testing. Each of the four investigated expectancy dimensions, namely ‘Positive Arousal’, ‘Negative Arousal’, ‘Positive Sedation’, and ‘Negative Sedation’, were depicted in four illustrated scenarios (a single male watching TV, a single female watching TV, a mixed gendered couple at a restaurant, and a group of friends having a social gathering). Participants were asked to select which type of drink each person in the illustration was most likely to have drunk, with an arrow denoting which person was the focus of the question. Participants chose from 12 beverage pictures (presented below the scenarios) including four alcoholic (beer, champagne, red wine and whisky) and eight non-alcoholic beverages (cola, coffee, energy drink, orange juice, smoothie, sports drink, tea and water) which were presented in random order below the emotional scene (see for example).
Figure 3. Example response option from the rAET task.
Procedure
Respondents were recruited through Qualtrics, an online crowdsourcing platform and survey software company. Participants completed the task online between July and December 2018. The average time for participants to complete the task was just under six minutes (Mean = 5:50, SD = 8:23) and participants received a small reimbursement for their time.
Analytic strategy
Confirmatory factor analysis (CFA) was performed using Mplus to assess the the four-factor structure of the expectancies based on the CMA, with weighted least square mean and variance adjusted estimation (WLSMV) to account for the dichotomous nature of items (providing a person in a given scenario with an alcoholic beverage or not). In the scenarios showing four adults, the errors between the first male and female (first two persons) were allowed to correlate to compensate for answer tendencies. Comparative fit index (CFI) and Tucker-Lewis index (TLI) were used to assess model fit, with values higher than .95 soughtFootnote5. Internal consistency of the four dimensions was assessed with the Kuder-Richardson coefficientFootnote6. Comparisons of nested CFA models were used to ascertain whether the data fit of any 2-factor model (i.e. arousal vs. sedation, positive vs. negative) was significantly worse than that of the four-factor model. Comparisons of model fit were conducted using the Mplus Difftest option for WLSMV estimation, where a scaling correction is used to approximate the chi-square distribution (Muthén & Muthén, Citation2015).
Results
The four-factor model assumed by the CMA provided CFI and TLI values of close to .95, and RMSEA of .05. Additionally, we found weak model fits for the two 2-factor models (positive versus negative and arousal versus sedation) which were significantly worse than the four-factor model (see ).
Table 2. Results of the confirmatory factor analysis.
All items (assigning an alcoholic beverage to the individuals in the scenarios or not) loaded highly and significantly on the factor to which they conceptually belong (see ). With two exceptions (Person 1 and 2 in Scenario 15), all factor loadings for the two negative factors were above 0.5. For the two positive factors, most factor loadings were above 0.6 (three exceptions – see table). All internal consistency values were .77 or higher.
Table 3. Standardized Factor Loadings (CFA Four-factor model) and Interfactor Correlations Obtained by the CFA.
General discussion
The aim of this research was to document a systematic approach to developing stimuli suitable for inclusion in pictogram-based assessments of alcohol expectancies. Since the beverages are intended to be matched with scenes displaying different emotions in a revision of the Alcohol Expectancy Task (Kuntsche & Kuntsche, Citation2017), it is important that the selected drinks are not only recognisable in a passive image (Pronk et al., Citation2015; Monk & Heim, Citation2014) but are applicable to the affective contexts presented. Likewise, the scenarios must clearly represent each factor of the CMA (Russell, Citation1980). This research therefore lays important foundations for the future use of the rAET in the assessment of alcohol-related beliefs. In so doing, this research aims to supply a valid tool that is capable of assessing alcohol-related cognition without a reliance on language (mis) comprehension or forced choices to predefined associations (e.g. drinking = happiness), whereby participants’ responses may be an artefact of questioning.
Phase 1 and 2
Participants indicated that beer, wine and vodka were the most popular alcoholic beverages and that photographs were the preferred medium of presentation. Professional photographs of alcoholic and non-alcoholic beverages were produced in order to standardise the position of drinking container and vessel, hide banding labels and control lighting. Professionally produced, black and white drawings were developed to display characters in everyday scenarios, exhibiting different emotions. This was done in a systematic way by displaying all the four emotional categories of the CME consistently in three settings with a different degree of social involvement (alone, couple, social gathering).
Phase 3
Beverages
Response efficiency scores demonstrated Nine of the fifteen beverages had statistically similar responses. Cola was responded to significantly more efficiently than the other beverages, which corroborates previous findings that there is a strong behavioural preference for Coca-Cola due to the cultural influence of the brand (McClure et al., Citation2004). This suggests that this beverage would warrant inclusion in tasks requiring quick and accurate beverage recognition, such as in the rAET.
Conversely, the current results suggest that Lucozade (sports drink) and cordial were the weakest candidates for inclusion, at least among the mainly adult participants in our sample. Cordial was mistaken for Juice and vice-versa. Similarly, Lucozade and energy drink were misidentified as each other, which implied these beverages were not distinct enough conceptually. On the other hand, Powerade was efficiently responded to, suggesting it was a more coherent representation of a sports drink than Lucozade. Although the energy drink was responded to more efficiently than Lucozade, the presence of a more recognisable sports drink stimulus may mean that it is justifiable to exclude Lucozade. These findings not only evidence which stimuli may warrant inclusion in future pictographic assessments such as the rAET, but they also highlight the importance of the systematic process outlined in this paper; Had stimuli been produced, based solely on the researchers’ (untested) assumptions, they may have included in future iterations of pictographic assessment such as the rAET. Participant responses to such items could then be interpreted as indicators of differing beliefs, as opposed to inaccurate recognition of the stimuli. By taking a more systematic approach, the current research has therefore developed stimuli for inclusion within pictographic assessments which should yield more reliable assessments of alcohol-related beliefs.
That responses to cordial, Lucozade and energy drinks were equally as inefficient as responses to alcoholic items of whisky and champagne may also warrant consideration for the development of a task such as the rAET. Specifically, efficiency scores for champagne were the poorest of all of the alcoholic items. While identifying the beverage accurately, participants appeared to spend a long time choosing the correct label from the word selection. It is possible the label ‘wine’ may have been ambiguous by not specifying colour; a photograph of red wine was used for this category, so some participants may have taken extra time to consider whether or not the champagne could be labelled as white wine. Researchers considering which stimuli to include in future assessments may therefore be advised to consider this finding carefully and avoid the inclusion of champagne, particularly if reaction time is an important consideration. Nevertheless, the association between champagne and celebration (Charters et al., Citation2011), may mean that champagne is a contextually important beverage to include in assessment such as the rAET, where context and affect are particularly of interest.
Of all the alcoholic beverages we tested, Wine was the most efficiently responded to item. This may suggest that participants could quickly and accurately recognise the item perhaps because wine is a particularly popular alcoholic beverage among the adults included, making it a potentially useful inclusion in visual tasks such as the rAET. While vodka was recognised less efficiently than cola, it was not significantly different from Wine in terms of recognisability. This is despite the fact that vodka is ostensibly conceptually dissimilar from the other beverages that we tested as it is less commonly consumed unmixed outside of ‘drinking-to-get-drunk scenarios’ (Verster et al., Citation2018). This stands in contrast to beer, wine and whisky, which are commonly consumed unmixed in the same form that was photographed. Pictographic measures such as the rAET may therefore wish to consider these alcoholic beverages for inclusion in testing.
Age was significantly positively associated with responses to non-alcoholic drinks, in that older participants reacted less efficiently (so slower/less accurate) to non-alcoholic drinks (while there were no age-related differences for alcoholic beverages). This may be explained by patterns of elevated consumption and brand awareness of calorific soft drinks amongst younger people (Hattersley et al., Citation2009; Tatlow-Golden et al., Citation2014). Responses to each beverage did not differ significantly by gender, student status or AUDIT score. This is important because it means that the beverages are recognisable independent of these characteristics and thus suitable to be included in a task such as the rAET for different subgroups.
Emotional scenarios
Responses differed significantly depending on the degree of activation displayed in the scenes. Participants responded more efficiently to aroused scenes, implying the sedate images were more challenging to identify. Interestingly, responses did not differ by valence, which stands in contrast to previous studies that have found negative words (Kuperman et al., Citation2014) and images (Thigpen et al., Citation2018) are recognised more slowly than positive words. Our findings may be due to the use of short, high frequency words such as ‘Angry’ and stimuli which are negative but not unpleasant/aversive, which tend to garner faster responses (Ihssen & Keil, Citation2013). Regardless, this finding confirms the positive and negative versions of each scenario were clearly depicted and are valid for use in visual tasks such as the rAET.
Since the two emotional scenes with the lowest response efficiency scores shared the same valence and activation (sedation-positive) we decided to delve deeper into participant responses to account for any confounding reasons as to why they were not responded to as efficiently as the other scenarios. The sedate scenes are particularly salient because sedation is related to negative alcohol expectancies (Wiers, Citation2008). While the majority of incorrect responses chose an arousal-positive label, the most common label chosen was ‘Joyful’ rather than ‘Excited’. Posner et al. (Citation2005) conceptualised joy as having strong positive valence but moderate arousal, meaning ‘Joyful’ could be applied to low or high activation of positive affect. Due to the ambiguity of ‘joy’ it is arguable that participants selected a correct label when applying it to both the sedation-positive and arousal-positive scenarios. We would therefore recommend that researchers consider carefully the adjectives they use when representing emotional scenes (or avoid them where possible, to avoid such potential confusion). Neither age, gender, AUDIT score or student status was significantly related to response efficiency for the image scenarios, valence and activations, which again underlines the robustness of the emotional stimuli identification across these subgroups.
Phase 4
The incorporation of the developed stimuli (from phases 1–3) into the rAET suggested that is has adequate construct validity producing a four-factor model, with high internal consistency values for each of the rAET dimensions, and with strong CFI and RMSEA values. This suggests that assignment of alcoholic beverages to the persons in the illustrations could be soundly classified into the four dimensions assumed by the CMA (positive arousal, negative arousal, positive sedation and negative sedation; Russell, Citation1980) and that participants who attributed alcohol to a person displayed in a certain emotional state, consistently attributed alcohol to other persons displaying the same emotion. This suggests that the rAET can be used to assess alcohol expectancies in terms of the emotions that participants believe will occur when people drink alcohol. Future research to validate this rAET in terms of its ability to predict self-reported consumption is recommended.
Future directions
By systematically producing and testing stimuli, before validating the rAET, this paper outlines a transparent approach to stimuli development and testing, laying the foundations for future research in this domain. In so doing, it represents an important first step in research which is otherwise (and too often) predicated on researchers’ assumptions. Implementing the current findings, subsequent applications of the rAET may therefore be reasonably understood to represent participants’ expectations surrounding alcohol consumption, removed from the limitations of traditional self-report measures. Future research may also beneficially assess rAET’s validity as a tool to predict alcohol consumption, opening it up to further use within the methodological repertoires of researchers seeking to examine alcohol-related beliefs.
Limitations
The authors acknowledge that the recruitment of regular social drinkers could be open to a degree of individual-level interpretation by participants and future research may therefore benefit from more acquiring more detailed accounts of their drinking (e.g. timeline follow-back), in addition to AUDIT scores. It should also be noted that the present stimuli have been designed and tested in a western sample which was largely white. So too, the characters depicted in the stimuli are white and the scenes depicted may not be representative of the drinking practices of other populations, for example in Lower Middle Income Countries, where there has been less research into how these cognitions may develop and drive alcohol-behaviours (Zucker et al., Citation2008). There is a wide array of cultural and social factors that influence the manner in which alcohol is consumed, the places in which people drink, and the individuals within whom they interact with during consumption (Sudhinaraset et al., Citation2016). It is therefore possible that the beverages selected and the scenes depicted in the current stimuli would not have equal validity for use within an rAET among a non-western sample. Consequently, the authors would advise that future testing be carried out to assess the cultural appropriateness of the stimuli developed, testing recognition following the approach outlined in phase 3. If this did not yield equivalent responses, stimuli should then be adapted and developed so that they are more representative, using the same systematic approach documented in this paper.
Likewise, we note that the representativeness of the stimuli should be tested using a greater proportion of males, with older populations, and among other western groups (e.g. in the USA), to assess for any variability in responses to the stimuli. Indeed, respondents in the current paper were in their twenties, on average, and largely female (e.g. only 18% of the sample from Phase 1 were men) and although research suggests that there are many similarities in male and female drinking preferences and patterns (e.g. Podstawski et al., Citation2019) discrepancies in perceptions cannot be ruled out. In short, it would be beneficial to assure that the stimuli devised here for use in the rAET are equally applicable across more diverse groups.
As mentioned above, participant responses in phase 3 may have been confounded by the label choices for each emotion circumplex factor. Future replications should choose words directly from the CMA in order to avoid ambiguity or overlap between factors (Barrett, Citation1998). Additionally, the presence of eight words to describe four factors may have provided too many potential responses for participants (Albantakis et al., Citation2012). Examination of participant responses supports this, because most tended to pick one word (typically the neutral label) and stuck with it for each variation of the scenarios. This is especially salient considering there was only one correct label presented for the consumable blocks. Future studies may also endeavour to use a different controller (such as a touch screen or mouse) to collect participant responses. Alternatively, a gap could be programmed between each image, to prevent registering responses from button presses too close in succession.
Finally, the current research built upon existing research where pictographs were designed to reflect emotion (based on the CMA). It should, however, be noted that self-report expectancy questionnaires also assess other facets such as the expectation of social facilitation. The overlap between the expectancy and affect is unsurprising as the expected effect of alcohol on affect is a central aspect of the motivation to use alcohol, emotion is just one component (Goldman & Darkes, Citation2004). Nevertheless, it may be fruitful for future research to explore other facets of alcohol-related beliefs, such as feeling friendly, sociable or more outgoing. Whether any assessment can sufficiently capture the complexity of such beliefs, nor satisfy the myriad of researcher perspective on this issue, is a debate that is beyond the scope of this paper. Yet, we present the current paper as a first step towards the systematic development of pictographic assessment of alcohol-related beliefs while seeking to overcome the problems of traditional, self-report measures. Future research may wish to consider the development and assessment of further scenarios to also reflect other (non-emotion-based) elements of alcohol-related beliefs.
Conclusions
Scenario-based assessment of alcohol-related beliefs are advantageous as they avoid the presentation of predefined associations (e.g. ‘drinking = happiness’) which may mean that that responses are an artefact of the questioning process rather than a true reflection of beliefs or states. The presented results provide a solid basis for a more systematic development of the scenario-based assessment of alcohol expectancies, and suggest that the rAET, using carefully developed stimuli, offers a valid tool to assess the emotions that people expect to result as a result of alcohol consumption. By maximising the transparency of the stimuli selection, development and assessment process, researchers can examine critically the beverage and emotion stimuli that may be incorporated into tasks such as the rAET, and provide assurances that they are recognisable, valid and reliable.
Acknowledgements
This study was approved by the authors’ institutions’ research ethics committees and the research conforms to recognized standards outlined in Declaration of Helsinki, including those governing the provision of informed consent. The authors would like to thank artist, Dylan Shearsby, for their work producing the images used in this research.
Disclosure statement
The authors declare no conflicts of interest nor do they have any sources of pharmaceutical and/or industry support.
Additional information
Funding
Notes
1 In this way, these pictographs are conceptualised as cues to test for associations between the emotions and (non) alcohol beverage consumption, though they have no cognitive value per se.
2 Images of both Lucozade Sport and Powerade were photographed in this category, in order to address concerns about cross cultural recognition of these two brands
3 The beverage pictures were developed by an Australian artist and although the iterative development process between researchers was designed to reduce any cultural biases, we could not entirely rule out this possibility. As such, we selected an independent UK sample in order to test the stimuli and ensure that the accuracy of the representations.
4 Simple tests for alcoholic drinks found significant two-way interactions between gender and student status, gender and AUDIT and student and AUDIT. Examination of mean responses suggest male students (M = 1999.71, SD = 736.25) and female non-students (M = 1953.97, SD = 320.50) responded significantly more efficiently than male non-students (M = 2266.61, SD = 428.02) and female students (M = 2045.14, SD = 591.06); (F(1,42) = 4.87, p < .05, η²p = .10). Similarly, responses were significantly more efficient by male high-AUDIT scorers (M = 1913.43, SD = 263.64) and female low-AUDIT scorers (M = 1900.83, SD = 307.59) than male low-AUDIT scorers (M = 2374.88, SD = 764.94) and female high-AUDIT scorers (M = 2328.65, SD = 753.19); (F(1,42) = 8.25, p < .01, η²p = .16). Finally, high-AUDIT non-students (M = 1914.80, SD = 280.85) and low-AUDIT students (M = 1931.24, SD = 675.16) responded significantly more efficiently than high-AUDIT students (M = 2161.47, SD = 620.76) and low-AUDIT non-students (M = 2208.62, SD = 427.55); (F(1,42) = 6.02, p < .05, η²p = .13).
5 Root-mean-square error of approximation (RMSEA) relate to the residual variance, where values lower than .08 indicate good model fit (Hooper et al., Citation2008)
6 Acceptable thresholds for internal consistency above .7 (Sijtsma, Citation2009).
References
- Albantakis, L., Branzi, F. M., Costa, A., & Deco, G. (2012). A multiple-choice task with changes of mind. PLoS One, 7(8), e43131. https://doi.org/https://doi.org/10.1371/journal.pone.0043131
- Arterberry, B. J., Smith, A. E., Martens, M. P., Cadigan, J. M., & Murphy, J. G. (2013). Protective behavioral strategies, social norms, and alcohol-related outcomes. Addiction Research & Theory, 21, 507–515.
- Barrett, L. F. (1998). Discrete emotions or dimensions? The role of valence focus and arousal focus. Cognition Emotion, 12(4), 579–599. https://doi.org/https://doi.org/10.1080/026999398379574
- Brace, I. (2018). Questionnaire design: How to plan, structure and write survey material for effective market research. Kogan Page Publishers.
- Charters, S., Velikova, N., Ritchie, C., Funtain, J., Thach, L., Dodd, T. H., Fish, N., Herbst, F., & Terblanche, N. (2011). Generation Y and sparkling wines: A cross‐cultural perspective. International Journal of Wine & Business Research, 23(2), 161–175. https://doi.org/https://doi.org/10.1108/17511061111143016
- Davies, J. B., & Best, D. W. (1996). Demand characteristics and research into drug use. Psychological Health, 11, 291–299. https://doi.org/https://doi.org/10.1080/08870449608400258
- Del Boca, F. K., & Noll, J. A. (2000). Truth or consequences: The validity of in health services research on addictions. Addiction, 95, 347–360. https://doi.org/https://doi.org/10.1080/09652140020004278
- Fey, W., Moggi, F., Rohde, K. B., Michel, C., Seitz, A., & Stein, M. (2016). Development of stimulus materials for research in alcohol use disorders. International Journal of Methods and Psychological Research, 26, e1527.
- Glovannucci, E., Colditz, G., Stampfer, M. J., Rimm, E. B., Litin , Sampson, L., et al. (1991). The assessment of alcohol consumption by a simple self-administered questionnaire. American Journal of Epidemiology, 133, 810–817. https://doi.org/https://doi.org/10.1093/oxfordjournals.aje.a115960
- Gmel, G., Kuntsche, E., Wicki, M., & Labhart, F. (2010). Measuring alcohol-related consequences in school surveys: Alcohol-attributable consequences or consequences with students’ alcohol attribution. American Journal of Epidemiology, 171(1), 93–104. https://doi.org/https://doi.org/10.1093/aje/kwp331
- Godden, D. R., & Baddeley, A. D. (1975). Context‐dependent memory in two natural environments: On land and underwater. British Journal of Psychology, 66(3), 325–331. https://doi.org/https://doi.org/10.1111/j.2044-8295.1975.tb01468.x
- Goldman, M. S., & Darkes, J. (2004). Alcohol expectancy multiaxial assessment: A memory network-based approach. Psychological Assessment, 16(1), 4. https://doi.org/https://doi.org/10.1037/1040-3590.16.1.4
- Gordon, R., Heim, D., & MacAskill, S. (2012). Rethinking drinking cultures: A review of drinking cultures and a reconstructed dimensional approach. Public Health, 126(1), 3–11. https://doi.org/https://doi.org/10.1016/j.puhe.2011.09.014
- Greenfield, T. K., & Kerr, W. C. (2008). Alcohol measurement methodology in epidemiology: Recent advances and opportunities. Addiction, 103, 1082–1099. https://doi.org/https://doi.org/10.1111/j.1360-0443.2008.02197.x
- Greenwald, A. G., Brendl, M., Cai, H., Cvencek, D., Dovidio, J. F., Friese, M., & Wiers, R. (2020). The Implicit Association Test at age 20: What is known and what is not known about implicit bias. https://doi.org/https://doi.org/10.31234/osf.io/bf97c
- Hattersley, L., Irwin, M., King, L., & Allman-Farinelli, M. (2009). Determinants and patterns of soft drink consumption in young adults: A qualitative analysis. Public Health & Nutrition, 12(10), 1816–1822. https://doi.org/https://doi.org/10.1017/S136898000800462X
- Hooper, D., Coughland, J., & Millen, M. (2008). Structural equation modelling: Guidelines for determining model fit. Electronic Journal of Business Research Methods, 6(1), 53–60.
- Ihssen, N., & Keil, A. (2013). Accelerative and decelerative effects of hedonic valence and emotional arousal during visual scene processing. Quarterly Journal of Experimental Psychology, 66, 1276–1301. https://doi.org/https://doi.org/10.1080/17470218.2012.737003
- Kuntsche, E., & Kuntsche, S. (2017). Development and initial validation of the alcohol expectancy task. Alcoholism: Clinical and Experimental Research, 41, 1461–1470. https://doi.org/https://doi.org/10.1111/acer.13427
- Kuntsche, E., Le Mevel, L., & Zucker, R. A. (2016). What do preschoolers know about alcohol? Evidence from the electronic Appropriate Beverage Task (eABT). Addictive Behaviours, 61, 47–52. https://doi.org/https://doi.org/10.1016/j.addbeh.2016.05.004
- Kuperman, V., Estes, Z., Brysbaert, M., & Warriner, A. B. (2014). Emotion and language: Valence and arousal affect word recognition. Journal of Experimental Psychology: General, 143, 1065–1081. https://doi.org/https://doi.org/10.1037/a0035669
- Lopez-Caneda, E., & Carbia, C. (2018). The Galician Beverage Picture Set (GBPS): A standardized database of alcohol and non-alcohol images. Drug and Alcohol Dependence, 184, 42–47. https://doi.org/https://doi.org/10.1016/j.drugalcdep.2017.11.022
- McClure, S. M., Li, J., Tomlin, D., Cypert, K. S., Montague, L. M., & Montague, P. R. (2004). Neural correlates of behavioral preference for culturally familiar drinks. Neuron, 44, 379–387. https://doi.org/https://doi.org/10.1016/j.neuron.2004.09.019
- Monk, R. L., & Heim, D. (2013a). A critical systematic review of alcohol-related outcome expectancies. Substance Use & Misuse, 48, 539–557. https://doi.org/https://doi.org/10.3109/10826084.2013.787097
- Monk, R. L., & Heim, D. (2013b). Panoramic projection; affording a wider view on contextual influences on alcohol-related cognitions. Experimental and Clinical Psychopharmacology, 21, 1–7. https://doi.org/https://doi.org/10.1037/a0030772
- Monk, R. L., & Heim, D. (2013c). Environmental context effects on alcohol-related outcome expectancies, efficacy and norms: A field study. Psychology of Addictive Behaviors (APA), 27, 814–818. https://doi.org/https://doi.org/10.1037/a0033948
- Monk, R. L., & Heim, D. (2014). A real-time examination of context effects on alcohol cognitions. Alcoholism: Clinical and Experimental Research, 38(9), 2454–2459. https://doi.org/https://doi.org/10.1111/acer.12504
- Monk, R. L., & Heim, D. (2021). The contextual milieu of alcohol consumption. In R. Cooke, D. Conroy, E.L. Davies, M.S. Hagger, & R de Visser (Eds.), The handbook of the psychology of alcohol consumption. Palgrave Macmillan.
- Monk, R. L., Heim, D., Qureshi, A., & Price, A. (2015). I have no clue what I drunk last night” using smartphone technology to compare in-vivo and retrospective self-reports of alcohol consumption. PLoS One, 10, e0126209. https://doi.org/https://doi.org/10.1371/journal.pone.0126209
- Monk, R. L., Pennington, C. R., Campbell, C., Price, A., & Heim, D. (2016). Implicit alcohol-related expectancies and the effect of context. Journal of Studies on Alcohol and Drugs, 77, 819–827. with students’ alcohol attribution. American Jouranl of Epidemiology, 171, 93–104. https://doi.org/https://doi.org/10.15288/jsad.2016.77.819
- Morean, M. E., Corbin, W. R., & Treat, T. A. (2012). The anticipated effects of alcohol scale: Development and psychometric evaluation of a novel assessment tool for measuring alcohol expectancies. Psychological Assessment, 24(4), 1008. https://doi.org/https://doi.org/10.1037/a0028982
- Muthén, L. K., & Muthén, B. O. (2015). Mplus: User’s guide. Muthén & Muthén.
- Nees, F., Diener, C., Smolka, M. N., & Flor, H. (2011). The role of context in the processing of alcohol‐relevant cues. Addiction Biology, 17(2), 441–451.
- Podstawski, R., Wesołowska, E., Choszcz, D., Markowski, P., & Klimczak, J. (2019). Drinking behaviours and alcohol preferences of female and male students at a Polish university in 2000–2016. Drugs: Education, Prevention and Policy, 26(3), 280–286. https://doi.org/https://doi.org/10.1080/09687637.2017.1411887
- Posner, J., Russell, J. A., & Peterson, B. S. (2005). The circumplex model of affect: An integrative approach to affective neuroscience, cognitive development, and psychopathology. Developmental Psychopathology, 17(3), 715–734.
- Pronk, T., van Deursen, D. S., Behera, E. M., Larsen, H., & Wiers, R. W. (2015). Validation of the Amsterdam beverage picture set: A controlled picture set for cognitive bias measurement and modification paradigms. Alcoholism: Clinical and Experimental Research, 39(10), 2017–2055.
- Room, R., & Mäkelä, K. (2000). Typologies of the cultural position of drinking. Journal of Studies on Alcohol, 61, 475–483. https://doi.org/https://doi.org/10.15288/jsa.2000.61.475
- Russell, J. A. (1980). A circumplex model of affect. ournal of Personality and Social Psychology, 39(6), 1161–1178. https://doi.org/https://doi.org/10.1037/h0077714
- Saunders, J. B., Aasland, O. G., Babor, T. F., de la Feunte, J. R., & Grant, M. (1993). Development of the Alcohol Use Disorders Identification Test (AUDIT): WHO collaborative project on early detection of persons with harmful alcohol consumption–II. Addiction, 88(6), 791–804. https://doi.org/https://doi.org/10.1111/j.1360-0443.1993.tb02093.x
- Schwarz, N. (1999). Self-report; how the questions shape the answers. American Psychology, 54, 93–105. https://doi.org/https://doi.org/10.1037/0003-066X.54.2.93
- Sijtsma, K. (2009). On the use, the misuse, and the very limited usefulness of Cronbach's alpha. Psychometrika, 74(1), 107–120. https://doi.org/https://doi.org/10.1007/s11336-008-9101-0
- Sudhinaraset, M., Wigglesworth, C., & Takeuchi, D. T. (2016). Social and cultural contexts of alcohol use: Influences in a social–ecological framework. Alcohol research: current reviews, 38(1), 35–45. https://www.ncbi.nlm.nih.gov/pmc/articles/PMC4872611/
- Tatlow-Golden, M., Hennessy, E., Dean, M., & Hollywood, L. (2014). Young children's food brand knowledge. Early development and associations with television viewing and parent's diet. Appetite, 80, 197–203. https://doi.org/https://doi.org/10.1016/j.appet.2014.05.015
- Thigpen, N., Keil, A., & Freund, A. (2018). Responding to emotional scenes: Effects of response outcome and picture repetition on reaction times and the late positive potential. Cognition & Emotion, 32(1), 24–36. https://doi.org/https://doi.org/10.1080/02699931.2016.1266305
- Thrul, J., Labhart, F., & Kuntsche, E. (2016). Drinking with mixed‐gender groups is associated with heavy weekend drinking among young adults. Addiction, 112(3), 432–439.
- Townsend, J. T., & Ashby, F. G. (1983). Stochastic modeling of elementary psychological processes. Cambridge University Press.
- Verster, J. C., Benson, S., Johnson, S. J., Alford, C., Godefroy, S. B., & Scholey, A. (2018). Alcohol mixed with energy drink (AMED): A critical review and meta‐analysis. Human Psychopharmacology: Clinical and Experimental, 33(e2650), 1–19.
- Walker, D. W., & Hunter, B. E. (1978). Short-term memory impairment following chronic alcohol consumption in rats. Neuropsychologia, 16, 545–553. https://doi.org/https://doi.org/10.1016/0028-3932(78)90082-9
- Weissenborn, R., & Duka, T. (2003). Acute alcohol effects on cognitive function in social drinkers: Their relationship to drinking habits. Psychopharmacology, 165, 306–312. https://doi.org/https://doi.org/10.1007/s00213-002-1281-1
- Wiers, R. W. (2008). Alcohol and drug expectancies as anticipated changes in affect: Negative reinforcement is not sedation. Substance Use & Misuse, 43, 501–516.
- Wiers, R. W., Eberl, C., Rinck, M., Becker, E. S., & Lindenmeyer, J. (2011). Retraining automatic action tendencies changes alcoholic patients’ approach bias for alcohol and improves treatment outcome. Psychological Science, 22(4), 490–497. https://doi.org/https://doi.org/10.1177/0956797611400615
- Wiers, R. W., Van Woerden, N., Smulders, F. T., & De Jong, P. J. (2002). Implicit and explicit alcohol-related cognitions in heavy and light drinkers. Journal of Abnormal Psychology, 111(4), 648. https://doi.org/https://doi.org/10.1037/0021-843X.111.4.648
- Yamaguchi, M., & Beattie, G. (2020). The role of explicit categorization in the Implicit Association Test. Journal of Experimental Psychology: General, 149(5), 809. https://doi.org/https://doi.org/10.1037/xge0000685
- Zucker, R. A., Donovan, J. E., Masten, A. S., Mattson, M. E., & Moss, H. B. (2008). Early developmental processes and the continuity of risk for underage drinking and problem drinking. Pediatrics, 121(Supplement 4), S252–S272. https://doi.org/https://doi.org/10.1542/peds.2007-2243B