Abstract
The presence of human multidrug resistance protein 1 (MRP1/ABCC1) in the human erythrocyte membrane is well established. In the present study, flow cytometric monitoring is introduced to identify MRP1 as the main transporter of 2′,7′-bis-(3-carboxypropyl)-5-(and-6)-carboxyfluorescein (BCPCF) in the erythrocyte membrane and to facilitate inhibition and kinetic studies of MRP1-mediated transport. The ATP-dependent transport of BCPCF into human erythrocyte inside-out vesicles and, for comparison, into MRP1-expressing Sf9 cell membrane inside-out vesicles were studied. The MRP1-specific monoclonal antibody, QCRL-3 and the MRP1 inhibitor, MK-571 strongly decreased the uptake of BCPCF into both erythrocyte and MRP1-expressing Sf9 cell membrane inside-out vesicles. The inhibition profiles of cyclosporin A, verapamil, benzbromarone, and probenecid in erythrocyte membrane vesicles were typical for MRP1-mediated transport. Furthermore, kinetic constants Km and Vmax of BCPCF transport into erythrocyte membrane inside-out vesicles were determined in the absence and in the presence of selected inhibitors (MK-571, cyclosporin A, benzbromarone and verapamil). The presented results identified MRP1 as the major transporter of BCPCF in the human erythrocyte membrane and showed for the first time that the active transport of fluorescent substrate into inside-out vesicles can be monitored by flow cytometry.
Introduction
Human multidrug resistance protein 1 (MRP1/ABCC1), a member of the ATP-binding cassette (ABC) superfamily of membrane transporters, is an organic anion efflux pump (Litman et al. Citation2001, Borst & Elferink Citation2002). MRP1 transports a large number of physiologically important substances as well as toxic metabolites and xenobiotics across the membrane (Hipfner et al. Citation1999a, Leslie et al. Citation2001, Haimeur et al. Citation2004, Deeley & Cole Citation2006). Many of these compounds, transported as glutathione-, glucuronate- and sulfate-conjugates (e.g., leucotriene C4, LTC4; S-(2,4-dinitrophenyl) glutathione, DNP-SG; 17β-estradiol 17-(β-D-glucuronide), E217βG), are often used radiolabelled in transport studies performed on inside-out membrane vesicles (IOVs) (Pulaski et al. Citation1996, Campbell et al. Citation2004, Conseil et al. Citation2006). Polyanionic fluorescent compounds also belong to the wide spectrum of MRP1 substrates (Feller et al. Citation1995, Draper et al. Citation1997). MRP1-mediated active transport of drugs belongs to the most common mechanism of multidrug resistance. The observed decrease in fluorescent dye accumulation in cells overexpressing MRP1 is a basis for inhibition studies in the search for efficient reversing agents (Homolya et al. Citation1993, Holló et al. Citation1996, Glavinas et al. Citation2004).
MRP1 is ubiquitously expressed in the human body. The human erythrocyte membrane, with its well-established presence of MRP1, makes this cell potentially useful in studies of MRP1-mediated transport and its inhibition (Pulaski et al. Citation1996). Our previous studies on the inhibition of BCPCF transport across the human erythrocyte membrane (whole-cell model) suggested that MRP1 is the main exporter of this fluorescent poly-anion (Bobrowska-Hägerstrand et al. Citation2001, Citation2003a). Of the many compounds tested, some flavonoids and stilbenes were effective inhibitors of BCPCF efflux from human erythrocytes (Bobrowska-Hägerstrand et al. Citation2003b, Citation2006); therefore, the nature of their interaction with the transporter should be clarified in detail.
The purpose of the present study was to introduce and describe flow cytometric monitoring of MRP1-mediated BCPCF transport into erythrocyte membrane inside-out vesicles (E-IOVs). The effects of the monoclonal MRP1 antibody QCRL-3 and MRP1 inhibitors on the ATP-dependent transport of BCPCF into E-IOVs and, for comparison, into the MRP1-expressing Sf9 cell membrane inside-out vesicles (MRP1-Sf9-IOVs) were investigated. The kinetic constants for BCPCF transport modulated by a set of known MRP1 inhibitors were determined to validate the usefulness of the erythrocyte membrane and flow cytometric measurements in MRP1 transport studies.
Materials and methods
Chemicals
2′,7′-bis-(3-carboxypropyl)-5-(and-6)-carboxyfluorescein (BCPCF, B-14440) were from Molecular Probes (Leiden, The Netherlands). MK-571 (475874) was from Calbiochem (Darmstadt, Germany). Probenecid (P-8761), verapamil (V-4629), benzbromarone (B-5774), and cyclosporin A (C-3662) were from Sigma (Steinheim, Germany). Sigmacell cellulose type 50 (micro) and α-cellulose (S-5504 and C-8002) were from Sigma (St Louis, MO, USA). Monoclonal antibodies QCRL-1 (801-010-L001) was from Alexis Biochemical (San Diego, CA, USA) and QCRL-3 (8767-01) was from Signet (Dedham, MA, USA). Membrane vesicles isolated from Sf9 cells expressing human MRP1 (SB-MRP1-Sf9-VT) and from cells infected with a baculovirus stock containing a defective MRP1 gene (SB-defMRP-Sf9-CTRL) were from SOLVO Biotechnology (Szeged, Hungary). ATP dependent 3H-LTC4 transport was determined for SB-MRP1-Sf9-VT and for SB-defMRP-Sf9-CTRL, 22.8 pmol mg−1 min−1 and 6.0 pmol mg−1 min−1, respectively. According to the provider (Solvo Biotechnology, www.solvo.com/Support/FAQs.html) the content of IOVs in the Sf9-IOVs preparations is under 16%.
Probenecid, verapamil, benzbromarone, MK-571, and cyclosporin A were dissolved in dimethylsulphoxide (DMSO). The maximum DMSO concentration in the samples was 0.5% at which concentration the studied parameters were not affected.
Preparation of inside-out vesicles from human erythrocyte membrane
Human erythrocyte membranes (ghosts) and inside-out human erythrocyte membrane vesicles were prepared according to Steck and Kant (Citation1974) with modifications. Briefly, human blood was drawn from the authors by venipuncture into tubes containing EDTA. The red blood cells were washed with the PBS (3000 g, 10 min, 4°C). Following centrifugation, the buffy coat and the uppermost layer of the cell pellet was discarded. The erythrocyte suspension was run through a column containing PBS-wetted micro- and α-cellulose (1:1 w/w) to further deplete residual leukocytes (Beutler et al. Citation1976). The collected erythrocytes were centrifuged (3000 g, 10 min, 4°C) and the packed cells were haemolysed in haemolysis buffer (HB: 20 mM TrisHCl, 1 mM EDTANa2, 575 µM PMSF, pH 7.4 at 4°C, 1:40 v/v). The erythrocyte membranes were washed three times in HB (20,000 g, 30 min, 4°C) and incubated overnight in vesiculation buffer (VB: 250 mM sucrose, 0.1 mM EDTANa2, 0.5 mM TrisHCl, pH 8.0–8.2 at 4°C, 1:50 v/v). After incubation, the suspension was washed with VB (25,000 g, 30 min, 4°C) and the resulting pellet containing vesicles was passed through a 27-gauge needle at 4°C at least 10 times. The protein concentration of the vesicle preparations was determined according to Lowry et al. (Citation1961) with BSA as the protein standard. The membrane vesicles sidedness (the percentage of inside-out vesicles in the preparation) was calculated as the relative accessibility of the ectoenzyme acetylcholinesterase. Acetylcholinesterase activity was measured according to Ellman et al. (Citation1961). The vesicle preparations at a protein concentration ≥1 mg/ml and inside-out vesicle content >30% were stored at −75°C until used.
Inhibition and kinetic studies of ATP-dependent BCPCF transport into inside-out membrane vesicles
ATP-dependent transport of BCPCF into human erythrocyte membrane inside-out vesicles and Sf9 cell membrane inside-out vesicles (Sf9-IOVs) was measured by flow cytometry (for details see below).
For the transport experiments, E-IOVs or MRP1-Sf9-IOVs and CTRL-Sf9-IOVs were quickly thawed and diluted to a 1 mg/ml protein concentration in VB. The membrane vesicles were incubated at a final protein concentration of 0.5 mg/ml in the presence of 2.5 mM ATP or 2.5 mM AMP in transport buffer containing 250 mM sucrose, 10 mM MgCl2, 0.66 mM oubain, 10 mM phosphocreatine, 1 U/ml phosphocreatine kinase, and 10 mM Tris HCl, pH 7.4 at 37°C (Rychlik et al. Citation2003). Incubation was carried out at the BCPCF concentrations given in the respective Figure legends. The volume of incubated samples was 100 µl for E-IOVs and 20 µl for Sf9-IOVs. At the indicated incubation time, samples were placed on ice and 1 ml of ice-cold VB was added to stop the transport. Subsequently, the vesicles were carefully washed twice with 1 ml of VB (15,000 g, 5 min, 4°C) and BCPCF accumulation in the final pellet was recorded by flow cytometry. In the indicated cases, traditional spectrofluorimetric measurements of BCPCF accumulation in E-IOVs were performed. The incubation was carried out as described above except that the volume of the incubated samples was 500 µl.
For the inhibition studies, the transport of BCPCF (5 µM) was carried out in the presence of various inhibitors and the concentration-dependent inhibition was expressed as the percentage of the ATP-dependent transport in the control (in the absence of inhibitor). To study the effects of MRP1-specific monoclonal antibodies (mAbs: QCRL-1, QCRL-3) on BCPCF uptake, the E-IOVs and Sf9-IOVs were preincubated with mAbs for 30 min in RT. The concentrations of the inhibitors and mAbs are indicated in the respective Figure legends. The transport experiments were carried out as describe above.
For the kinetic studies, the concentration dependency of BCPCF transport into IOVs was studied in the absence and in the presence of inhibitors. Kinetic constants for BCPCF transport were determined in the concentration range of 1–15 µM for E-IOVs and 1–25 µM for Sf9-IOVs using nonlinear least-squares regression analysis. The data of ATP-dependent BCPCF transport were fitted to the Michaelis-Menten equation v = Vmax×[S]/(Km+[S]), where v is the calculated ATP-dependent BCPCF transport in given time, Km is the Michaelis constant and [S] is the BCPCF (substrate) concentration. Data analysis was performed using GraphPad Prism software. Km was expressed in µM. The relative value of the maximal rate (Vmaxrel) was expressed as the ratio of Vmax determined in the presence of inhibitor to Vmax of the control. To express Vmax in pmol×mg−1×h−1, the active BCPCF uptake determined by flow cytometry was calibrated using a traditional spectrofluorimetric measurement. The apparent kinetic constants determined at the presence of IC50 concentration of selected inhibitors are compared with kinetic constants in the absence of inhibitors in order to indicate possible nature of the inhibition (Cornish-Bowden Citation2004).
Flow cytometric recording of BCPCF accumulation in human erythrocyte and Sf9 cell membrane inside-out vesicles
The final pellet of the IOVs samples incubated as described above was diluted to at least 200 µl with VB and then kept on ice in the dark until flow cytometric analysis (FACSCalibur, Beckton Dickinson, San Jose, CA, USA). BCPCF fluorescence excited at 488 nm (argon ion laser) was collected with a 530 nm±30 nm band-pass filter (FL1 channel). The acquisition of fluorescence emission intensity was simultaneous with the collection of forward light scattering (FSC channel) and side light scattering (SSC channel).
The flow rate was adjusted to a low level (12 µl/min) because of the high viscosity of the sucrose-containing VB. The background signal of VB was below 50 events/s, and the samples were diluted to generate signals of 1000–2000 events/s. 30,000–100,000 events per sample were collected without gating usually within 1 min. The fluorescence measurements were on a logarithmic scale. The data were analysed using CellQuest software, and the median of the histogram fluorescence intensity (MFI) was taken as a measure of the BCPCF accumulation of the sample.
The ATP-dependent transport of BCPCF into IOVs was expressed as the difference between MFI in the presence of ATP and in the presence of AMP.
Spectrofluorimetric recording of BCPCF accumulation in human erythrocyte membrane inside-out vesicles
The spectrofluorimetric detection of BCPCF accumulation was carried out according to Rychlik et al. (Citation2003). The final pellet of the E-IOVs samples incubated as describe above was dissolved in 1 ml of 1% Triton X-100 buffered with 10 mM Tris, pH 10.0, at room temperature. The fluorescence intensity of the accumulated BCPCF was recorded on a spectrofluorimeter (F-2000 Fluorescence Spectrophotometer, Hitachi, Nissei Sangyo) at an excitation wavelength of 488 nm, emission wavelength 524 nm, and with excitation and emission slits of 10 nm. A standard curve was made for the BCPCF concentration range of 2–80 nM. The accumulation of BCPCF was given quantitatively as the total amount of fluorophore in the sample normalised to protein concentration in the sample and inside-out vesicle content in the preparation used. ATP-dependent BCPCF uptake was presented as the difference of the BCPCF accumulation in the presence of ATP and in the presence of AMP.
Spectrofluorimetric measurements were carried out in control samples to quantify the active uptake of BCPCF determined by flow cytometry. The calibration procedure was based on the observed linear correlation between the fluorescence intensities determined by traditional spectrofluorimetry and by flow cytometry analysis. The concentration-dependent accumulation of BCPCF (in the range of 1–15 µM) was measured in parallel using both techniques and the normalised accumulation of BCPCF from spectrofluorimetric measurements versus the median fluorescence intensity from flow cytometric measurements was plotted. The calibration factor was determined from linear regression analysis as a slope.
Results
Flow cytometric recording of transport into inside-out membrane vesicles – general remarks
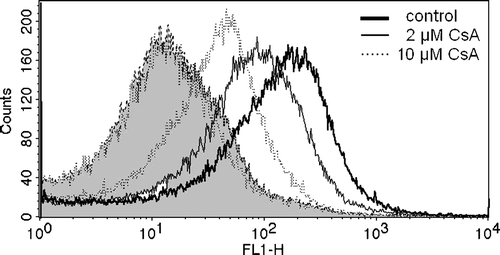
In this study we showed that the FACSCalibur instrument is capable of detecting inside-out membrane vesicles as objects and may be used to determine the active transport of fluorescent substrate into the lumen of the vesicles. The multiple-channel detection of single vesicle by flow cytometry provides the possibility of the simultaneous measurement of various parameters. For instance, the forward scattering presented in FSC histograms reflects the size of the studied objects, thus the homogeneity of membrane vesicles preparations could be determined (A, 1B). FITC-labelled beads were measured regularly to adjust instrument settings and to evaluate instrument sensitivity. Comparison of the results between different experiments may be done thanks to the stable position of the fluorescence intensity signal of reference beads. The increased accumulation of fluorescent substrate BCPCF by membrane vesicles is reflected as an increase in fluorescence intensity registered in the fluorescence channel (FL-1) (C, 1D). The concentration-dependent inhibition of ATP-dependent BCPCF transport into E-IOVs is shown as an example for cyclosporin A in .
Figure 1. Flow cytometric analysis of the homogeneity of the membrane vesicles preparations (top). (A) Forward scattering (FSC) histograms of E-IOVs indicating homogenous (bold solid line) and non-homogenous (solid line, filled curve) preparations. (B) Forward scattering (FSC) histograms of MRP1-Sf9-IOVs (bold solid line) and CTRL-Sf9-IOVs (solid line, filled curve). Determination of ATP-dependent BCPCF transport into membrane vesicles (bottom). Overlay of fluorescence intensity (FL-1) histograms for (C) E-IOVs incubated with 15 µM BCPCF for 60 min at 37°C and (D) MRP1-Sf9-IOVs incubated with 15 µM BCPCF for 30 min at 37°C. The ATP-dependent transport was calculated by subtraction of the MFI values of the histogram in the presence of ATP (bold solid line) and of the histogram in the presence of AMP (solid line). The plot of E-IOVs incubated in the presence of ATP (C) shows a typical profile that was similar in all preparations.
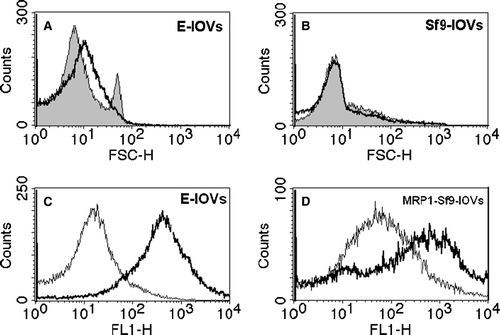
Figure 2. Inhibition of ATP-dependent BCPCF transport into erythrocyte membrane inside-out vesicles by cyclosporin A. E-IOVs were incubated with 5 µM BCPCF for 60 min at 37°C in the absence (control) and in the presence of cyclosporin A (CsA) for flow cytometric analysis. Fluorescence (FL-1) histograms in the presence of ATP for control (bold solid line) and for CsA concentrations of 2 µM (solid line) and 10 µM (dotted line) and in the presence of AMP (dotted lines, filled curves) are shown as an overlay graph. This experiment is representative of three independent experiments.
MRP1-mediated ATP-dependent transport of the fluorescent substrate BCPCF into inside-out erythrocyte and MRP1-Sf9 cell membrane vesicles
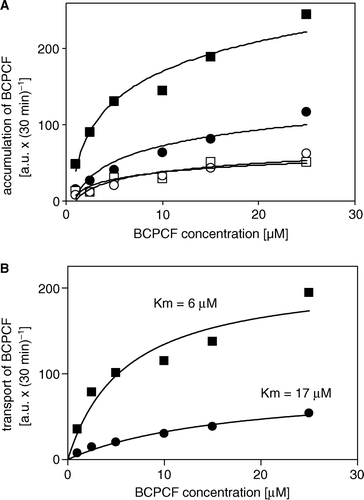
BCPCF (5 µM) accumulation by erythrocyte membrane inside-out vesicles as a function of incubation time is shown in . The calculated ATP-dependent transport was linear for at least 60 min. The rate of ATP-dependent BCPCF transport for E-IOVs is presented as a function of BCPCF concentration (A). The BCPCF binding in the presence of AMP was about 10% of the ATP-dependent transport. The kinetic constants of BCPCF transport into E-IOVs were determined in the concentration range 1–15 µM using nonlinear fitting to the hyperbolic Michaelis-Menten equation (B). The values of Km and Vmax for E-IOVs prepared from different blood donors are summarized in and presented in B as an example. These data indicate that the affinity of BCPCF to the transporter or/and the capacity of BCPCF transport are donor specific, with an average Km value of 8.8±1.7 µM and Vmax value of 410±76 pmol×mg−1×h−1.
Figure 3. ATP-dependent transport of BCPCF into inside-out erythrocyte membrane vesicles. E-IOVs were incubated with BCPCF (5 µM) at 37°C. The ATP-dependent transport of BCPCF (⋄) was calculated as the difference of BCPCF accumulation measured by flow cytometry in the presence of ATP (▪) and in the presence of AMP (□). Median of the histogram fluorescence intensity was taken as a measure of the BCPCF accumulation of the sample. Values are the mean±SD of triplicate determinations in a single experiment. Two additional experiments for vesicles prepared from the blood of the other donors show similar results.
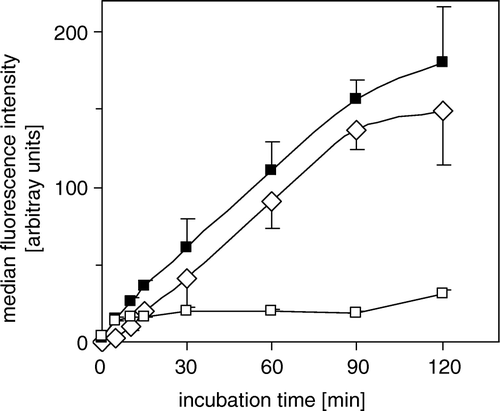
Figure 4. Kinetics of ATP-dependent BCPCF transport into inside-out erythrocyte membrane vesicles. (A) The rate of BCPCF accumulation into E-IOVs was measured with varying BCPCF concentrations (1–15 µM) for 60 min at 37°C in the presence of ATP (▪) and in the presence of AMP (□). (B) The calculated rate of ATP-dependent transport of fluorophore into vesicles shown in A (⋄), and data for E-IOVs prepared from the blood of another donor (▴), are plotted. Kinetic constants Km and Vmax for BCPCF transport were determined using nonlinear fitting to the hyperbolic Michaelis-Menten equation. Each value in A and B is the mean±SD of three independent calibrated experiments made in duplicate.
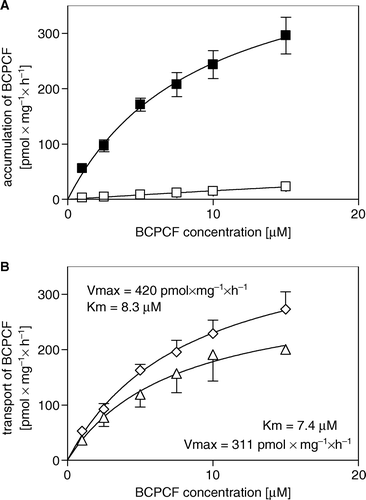
Table I. Kinetic constants Km and Vmax for ATP-dependent BCPCF transport into erythrocyte membrane inside-out vesicles.
Analogous studies were performed for Sf9-IOVs. The rates of BCPCF accumulation both for CTRL- and MRP1-Sf9-IOVs are presented as a function of BCPCF concentration (A). Both CTRL- and MRP1-Sf9-IOVs showed the same binding of the substrate in the presence of AMP. This unspecific binding was about 30% of ATP-dependent BCPCF transport into inside-out vesicles prepared from MRP1-Sf9 cell membrane and was on the level of ATP-dependent transport into CTRL-Sf9-IOVs. The Km value of 6.0 µM of BCPCF transport into MRP1-Sf9-IOVs determined in the concentration range 1–25 µM using nonlinear fitting to the hyperbolic Michaelis-Menten equation shows the similar affinity of the substrate to the transporter in erythrocytes and MRP1-Sf9 cell membrane (B). The comparison of the maximal rate of BCPCF transport into E-IOVs and MRP1-Sf9-IOVs shows that the capacity of BCPCF transport for MRP1-Sf9-IOVs is approximately 4-fold higher than for E-IOVs. The value is underestimated because the relative inside-out vesicles content of the Sf9-IOVs preparation (<16%) is lower than the relative inside-out vesicles content of the E-IOVs preparations (30–50%).
Figure 5. Kinetics of ATP-dependent BCPCF transport into inside-out Sf9 cell membrane vesicles. (A) MRP1-Sf9-IOVs (▪, □) and CTRL-Sf9-IOVs (•, ○) were exposed for 30 min to various concentrations of BCPCF (1–25 µM) in the presence of either ATP (▪, •) or AMP (□, ○). Each data point is the mean value of duplicate determinations of the accumulation in a single experiment. Similar results were obtained in one additional independent experiment. (B) Kinetic constants Km and Vmax for BCPCF transport were determined using nonlinear fitting to the hyperbolic Michaelis-Menten equation. ATP-dependent transport values calculated (see legend to ) from data shown in A for MRP1-Sf9-IOVs (▪) and CTRL-Sf9-IOVs (•) are plotted.
To demonstrate that BCPCF transport into E-IOVs and MRP1-Sf9-IOVs is specifically mediated by MRP1, uptake was measured using 5 µM of substrate in the presence of the MRP1-specific monoclonal antibodies QCRL-3 and QCRL-1 (Hipfner et al. Citation1999b) and of MK-571, an established inhibitor of MRP-mediated transport (). QCRL-3, an MRP1-specific conformation-dependent monoclonal antibody, inhibited transport by about 80% into E-IOVs and MRP1-Sf9-IOVs (A, 6D). There was no inhibition of CTRL-Sf9-IOVs mediated transport by QCRL-3 (D). QCRL-1, a monoclonal antibody specific to a linear epitope of human MRP1, had no effect on BCPCF transport into either of the studied vesicle systems (C, 6D). MK-571 at 2 µM decreased ATP-dependent BCPCF transport into both E-IOVs and MRP1-Sf9-IOVs by 50% (B, 6D).
Figure 6. Effect of the MRP1-specific antibodies QCRL-3 and QCRL-1 and of the MRP-specific inhibitor MK-571 on BCPCF transport into the lumen of inside-out membrane vesicles. The influence of modulators on ATP-dependent BCPCF (5 µM) transport into E-IOVs (60 min) and Sf9-IOVs (30 min) are shown in A, B, C and in D, respectively. Results are expressed as a percentage of control (in the absence of modulators). (A) Concentration dependent inhibition by the monoclonal MRP1-specific antibody QCRL-3 and (B) by the MRP-specific inhibitor MK-571. Bars represent the mean±SD of three experiments done in duplicate on preparations from different blood donors. (C) The effects of monoclonal MRP1-specific antibody QCRL-1 (4 µg/ml), sucrose (1 M), or Triton X-100 (0.02%). Bars represent the mean of two experiments done in duplicate. (D) The effects of QCRL-3 (4 µg/ml), QCRL-1 (4 µg/ml), sucrose (1 M), Triton X-100 (0.02%) and MK-571 (2 µM) on ATP-dependent transport into CTRL-Sf9-IOVs (grey bars) and MRP1-Sf9-IOVs (black bars). Bars represent the mean±SD (of three experiments done in duplicate) or the mean (of two experiments done in duplicate). Significant difference from control calculated with Student's t-test; *p < 0.05, **p < 0.01.
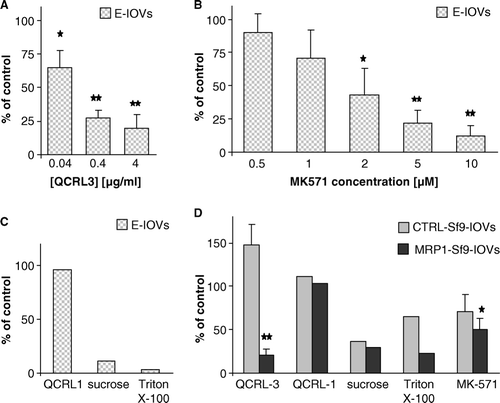
To confirm the transport of fluorophore into the lumen of IOVs, we showed the elimination of ATP-dependent BCPCF transport into shrunk (in the presence of 1 M sucrose) or permeabilized (in the presence of 0.02% Triton X-100) inside-out cell membrane vesicles (C, 6D).
Effect of selected inhibitors on BCPCF transport into inside-out erythrocyte membrane vesicles
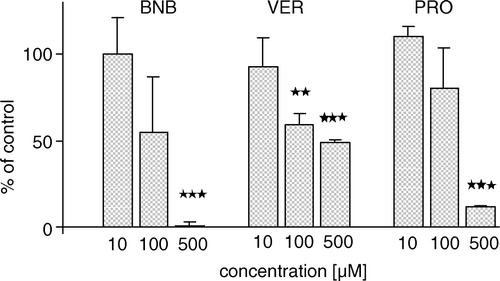
ATP-dependent BCPCF transport into E-IOVs was measured at several different concentrations of benzbromarone, probenecid, and verapamil (). These established inhibitors of transport systems for organic anions significantly inhibited BCPCF transport into E-IOVs: benzbromarone (100 µM) by up to 100% and probenecid (500 µM) by about 90%. Verapamil, an inhibitor of cationic transport, inhibited BCPCF uptake by about 50% at 5 µM (data not shown), and increasing the concentration to 100 µM did not cause further changes in inhibition efficiency. The concentration-dependent inhibition by cyclosporin A and by MK-571 is shown in separate figures ( and B, respectively). For these two inhibitors a similar inhibition profile in the range of 1–10 µM was received, with 50% inhibition at 1–2 µM and a maximal inhibition of about 80%.
Figure 7. The effect of various inhibitors on ATP-dependent BCPCF transport into human erythrocyte membrane inside-out vesicles. ATP-dependent transport of BCPCF (5 µM, 60 min, 37°C) in the presence of benzbromarone (BNB), verapamil (VER), and probenecid (PRO) is expressed as the percentage of the transport in the absence of inhibitors (control). The values of concentration-dependent inhibition are the mean±SD of duplicate determination in three experiments (each performed on E-IOVs preparation from the blood of a different donor). Significant difference from control calculated with Student's t-test; *p < 0.01, **p < 0.001.
Kinetic analysis of BCPCF transport inhibition by selected inhibitors
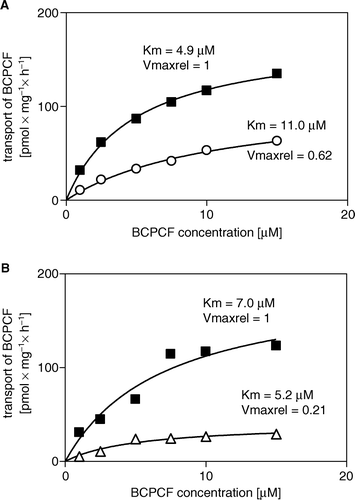
To determine the influence of benzbromarone, verapamil, cyclosporin A, and MK-571 on ATP-dependent BCPCF transport into E-IOVs, we compared the kinetic constants in the absence and in the presence of inhibitors. The average kinetic constants values for BCPCF uptake in the presence of MK-571, cyclosporin A, benzbromarone, and verapamil together with the respective control values are summarized in . The kinetic analysis of BCPCF transport inhibition by benzbromarone and verapamil was based on flow cytometric measurements without calibration. In the presence of benzbromarone (5 µM), Km was increased (p<0.05), indicating that this compound inhibited BCPCF transport into E-IOVs competitively (). In contrast, the significant decrease in both Km (p<0.01) and Vmax (p<0.01) for BCPCF transport inhibited by verapamil (10 µM) might be the consequence of an uncompetitive inhibition mechanism (, ).
Figure 8. Inhibition of ATP-dependent BCPCF transport into erythrocyte membrane inside-out vesicles by benzbromarone and verapamil. ATP-dependent BCPCF transport was determined from uncalibrated flow cytometric measurements at various substrate concentrations (1–15 µM) for 60 min in the absence (▪) or in the presence of 5 µM benzbromarone (○) and in the presence of 10 µM verapamil (Δ). Data were plotted from a single experiment in duplicate and the kinetic constants Km and Vmaxrel were calculated using nonlinear fitting to the hyperbolic equation. Similar results were obtained in two additional experiments done with E-IOVs preparations from the blood of the other donors. Summarized results are shown in .
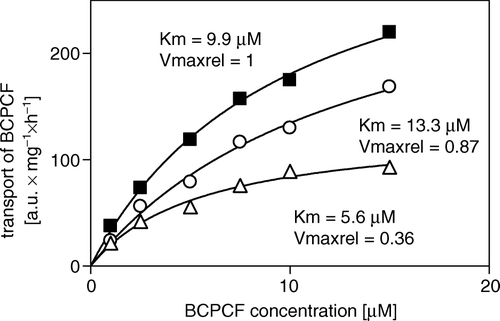
Table II. Effect of inhibitors on the kinetic constants Km and Vmax for BCPCF transport into erythrocyte membrane inside-out vesicles.
Calibrated FACS measurements for kinetic studies were performed in the presence of MK-571 and cyclosporin A, the two most effective inhibitors in this investigation. The Km value for BCPCF transport inhibited by MK-571 (1 µM) was approximately two-fold higher (p<0.05) than the Km determined for the fluorophore transport in the absence of inhibitor, indicating that the mode of inhibition is competitive (A). Cyclosporin A (2 µM) had no significant effect on the Km value, but decreased the Vmax value approximately two-fold (p<0.05). Thus cyclosporin A seemed to behave as a non-competitive inhibitor of BCPCF transport into E-IOVs (B, ).
Figure 9. Inhibition of ATP-dependent BCPCF transport into erythrocyte membrane inside-out vesicles by MK-571 (A) and cyclosporin A (B). The ATP-dependent BCPCF transport was determined from calibrated flow cytometric measurements at various substrate concentrations (1–15 µM) for 60 min at 37°C in the absence (▪, A and B) or in the presence of 1 µM MK-571 (○, A) and in the presence of 2 µM CsA (Δ, B). Data were plotted from a single experiment in duplicate and the kinetic constants Km and Vmax were calculated using nonlinear fitting to the hyperbolic equation. Similar results were obtained in two additional experiments done on E-IOVs from the blood of the other donors. Summarized results are shown in . Vmax determined for the controls were 176 pmol×mg−1×h−1 and 191 pmol×mg−1×h−1 in the A and B, respectively.
Discussion
In the present report we described a flow cytometric approach to studying the ATP-dependent transport of fluorescent substrate into cell membrane IOVs. Monitoring by flow cytometry was used to determine the influence of the MRP1-specific antibodies QCRL-1 and QCRL-3 and of various inhibitors on BCPCF transport into E-IOVs in order to show directly that BCPCF uptake is mainly MRP1 mediated.
Monitoring BCPCF accumulation into E-IOVs is possible with a FACSCalibur instrument operated near its limit of sensitivity. Therefore, reports concerning flow cytometric detection of objects smaller than cells are rare (Fuller & Sweedler Citation1996, Böhl et al. Citation2005, Pozharski & MacDonald Citation2005) and there are no studies in the literature using flow cytometry to measure transport into membrane IOVs. The unique advantage of monitoring fluorescent substrate uptake into IOVs by flow cytometry is the data acquisition of single objects and the possibility of multiple-channel recording. For instance, analysis of the FSC histogram let us determine the homogeneity of the membrane preparation (A, 1B). The added benefits of using flow cytometry are the relatively small amount of membrane material needed and the use of fluorescent instead of more expensive radioactively labelled substrates. The values for the ATP-dependent uptake of BCPCF into E-IOVs obtained in arbitrary units from flow cytometric analysis need to be quantified in case the absolute value of the transport rate is required. The calibration introduced in this paper makes possible a determination of Vmax in pmol×mg−1×h−1 for BCPCF transport across the erythrocyte membrane.
We showed by inhibition with QCRL-3 that at least 80% of BCPCF transport across the membrane in the E-IOVs is mediated by MRP1. This is in line with results previously presented for the uptake of another fluorescein derivative, BCECF (Rychlik et al. Citation2003), and for high-affinity DNP-SG transport (Klokouzas et al. Citation2001) into erythrocyte membrane IOVs. MRP1-mediated transport of LTC4 into MRP1-transfected HeLa cell (HeLa-5) vesicles (Tabas & Dantzig Citation2002) and of DNP-SG (3 µM) into L23/R cell vesicles (Klokouzas et al. Citation2001) were also inhibited by the anti-MRP1 monoclonal antibody QCRL-3 by up to 90%. The monoclonal antibody QCRL-1 used as a control in our study had, as expected (Tabas & Dantzig Citation2002, Rychlik et al. Citation2003), no influence on MRP1-mediated BCPCF transport into E-IOVs. The fact that BCPCF transport into MRP1-Sf9-IOVs was inhibited by QCRL-3 but not by QCRL-1 additionally confirms that MRP1 is the main transporter of BCPCF across the erythrocyte membrane. ATP-dependent BCPCF transport into CTRL-Sf9-IOVs was detectable and not inhibited by QCRL-3. The magnitude of this transport was the same as the portion of ATP-dependent BCPCF transport into MRP1-Sf9-IOVs not inhibited by QCRL-3. Thus some other mechanism of BCPCF accumulation possibly exists both in MRP1-Sf9-IOVs and CTRL-Sf9-IOVs. This is in agreement with data given in product information (SOLVO Biotechnology) for ATP dependent 3H-LTC4 transport into CTRL-Sf9-IOVs and into MRP1-Sf9-IOVs.
Besides MRP1 (Pulaski et al. Citation1996), expression of the anionic transporters MRP4 (ABCC4) and MRP5 (ABCC5) has been established in the human erythrocyte membrane (Jedlitschky et al. Citation2000, Klokouzas et al. Citation2003). Our results show that neither QCRL-3 nor MK-571 inhibit BCPCF transport completely. It has been shown (Wu et al. Citation2005) that efflux of the fluorescein derivative BCECF from MRP5-expressing HEK293 cells was moderately inhibited by 25 µM of MK-571. Thus, it seems probable that MRP5 is to some degree a mediator of the studied BCPCF transport across the erythrocyte membrane, which is consistent with the partial labelling of HEKc10 cells (expressing MRP5) by BCECF (McAleer et al. Citation1999). In contrast, it has been reported that 50 µM of MK-571 did not change the sensitivity of MRP5-expressing HEK293 cells to thioguanine, a known substrate of MRP5 (Wu et al. Citation2005). The investigation of several fluorescent compounds, including BCECF, showed no differences in accumulation between MRP4-overexpressing and untransfected cells (Wu et al. Citation2005). Thus, the involvement of MRP4 in BCPCF transport across the erythrocyte membrane seems unlikely.
In our study, benzbromarone, a non-specific anionic transport inhibitor, completely blocked uptake into E-IOVs, which indicates that only anion transporters transport BCPCF. The same effect of benzbromarone was reported for BCECF uptake into E-IOVs measured by traditional spectrofluorimetry (Rychlik et al. Citation2003). Our results indicate that both MK-571 and BNB inhibit MRP1-mediated BCPCF transport competitively, although with MK-571's affinity to the transporter 10-fold higher than that of BNB. Competitive inhibition of BCPCF transport by MK-571 with a Ki value of 1.2 µM preliminary determined in the present study was in agreement with the inhibition constants published in previous studies on E-IOVs, HEL, and HMC-1 cell vesicles with high-affinity MRP1 substrates, i.e., LTC4 and DNP-SG (Pulaski et al. Citation1996, Bartosz et al. Citation1998).
Cyclosporin A appears to be an effective inhibitor of both BCPCF uptake into E-IOVs and BCPCF efflux from intact erythrocytes (unpublished results, Bobrowska-Hägerstrand). This is in line with the reported inhibition of calcein efflux from SW1573 MRP1-transfected cells and HL60 ADR cells by cyclosporin A (Holló et al. Citation1996). The kinetic studies indicate that cyclosporin A does not compete for a binding site with BCPCF and probably has a quite separate binding site as a consequence of its high hydrophobicity and lack of charge.
Verapamil, bearing a positive charge, inhibited MRP1-mediated uptake of BCPCF into E-IOVs by up to 50%. Our results are comparable with those reported for verapamil-inhibited uptake of BCECF in E-IOVs (Rychlik et al. Citation2003) and for calcein efflux in MRP1-overexpressing cells (Holló et al. Citation1996). In contrast to inhibition of BCPCF and BCECF transport, verapamil inhibited the uptake of the conjugated substrates LTC4 and E217βG only in the presence of GSH (Loe et al. Citation2000). This dichotomy might be partially interpreted by our results which indicate an uncompetitive mode of inhibition of MRP1-mediated BCPCF transport in the presence of verapamil. We suggest that verapamil binding to the substrate-transporter complex is achieved only if some positive-charged amino acids of the substrate-binding site are screened off or occupied by the conjugated substrate and GSH or by polyanionic BCPCF itself. This explanation is strengthened by the fact that verapamil has been shown not to be a MRP1 substrate (Leslie et al. Citation2001).
In a number of studies, probenecid, an inhibitor of anionic transport, was used as a modulator of MRP1-mediated transport. The profile of BCPCF transport into E-IOVs inhibited by probenecid obtained in our study was in agreement with the values published previously for many other substrates studied in various experimental systems (Holló et al. Citation1996, Bartosz et al. Citation1998, Bakos et al. Citation2000, Klokouzas et al. Citation2001, Rychlik et al. Citation2003). We wish to stress that the activities of all the reference inhibitors investigated in our study are compatible with other results concerning MRP1-mediated transport.
In conclusion, we have shown that MRP1 is the main BCPCF transporter in the erythrocyte membrane. In addition, excellent agreement was obtained on the efficiency of the inhibitors on BCPCF uptake and efflux across the erythrocyte membrane in E-IOVs and erythrocytes, respectively. These facts together allow the examination of a large variety of pharmacologically important compounds in intact erythrocytes as the preliminary step before detailed estimation of their interactions with the MRP1 transporter in IOVs system. The results reported here provide evidence that the flow cytometric approach for monitoring fluorescent substrate accumulation into IOVs is a reliable method, alternative to rapid filtration measurements of radioactive labelled substrates. Flow cytometry can be widely adapted for transport studies of fluorescent or fluorescence-labelled substrates.
Acknowledgements
We are indebted to the Research and Science Foundation of Farmos, the Paulo Foundation, the Magnus Ehrnroot Foundation and the K.A. Johansson Foundation for their financial support. A.W. acknowledges support from the Research Institute of Åbo Akademi University. B.R. acknowledges financial support from both Åbo Akademi University and EU COST B16 action. Thomas Söderström, Jouko Sandholm and Perttu Terho are thanked for advice on flow cytometry. Gunilla Henriksson, Esa Nummelin and Thomas Bymark are gratefully acknowledged for technical assistance. This study was initiated within the framework of the EU COST-action ‘Multidrug Resistance Reversal’ (B16).
References
- Bakos E, Evers R, Sinko E, Varadi A, Borst P, Sarkadi B. Interactions of the human multidrug resistance proteins MRP1 and MRP2 with organic anions. Mol Pharmacol 2000; 57: 760–768
- Bartosz G, Koning J, Keppler D, Hagman W. Human mast cells secreting leukotriene C4 express the MRP1 gene-encoded conjugate export pump. Biol Chem 1998; 379: 1121–1126
- Beutler E, West C, Blume KG. The removal of leukocytes and platelets from whole blood. J Lab Clin Med 1976; 88: 328–333
- Bobrowska-Hägerstrand M, Wróbel A, Rychlik B, Bartosz G, Söderström T, Shirataki Y, Motohashi N, Molnár J, Michalak K, Hägerstrand H. Monitoring of MRP-like activity in human erythrocytes: inhibitory effect of isoflavones. Blood Cells, Molec Dis 2001; 27: 894–900
- Bobrowska-Hägerstrand M, Wróbel A, Mrówczynska L, Söderström T, Hägerstrand H. Modulation of MRP-like efflux activity in human erythrocytes caused by membrane perturbing agents. Molec Membr Biol 2003a; 20: 255–259
- Bobrowska-Hägerstrand M, Wróbel A, Mrówczynska L, Söderström T, Shirataki Y, Motohashi N, Molnár J, Michalak K, Hägerstrand H. Flavonoids as inhibitors of MRP1-like efflux activity in human erythrocytes. A structure-activity relationship study. Oncol Res 2003b; 13: 463–469
- Bobrowska-Hägerstrand M, Lillås M, Mrówczynska L, Wróbel A, Shirataki Y, Motohashi N, Hägerstrand H. Resveratrol oligomers are potent MRP1 transport inhibitors. Anticancer Res 2006; 26: 2081–2084
- Borst P, Elferink RO. Mammalian ABC transporters in health and disease. Annu Rev Biochem 2002; 71: 537–592
- Böhl M, Czupalla C, Tokalov SV, Hoflack B, Gutzeit HO. Identification of actin as quercetin-binding protein: an approach to identify target molecules for specific ligands. Anal Biochem 2005; 346: 295–299
- Campbell JD, Koike K, Moreau C, Sansom MS, Deeley RG, Cole SP. Molecular modeling correctly predicts the functional importance of Phe594 in transmembrane helix 11 of the multidrug resistance protein, MRP1 (ABCC1). J Biol Chem 2004; 279: 463–468
- Conseil G, Deeley RG, Cole SP. Functional importance of three basic residues clustered at the cytosolic interface of transmembrane helix 15 in the multidrug and organic anion transporter MRP1 (ABCC1). J Biol Chem 2006; 281: 43–50
- Cornish-Bowden, A. 2004. Fundamentals of enzyme kinetics. 3rd ed. London: Portland Press Ltd. pp 113–124.
- Deeley RG, Cole SP. Substrate recognition and transport by multidrug resistance protein 1 (ABCC1). FEBS Lett 2006; 580: 1103–1111
- Draper MP, Martell RL, Levy SB. Active efflux of the free acid form of the fluorescent dye 2′,7′-bis(2-carboxyethyl)-5(6)-carboxyfluorescein in multidrug-resistance-protein-overexpressing murine and human leukemia cells. Eur J Biochem 1997; 243: 219–224
- Ellman GL, Courtney KD, Andres VJ, Featherstone RM. A new and rapid colorimetric determination of acetylcholinesterase activity. Biochem Pharmacol 1961; 7: 88–95
- Feller N, Broxterman HJ, Waehrer DCR, Pinedo HM. ATPdependent efflux of calcein by the multidrug resistance protein (MRP): no inhibition by intracellular glutathione depletion. FEBS Lett 1995; 368: 385–388
- Fuller RR, Sweedler JV. Characterizing submicron vesicles with wavelength-resolved fluorescence in flow cytometry. Cytometry 1996; 25: 144–155
- Glavinas H, Krajcsi P, Cserepes J, Sarkadi B. The role of ABC transporters in drug resistance, metabolism and toxicity. Curr Drug Deliv 2004; 1: 27–42
- Haimeur A, Conseil G, Deeley RG, Cole SP. The MRP-related and BCRP/ABCG2 multidrug resistance proteins: biology, substrate specifity and regulation. Curr Drug Metab 2004; 5: 21–53
- Hipfner DR, Deeley RG, Cole SPC. Structural, mechanistic and clinical aspects of MRP1. Biochim Biophys Acta 1999a; 1461: 359–376
- Hipfner DR, Mao Q, Qiu W, Leslie EM, Gao M, Deeley RG, Cole SPC. Monoclonal antibodies that inhibit the transport function of the 190-kDa multidrug resistance protein, MRP. J Biol Chem 1999b; 274: 15420–15426
- Holló Z, Homolya L, Hegedus T, Sarkadi B. Transport properties of the multidrug resistance-associated protein (MRP) in human tumour cells. FEBS Lett 1996; 383: 99–104
- Homolya L, Holló Z, Germann UA, Pastan I, Gottesman MM, Sarkadi B. Fluorescent cellular indicators are extruded by the multidrug resistance protein. J Biol Chem 1993; 268: 21493–21496
- Jedlitschky G, Burchell B, Keppler D. The multidrug resistance protein 5 functions as an ATP-dependent export pump for cyclic nucleotides. J Biol Chem 2000; 275: 30069–30074
- Klokouzas A, Wu CP, van Veen HW, Barrand MA, Hladky SB. cGMP and glutathione-conjugate transport in human erythrocytes. Eur J Biochem 2003; 270: 3696–3708
- Klokouzas A, Barrand MA, Hladky SB. Effects of clotrimazole on transport mediated by multidrug resistance associated protein 1 (MRP1) in human erythrocytes and tumour cells. Eur J Biochem 2001; 268: 6569–6577
- Leslie EM, Deeley RG, Cole SPC. Toxicological relevance of the multidrug resistance protein 1, MRP1 (ABCC1) and related transporters. Toxicology 2001; 167: 3–1623
- Litman T, Druley TE, Stein WD, Bates SE. From MDR to MXR: new understanding of multidrug resistance systems, their properties and clinical significance. Cell Mol Life Sci 2001; 58: 931–959
- Loe DW, Deeley RG, Cole SPC. Verapamil stimulates glutathione transport by the 190-kDa multidrug resistance protein 1 (MRP1). J Pharmacol Exp Ther 2000; 293: 530–538
- Lowry OH, Rosebrough NJ, Farr AL, Randall RJ. Protein measurement with the Folin phenol reagent. J Biol Chem 1961; 193: 265–275
- McAleer MA, Breen MA, White NL, Matthews N. pABC11 (also known as MOAT-C and MRP5), a member of the ABC family of proteins, has anion transporter activity but does not confer multidrug resistance when overexpressed in human embryonic kidney 293 cells. J Biol Chem 1999; 274: 23541–23548
- Pozharski EV, MacDonald RC. Analysis of the structure and composition of individual lipoplex particles by flow fluorometry. Anal Biochem 2005; 341: 230–240
- Pulaski L, Jedlitschky G, Leier I, Buchholz U, Keppler D. Identification of the multidrug-resistance protein (MRP) as the gluthathione-S-conjugate export pump of erythrocytes. Eur J Biochem 1996; 241: 644–648
- Rychlik B, Balcerczyk A, Klimczak A, Bartosz G. The role of multidrug resistance protein 1 (MRP1) in transport of fluorescent anions across the human erythrocyte membrane. J Membrane Biol 2003; 193: 79–90
- Steck TL, Kant JA. Preparation of impermeable ghosts and inside-out vesicles from human erythrocyte membranes. Methods Enzymol 1974; 31: 172–180
- Tabas LB, Dantzig AH. A high-throughput assay for measurement of multidrug resistance protein-mediated transport of leukotriene C4 into membrane vesicles. Anal Biochem 2002; 310: 61–66
- Wu C-P, Calcagno AM, Hladky SB, Ambudkar SV, Barrand MA. Modulatory effects of plant phenols on human multidrug-resistance proteins 1, 4 and 5 (ABCC1, 4 and 5). FEBS J 2005; 272: 4725–4740