Abstract
The major facilitator superfamily (MFS) of transporters represents the largest family of secondary active transporters and has a diverse range of substrates. With structural information for four MFS transporters, we can see a strong structural commonality suggesting, as predicted, a common architecture for MFS transporters. The rate for crystal structure determination of MFS transporters is slow, making modeling of both prokaryotic and eukaryotic transporters more enticing. In this review, models of eukaryotic transporters Glut1, G6PT, OCT1, OCT2 and Pho84, based on the crystal structures of the prokaryotic GlpT, based on the crystal structure of LacY are discussed. The techniques used to generate the different models are compared. In addition, the validity of these models and the strategy of using prokaryotic crystal structures to model eukaryotic proteins are discussed. For comparison, E. coli GlpT was modeled based on the E. coli LacY structure and compared to the crystal structure of GlpT demonstrating that experimental evidence is essential for accurate modeling of membrane proteins.
Overview of MFS transporter structures
The major facilitator superfamily (MFS) of transporters represents the largest secondary active transporter family, with over 2000 sequenced members identified (Chang et al. Citation2004). They are present in all species from bacteria to eukaryotes. MFS transporters typically posses 400–600 amino acid residues and the majority are predicted to have 12 transmembrane α-helical segments, although several with 14 and one with 24 TMS have been identified (Wood et al. Citation2002). Rigorous sequence alignments and transmembrane predictions were used to assign family members and evolutionary relatedness (Chang et al. Citation2004). Members of the same family of transporters are predicted to have similar structure and function.
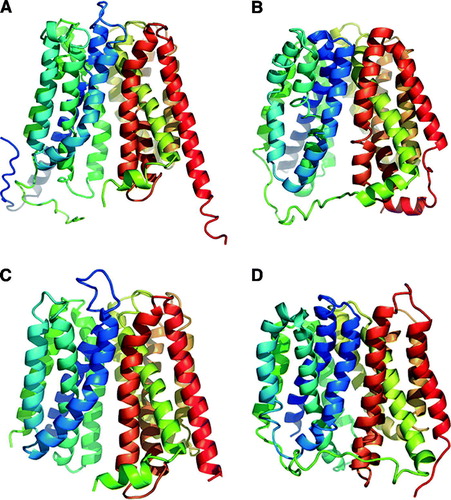
Structural information exists for four members of MFS. For a visual comparison, depicts all four structures. The E. coli glycerol-3-phosphate transporter, (GlpT, TC 2.A.1.4.3) has been solved using X-ray crystallography to 3.3 Å (A) (Huang et al. Citation2003). This antiporter exchanges glycerol-3-phosphate (G3P) for an inorganic phosphate molecule. The E. coli lactose permease (LacY, TC 2.A.1.5.1) has been solved using X-ray crystallography to a resolution of 3.5 Å (B) (Abramson et al. Citation2003). LacY is a symporter co-transporting a lactose molecule with a proton. In addition, a projection map to a resolution of 3.4 Å and subsequently a three-dimensional model to a resolution of 6.5 Å of the oxalate:formate antiporter (OxlT, TC 2.A.1.11.1) from O. formigens was generated by cryo-electron microscropy (C) (Heymann et al. Citation2003, Hirai & Subramaniam Citation2004). Most recently, the E. coli multidrug efflux pump (EmrD, TC 2.A.1.2.9) has been solved using X-ray crystallography to a resolution of 3.5 Å (D) (Yin et al. Citation2006). This is a drug/H+ antiporter. The overall structures of the four MFS transporters are similar. All consist of 12 TMS, arranged with a similar topology as predicted from the sequence and topology analysis, strongly supporting a common structural architecture for the MFS transporters. The structural homology is more astounding considering the diverse range of substrates transported by this large superfamily. Interestingly the proteins GlpT, LacY and OxlT were crystallized in the cytoplasmic-facing orientation, while EmrD appears to be trapped in an intermediate conformation (Yin et al. Citation2006).
Figure 1. Ribbon representation of the crystal structure for MFS transporters. (A) E. coli GlpT. (B) E. coli LacY. (C) O. formigens OxlT. (D) E. coli EmrD.
Considering the abundance of MFS transporters, the proportion of structural information for this superfamily is low. Therefore modeling has been carried out based mostly on the GlpT structure. This structure and its models will be discussed below.
GlpT structure
The structure of GlpT has been discussed is detail elsewhere (Huang et al. Citation2003) but will be briefly summarized below. The overall architecture of the GlpT structure resembles a Mayan temple, with 12 α-helical TMS (A). There is pseudo-symmetry in the molecule, with two 6- α-helical bundles joining at the periplasmic end, resulting in an internal cavity exposed to the cytoplasm. The presence of two arginine residues in this pore results in a strong positive charge and constitutes the substrate binding site. These two 6-α-helical bundles are connected by a large cytoplasmic loop that was not clearly seen in the electron density map (Huang et al. Citation2003). The symmetry in the structure reflects an evolutionary gene duplication event (Chang et al. Citation2004).
Modeling eukaryotic MFS transporters
GlpT has been the predominant structure used to model a variety of both prokaryotic and eukaryotic transporters. Structural models for the prokaryotic transporters OxlT (TC 2.A.1.11.1) (Hirai & Subramaniam Citation2004, Yang et al. Citation2005) and ProP (TC 2.A.1.6.4), a H + /osmoprotectant symporter were both based on the GlpT structure. A model of the MFS MdfA (TC 2.A.1.2.19), an E. coli multidrug transporter, was based on both the GlpT and LacY crystal structures. In addition, various eukaryotic transporters have been modeled. This review will focus only on the eukaryotic transporters modeled with the GlpT and LacY crystal structures. For comparison, GlpT will be modeled based on the LacY crystal structure. Methods used to generate the individual models will be compared. The agreement of these structural models with their biochemical data will also be discussed, as will the validity of using GlpT to model MFS transporters.
Human hexose facilitator (Glut1) model
Glut transporters are responsible for sugar uptake in cells. Although various isoforms exist (Glut1-9) and are expressed in a tissue dependant manner, Glut1 is expressed ubiquitously. Glut1 (TC. 2.A.1.1.28) is one of the more well-characterized transporters biochemically. Ample affinity labeling, mutagenesis, and kinetic studies have been carried out on Glut1 (Hruz & Mueckler Citation2001). Heterozygous mutations in Glut1 essential for transport function can leads to infantile seizures, acquired microcephaly, and developmental delay (Wang et al. Citation2000). In addition, many other residues have been identified as crucial for transport function (see below).
A model of Glut1 was generated based on the GlpT structure (Salas-Burgos et al. Citation2004). Although other Glut1 models have been generated in the past, this is the first one based on an MFS structure. Two models were initially generated, Glut1A and Glut1B. Glut1A was carried out with the crystal structure of E. coli GlpT (A) (Huang et al. Citation2003); similarly, Glut1B was modeled with the structure of E. coli LacY (Abramson et al. Citation2003). The Glut1A model, based on the GlpT structure, had less gaps in helical segments compared to that based on the LacY structure (Salas-Burgos et al. Citation2004). Because of this and the fact that BLAST searches in the protein mammalian database suggested a closer evolutionary relationship with GlpT but not LacY, only the model based on the GlpT structure was used for analysis.
For details of the Glut1 modeling see (Salas-Burgos et al. Citation2004). Briefly, the alignments were done with ClustalW (Higgins et al. Citation1994) with BLOSUM62 matrix (Henikoff & Henikoff Citation1992). Residues experimentally determined to be in loops were used as constraints. The homology modeling was done with Nest, a program included in the JACKAL suite (Xiang & Honig Citation2001) and refinement was done with MODELLER (Fiser & Sali Citation2003). Models were validated with PROCHECK (Laskowski et al. Citation1993) and WHATCHECK (Hooft et al. Citation1996). For the correct assignments of residues to transmembrane helices 1 and 2, evolutionary modeling was used. The templates (Swiss-Prot No. P08194) were aligned with a homologous protein obtained by searching with PSI-BLAST (Altschul et al. Citation1997), namely the human glucose 6-phosphate translocase (Swiss-Prot No. O43826). Molecular dynamic simulations using the force-field GROMOS43a (van Gunsteren et al. Citation1996) were carried out to analyse the model for substrate and inhibitor docking. For a summary of the modeling methods, see .
Table I. Summary of the different programs used to enforce constraints, modeling and refinement for eukaryotic MFS models based on crystal structures of prokaryotic GlpT or LacY.
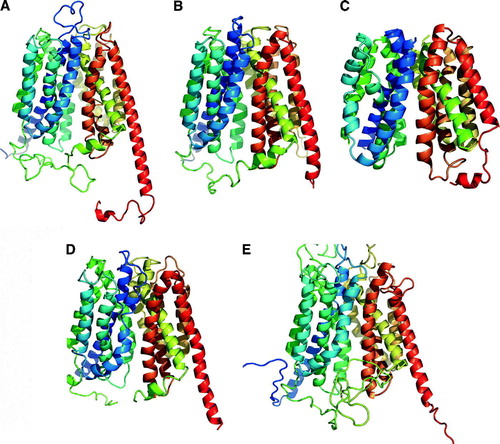
The model of Glut1 has 12 transmembrane α-helical segments that can be viewed as two 6-α-helical bundles and a central cavity (A). The modeled Glut1 is consistent with mutagenesis data identifying residues crucial for pathogenicity and transport function that line the central cavity. These include Ser66, Gly91, Arg125, Glu146, Glu247, Lys256, Thr310, and Arg333. This cavity is funnel-like in shape and is lined with both hydrophobic and hydrophilic residues important for sugar transport. The putative recognition site for substrates, the QLS motif, is located at the extracellular end of the funnel. Docking studies have revealed the substrate glucose, and inhibitors forskolin and phloretin bind at an exofacial site. Interestingly, the inhibitor Cytoclasin B (CytB) was found at the intracellular side of the transport channel as expected but at a site different than predicted by experimental evidence. This suggests either misinterpretation of the experimental evidence or an error in the model. Using residues identified experimentally to be located in loops as constraints can be risky as transporters are thought to exist in multiple conformations and some residues may be differentially exposed during each stage of the transport cycle leading to erroneous residue placement. The authors suggest more study is needed to clarify the CytB binding site. Overall, the Glut1 model is consistent with the ample biochemical, physiological and mutagenesis evidence.
Figure 2. Ribbon representation for models of eukaryotic MFS transporters. (A) Human Glut1. E. coli GlpT. (B) human G6PT. (C) Rat OCT1. (D) Rabbit OCT2. (E) S. cerevisiae Pho84. For a comparison with the structure of GlpT, see A.
Human glucose-6-phosphate transporter (G6PT) model
Eukaryotic glucose-6-phosphate transporters (G6PT) (TC.2.A.1.4.5) are responsible for uptake of G6P in the endoplasmic reticulum to provide a substrate for the enzyme glucose-6-phosphatase resulting in glucose becoming available for export to the cytoplasmic compartment. Deficiencies in human G6PT (hG6PT) result in glycogen storage disease type Ib characterized by hepatomegaly and osteoporosis, among other disorders (McKusick Citation1998). G6PT belongs to the organophosphate:phosphate antiporter (OPA) family of MFS transporters, which also include GlpT and UhpT, the E. coli G6PT. There is a high degree of sequence similarity between hG6PT and GlpT, 54% (), suggesting it was a good candidate for modeling.
Table II. Reported sequence identities and sequence similarities of modeled eukaryotic MFS transporter proteins with GlpT sequence *Modeled using LacY. #Not reported in publication. Sequence identity and similarity calculations were carried out using EMBOSS Pairwise Alignment Algorithms with an open gap penalty 10, a gap extension penalty of 0.2 and BLOSUM62 matrix.
Details on the modeling of the hG6PT can be found in Almqvist et al. Citation2004. Briefly, sequences from human G6PT were aligned with mouse G6PT, Bacillus subtilis GlpT, E. coli GlpT, E. coli UhpT and Salmonella typhimurium UhpT using T-COFFEE (Notredame et al. Citation2000). Topology predictions, obtained using seven different topology prediction programs, and N- and C-termini constraints were used to increase the accuracy of the predictions. Models were generated using MODELLER (Fiser & Sali Citation2003). Final selection was based on those with the lowest objective function from MODELLER and structural validity was confirmed with VERFY-3D (Eisenberg et al. Citation1997), PROCHECK (Laskowski et al. Citation1993) and WHAT-IF (Vriend Citation1990). The model of G6PT has 12-transmembrane α-helical segments (B).
The validity of the structural model based on the GlpT structure was also confirmed with existing mutagenesis data. Thirty mutations associated with glycogen storage disease Type Ib were mapped onto the hG6PT structure (Almqvist et al. Citation2004). The majority of these mutations abolished protein function while the remainder has residual 2% to 25% activity. Twenty-eight missense and two deletion mutations were classified according to their location in the structure: For mutations mapped in the substrate translocation pore, experimental data confirms that these mutants express at normal levels as would be expected. Mutations at the N-/C-terminal domain interface according to the model are predicted to affect the curvature of the helices thereby affecting the rocker-switch mechanism necessary for function. Mutations in the interior of the N-/C- terminal domains and at the interface between protein and lipid membrane or cytoplasm are believed to affect protein stability. Indeed this is confirmed by previous experimental data. The loss of function for all mutations with the exception one (P119L) are readily explained by the G6PT model.
An alternate model was presented for G6PT based on experimentally determined surface loop topology (Pan et al. Citation1999). In this model, a 10-helix topology was predicted. To distinguish between the 12-helix or 10 helix topologies predicted by hydropathy, Flag-tag mutations were inserted into loops, however these mutants had lower transport activity suggesting possible misfolding. Pan and co-workers also carried out glycosylation mutations, G6PT-T53N and G6PT-S55N, to distinguish between the two models. Important to consider is that the glycosylation mutants were not assessed for folding or functional activity. As glycosylation can affect folding, it may be possible that the mutant proteins were not properly folded and therefore may have led to the prediction of a 10-helix model.
Rat organic cation transporter-1 (OCT1) and rabbit organic cation transporter 2 (OCT2)
The organic cation transporters (OCT) are responsible for excretion of various drug end-products. They play a critical role in detoxification and controlling nephrotoxicity. Although three isoforms exist, the primary transporters expressed are OCT1 (TC.2.A.19.1) in the liver (Popp et al. Citation2005) and OCT2 (TC.2.A.1.19.5) in the kidney (Zhang et al. Citation2005). Each isoform has unique substrate specificity. Structural information was sought in order to distinguish between this selectivity (Zhang et al. Citation2005).
Details for modeling of rat OCT1 can be found in the following reference: (Popp et al. Citation2005). Briefly, the model of rat OCT1 was based on the structure of LacY. It is not stated by the authors why LacY and not GlpT was used for modeling. Various OCTs were aligned with LacY using ClustalW (Higgins et al. Citation1994) or Bestfit. The model was generated by replacing amino acids on LacY with those from rat OCT1 using Quanta 2000 (Accelrys). Steric clashes were removed by rotomer selections and CHARMM (Accelrys). The model of OCT1 has 12-transmembrane α-helical segments (C). Not all loops connecting these segments were modeled. Along with the model, Popp et al. also carry out mutagenesis which, along with other mutagenesis studies, validates the structural model of rat OCT1.
Details for the modeling of rabbit OCT2 can be found in the reference (Zhang et al. Citation2005). Briefly, sequence based homology models and sequence-based structural models were sought with PSI-BLAST and 3D-PSSM respectively. Sequence alignment of GlpT was performed with rabbit orthologs for OCT1 and OCT2 where conserved MFS motifs were used as constraints. Loops were edited out of the sequence to facilitate modeling. Modeling was carried out with ICM 3.0 (MolSoft, La Jolla CA) and refined with SYBYL (Tripos, Inc., St. Louis, MO). PROCHECK (Laskowski et al. Citation1993), WHATIF (Vriend Citation1990) and PROVE (Pontius et al. Citation1996) as well as transmembrane helix prediction validated the predicted model. The model of OCT2 has 12-transmembrane α-helical segments (D). Zhang et al. have carried out mutagenesis on residues distinct between the OCT1 and OCT2 isoforms and their selectivity towards substrate interactions (Zhang et al. Citation2005). They identified a key residue, Glu447 that when mutated to Gln could switch substrate specificity of OCT2 to a more OCT1-like. In the 3D-model of rabbit OCT2, this key residue is located in the putative binding pocket. Further supporting this model were the binding site location of residues identified by other studies found to be important in influencing substrate binding, such as Trp 217, Tyr221 and Thr225 (Popp et al. Citation2005), Asp474 (Gorboulev et al. Citation1999), and Ile442 and Leu446 (Gorboulev et al. Citation2005). Asp474, a proposed substrate recognition residue, is located at an identical position to the substrate binding sites of GlpT and LacY.
Saccharomyces cerevisiae inorganic phosphate:proton symporter (Pho84)
Pho84 (TC.2.A.1.9.1) is an inorganic phosphate:proton symporter that plays a role in phosphate uptake when this ion is limited in the cell. It belongs to the MFS of transporters and is predicted to have 12 transmembrane segments (Lagerstedt et al. Citation2004).
Modeling for the S. cerevisiae Pho84 transporter was carried out as described in (Lagerstedt et al. Citation2004). Briefly, structural homologs were sought using the MetaServer (bioinfo.pl/meta/) (Ginalski et al. Citation2003), which encompasses various programs. GlpT was the highest scored structural homolog and was subsequently used in modeling with the program MODELLER (Fiser & Sali Citation2003). Because of the long N- and C-terminal extensions on Pho84 that are not present in the GlpT structure these domains were omitted from the modeling. The model encompassed sequence S52 to K546. Restraints from sequence alignments carried out with 3D-Jury (bioinfo.pl/meta/) were also used. The model was analysed using DeepView/SwissPDB viewer (www.expasy.org/spdbv) and InsightII. The model of Pho84 has 12-transmembrane α-helical segments (E)
Lagersted et al. carried out cysteine mutagenesis on two residues, proposed to be in the inner core (TM8) and outer fence (TM12) of the protein, which were then analyzed with EPR analysis. The obtained spectra indicate a tightly packed environment which is confirmed by the model. The authors plan to use further study of mutants in conjunction with EPR and NMR to improve the Pho84 transporter model.
Methods for eukaryotic modeling based on prokaryotic structures
As shown in , various strategies were used for constraints, modeling and model refinement. The greatest variation in strategy occurred in the constraints used to prepare for modeling. While all included sequence alignment strategies, some used both sequence-based and structural-based sequence alignments. In addition, in the case with Glut1 model, experimental data was also used. Of course, this depends on the amount of experimental information available to the research group. MODELLER was the predominant program used for modeling, in addition to Nest, Quanta 2000 and ICM 3.0. Refinement was carried out using MODELLER, as well as CHARM and SYBYL. In summary, there are a wide number of applications that can be used to carry out modeling for transporters, with MODELLER used most often.
Modeling of E. coli GlpT based on E. coli LacY crystal structure
As an exercise GlpT was modeled on the crystal structure of LacY (Unpublished work, M. J. Lemieux). No external experimental information was used in order to prevent the introduction of experimenter bias. Using MODELLER, a straightforward program for any experimenter to use, the full sequence for E. coli GlpT was aligned with the full sequence for E. coli LacY and modeled with 100 cycles. Structure validation was carried out with Procheck. When the GlpT model is overlaid with the crystal structure of GlpT (A), we see similar architectures. The Cα backbone r.m.s.d. for GlpT model and crystal structure alignment is 2.82 Å, with mainchain alignment r.m.s.d. of 2.75 Å (). As expected, the model GlpT structure is more similar to the LacY crystal structure with an r.m.s.d. of 0.58 Å2.
Figure 3. (A) Wall-eyed stereo image ribbon representation of the structural alignment between the GlpT crystal structure (green) and GlpT model (magenta) based on LacY crystal structure. (B) Wall-eyed stereo image of GlpT active site showing Arg 45 on transmembrane helix 1 and Arg269 on transmembrane helix 7 are in different locations on the GlpT crystal structure (green) and GlpT model (magenta) based on LacY crystal structure. Helices 2, 4 and 11 have been removed in order to visualize the Arg residues in the central cavity.
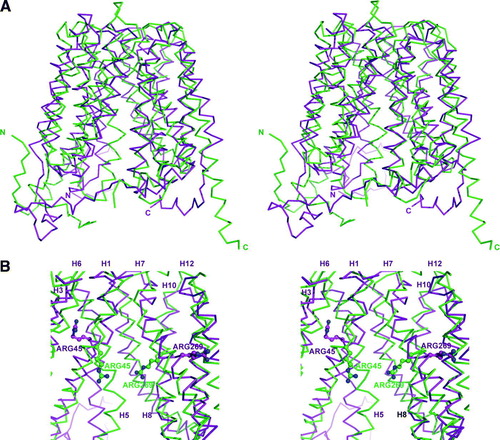
Table III. R.m.s.d. from structural-based Cα alignment using the program ALIGN (Cohen Citation1997). Numbers in parenthesis represent the Cα pairs in the alignment.*Modeled with LacY. $Alignment with all mainchain atoms with atom name match required.
Although the models overall architecture is correct, key residues in the active site are modeled incorrectly. The GlpT active site key residues Arg 45 and Arg 269 are on transmembrane (TM) helix 1 and on TM helix 7 respectively as found in the crystal structure (B). In the model, the Cα of Arg 45 is located approximately one half turn on the helix, 2 amino acid residues away, from its location on the crystal structure. Modeled Arg 269 is located one full turn away from its location in the crystal structure. As a result, the side chains for these key residues do not point into the central substrate recognition cavity, but towards the center to the six-TM helix bundles. Unless experimental evidence is taken into account, including using ample sequence alignments, the probability of key residues found in a transporter active site are low. This exercise clearly demonstrates that membrane protein modeling can result in an overall correct topology and architecture, however, experimental evidence is essential to improve upon the model. All eukaryotic MFS transporters modeled as described above incorporate ample biochemical data to foster validation of these models.
Validity of eukaryotic transport models based on prokaryotic transporter structures
Despite the low sequence identity among members of the major facilitator superfamily transporters (), the X-ray crystal structures of LacY and GlpT are structurally similar (), with an r.m.s.d. of 3.0 Å for Cα backbone alignment (). The sequence identity between GlpT and LacY is low, ranging from 12–19% (). The sequence similarity between GlpT and modeled G6PT is highest, 54%, which is not surprising as both belong to the OPA family in the MFS. Despite the low sequence agreement, we see, as expected, that the structural models are similar to the structure of GlpT, with r.m.s.d. for Cα backbone alignment ranging from 0.27 Å to 1.47 Å (). These models are also structurally similar to the LacY structure with r.m.s.d. values ranging from 2.7 Å to 3.0 Å. While varying amounts of mutagenesis and functional data exists for the five modeled transporters, we do see that the models are supported by experimental data available supporting the strategy of using prokaryotic structures to model eukaryotic homologs.
A comparison of all r.m.s.d. values for the models () reveals the Pho84 model is most similar to GlpT crystals structure, r.m.s.d. of 0.27 Å, with G6PT model a close second, r.m.s.d. of 1.0 Å. G6PT does have the highest sequence similarity with GlpT, 54%, however Pho84 is only 24.5%. Modeling for both Pho84 and G6PT were carried out with MODELLER. This may account for the closer structural similarity to the GlpT crystal structure. As the GlpT model was generated with the MODELLER program, we also see that the structural alignment of the GlpT model with the crystal LacY structure are very similar with an r.m.s.d of 0.58 Å even though the sequence similarity between GlpT and LacY is only 23.8% similar (). In addition, Metaserver sequence alignment was used with the Pho84 modeling and multiple topology and sequence based alignments were used for the G6PT modeling. This may have had an influence on the high agreement between these models and their target structure.
In order to evaluate the validity of the structural models, all pbds were subjected to WHATCHECK. lists the Z-score results, with positive numbers reflecting better than average and negative values less than average. Since the OxlT structure was determined using cryo-EM is was not validated. Z-scores of the 2nd generation packing quality which assess the packing environment for the individual residues are positive for the crystal structures with the exception of EmrD. All models display poor packing quality including the GlpT model. Z-scores for the Ramachandran plot appearance and chi-1/chi-2 rotamer normality are comparable between the crystal and modeled structures. The backbone conformation Z-scores from the models are lower, i.e., worse, in general compared to the X-ray structures. Notably, the backbone conformation is quite low for all structures which is typical for membrane protein structures evaluated with WHATCHECK.
Table IV. WHATCHECK assessment of X-ray and modeled transporter structures. Structure Z-scores, positive is better than average while negative is below average. *Modeled with LacY.
One of the caveats for assessing molecular modeling of the above transporters is that no X-ray or EM data has been generated for the protein(s) after modeling was carried out. Obviously, no true assessment on the validity of the models can be made until the identical crystal structure is known for comparison. In addition, programs to check the validity of structures use soluble protein qualities for comparison. As seen above, when a model was generated after the crystal structure is known, the overall backbone is seemingly correct, however key residues and residue sidechains are misplaced. The purpose of structural studies of these transporters, whether via modeling or crystallography, is to understand how they carry out their transport function, substrate specificity and transport regulation. As we have seen from the few crystal structures already solved, in order to understand these issues, the location of specific residues and their side chains is essential.
There are additional challenges for modeling eukaryotic proteins using prokaryotic protein structures. Eukaryotic sequences for many homologous proteins tend to be longer and more complex than their prokaryotic orthologs. As a result, the final models may not be as precise as the structural models in areas such as the N- and C-termini, but the overall structural features should hold up to further experimental testing. As more models or structural information for MFS transporters become available, the credibility of using prokaryotic crystal structures to model eukaryotic homologs will be either strengthened or weakened. On the other hand, crystallographic studies of transporters can take years with no guarantee of success of a structure.
Modeling provides a means to provide a framework to examine experimental data where no crystal structure exists. Although many programs exist, no one stands out as superior. More importantly, experimental data, including careful sequence alignments, must be used to improve upon the model and assist the experimenter in studying transporter specificity and regulation. This review summarizes five cases of eukaryotic transporter modeling based on prokaryotic structures and hopefully provides inspiration for more structural models in the future.
Acknowledgements
I would like to thank the following for graciously making the coordinates of the following proteins available: Dr S. Subramaniam for OxlT, Dr D. N. Wang for human G6PT, Dr H. Koepsell for rat OCT1, Dr S. H. Wright for rabbit OCT2 and Drs B.L. Persson and J.O. Lagerstedt for Pho84. M. J. Lemieux is supported by fellowship scholarships from CHIR, CIHR strategic training program for membrane proteins and cardiovascular disease, and Alberta Heritage Foundation for Medical Research.
Related Research Data
References
- Abramson J, Smirnova I, Kasho V, Verner G, Kaback HR, Iwata S. Structure and mechanism of the lactose permease of Escherichia coli. Science 2003; 301(5633)610–615
- Almqvist J, Huang Y, Hovmoller S, Wang DN. Homology modeling of the human microsomal glucose 6-phosphate transporter explains the mutations that cause the glycogen storage disease type Ib. Biochemistry 2004; 43: 9289–9297
- Altschul SF, Madden TL, Schaffer AA, Zhang J, Zhang Z, Miller W, Lipman DJ. Gapped BLAST and PSI-BLAST: a new generation of protein database search programs. Nucleic Acids Res 1997; 25: 3389–3402
- Chang AB, Lin R, Keith Studley W, Tran CV, Saier MH, Jr. Phylogeny as a guide to structure and function of membrane transport proteins. Mol Membr Biol 2004; 21: 171–181
- Cohen GH. ALIGN: a program to superimpose protein coordinates, accounting for insertions and deletions. J Appl Cryst 1997; 30: 1160–1161
- Eisenberg D, Luthy R, Bowie JU. VERIFY3D: assessment of protein models with three-dimensional profiles. Methods Enzymol 1997; 277: 396–404
- Fiser A, Sali A. Modeller: generation and refinement of homology-based protein structure models. Methods Enzymol 2003; 374: 461–491
- Ginalski K, Elofsson A, Fischer D, Rychlewski L. 3D-Jury: a simple approach to improve protein structure predictions. Bioinformatics 2003; 19: 1015–1018
- Gorboulev V, Shatskaya N, Volk C, Koepsell H. Subtype-specific affinity for corticosterone of rat organic cation transporters rOCT1 and rOCT2 depends on three amino acids within the substrate binding region. Mol Pharmacol 2005; 67: 1612–1619
- Gorboulev V, Volk C, Arndt P, Akhoundova A, Koepsell H. Selectivity of the polyspecific cation transporter rOCT1 is changed by mutation of aspartate 475 to glutamate. Mol Pharmacol 1999; 56: 1254–1261
- Henikoff S, Henikoff JG. Amino acid substitution matrices from protein blocks. Proc Natl Acad Sci USA 1992; 89: 10915–10919
- Heymann JA, Hirai T, Shi D, Subramaniam S. Projection structure of the bacterial oxalate transporter OxlT at 3.4A resolution. J Struct Biol 2003; 144: 320–326
- Higgins D, Thompson J, Gibson T, Thompson JD, Higgins DG, Gibson TJ. CLUSTAL W: improving the sensitivity of progressive multiple sequence alignment through sequence weighting,position-specific gap penalties and weight matrix choice. Nucleic Acids Res 1994; 22: 4673–4680
- Hirai T, Subramaniam S. Structure and transport mechanism of the bacterial oxalate transporter OxlT. Biophys J 2004; 87: 3600–3607
- Hooft RWW, Vriend G, Sander C, Abola EE. Errors in protein structures. Nature 1996; 381: 272
- Hruz PW, Mueckler MM. Structural analysis of the GLUT1 facilitative glucose transporter (review). Mol Membr Biol 2001; 18: 183–193
- Huang Y, Lemieux MJ, Song J, Auer M, Wang DN. Structure and mechanism of the glycerol-3-phosphate transporter from Escherichia coli. Science 2003; 301(5633)616–620
- Lagerstedt JO, Voss JC, Wieslander A, Persson BL. Structural modeling of dual-affinity purified Pho84 phosphate transporter. FEBS Lett 2004; 578: 262–268
- Laskowski RA, MacArthur MW, Moss DS, Thornton JM. PROCHECK: a program to check the stereochemical quality of protein structures. J Appl Cryst 1993; 26: 283–291
- McKusick V. Mendelian inheritance in man: A catalog of human genes and genetic disorders. Johns Hopkins University Press, Baltimore, MD 1998
- Notredame C, Higgins DG, Heringa J. T-Coffee: A novel method for fast and accurate multiple sequence alignment. J Mol Biol 2000; 302: 205–217
- Pan CJ, Lin B, Chou JY. Transmembrane topology of human glucose 6-phosphate transporter. J Biol Chem 1999; 274: 13865–13869
- Pontius J, Richelle J, Wodak SJ. Deviations from standard atomic volumes as a quality measure for protein crystal structures. J Mol Biol 1996; 264: 121–136
- Popp C, Gorboulev V, Muller TD, Gorbunov D, Shatskaya N, Koepsell H. Amino acids critical for substrate affinity of rat organic cation transporter 1 line the substrate binding region in a model derived from the tertiary structure of lactose permease. Mol Pharmacol 2005; 67: 1600–1611
- Salas-Burgos A, Iserovich P, Zuniga F, Vera JC, Fischbarg J. Predicting the three-dimensional structure of the human facilitative glucose transporter glut1 by a novel evolutionary homology strategy: insights on the molecular mechanism of substrate migration, and binding sites for glucose and inhibitory molecules. Biophys J 2004; 87: 2990–2999
- van Gunsteren, WF, Kruger, P, Billeter, SR, Mark, AE, Eising, AA, Scott, WRP, Huneberger, PH, Tironi, IG. 1996. Biomolecular simulation: the GROMOS96 manual and user guide. BiomosrHochschulverlag AG an der ETH Zurich, Switzerland.
- Vriend G. WHAT IF: A molecular modeling and drug design program. J Mol Graph 1990; 8: 52–56
- Wang D, Kranz-Eble P, De Vivo DC. Mutational analysis of GLUT1 (SLC2A1) in Glut-1 deficiency syndrome. Hum Mutat 2000; 16: 224–231
- Wood NJ, Alizadeh T, Richardson DJ, Ferguson SJ, Moir JW. Two domains of a dual-function NarK protein are required for nitrate uptake, the first step of denitrification in Paracoccus pantotrophus. Mol Microbiol 2002; 44: 157–170
- Xiang Z, Honig B. Extending the accuracy limits of prediction for side-chain conformations. J Mol Biol 2001; 311: 421–430
- Yang Q, Wang X, Ye L, Mentrikoski M, Mohammadi E, Kim YM, Maloney PC. Experimental tests of a homology model for OxlT, the oxalate transporter of Oxalobacter formigenes. Proc Natl Acad Sci USA 2005; 102: 8513–8518
- Yin Y, He X, Szewczyk P, Nguyen T, Chang G. Structure of the multidrug transporter EmrD from Escherichia coli. Science 2006; 312(5774)741–744
- Zhang X, Shirahatti NV, Mahadevan D, Wright SH. A conserved glutamate residue in transmembrane helix 10 influences substrate specificity of rabbit OCT2 (SLC22A2). J Biol Chem 2005; 280: 34813–34822