Abstract
Mediation of synchronous cell-cell interactions by NCAM and PSA-NCAM is examined here in aggregates (monolayers) of C6 polysialylated embryonic neural cells, formed rapidly (within 30 s) in suspension in an ultrasound trap. These cells express all three main isoforms of neural cell adhesion molecule (NCAM). The rate of extension of perimeter contact (i.e., membrane spreading) between closely adjacent cells and the temporal reinforcement of the Filamentous (F)-actin cytoskeleton at those regions were measured. Enzymatic removal of the cell-cell repelling polysialic acid (PSA) increases the rate of NCAM-induced membrane spreading, while removal of NCAM-120 had no detectable effect. Competitive peptide inhibition of the third immunoglobulin domain of NCAM significantly reduced the rate of membrane spreading, while NCAM siRNA transfected cells lost their ability to spread. It is argued that NCAM induced contact is the initial requirement for membrane spreading and facilitates conditions for subsequent cytoskeletal reorganization in these neural cells.
Introduction
The neural cell adhesion molecule (NCAM) has a fundamental role in the development of the nervous system mediating adhesion between neural cells, such as axon-axon interactions Citation[1] and is a regulator of neurite outgrowth and fasciculation Citation[2], cell motility Citation[3], synaptic plasticity, including processes such as learning and memory consolidation Citation[4], Citation[5] and intracellular signalling Citation[6].
NCAM mediates both homophilic (NCAM-NCAM) and heterophilic interactions. Homophilic interactions affect cell-cell adhesion through developmental changes in the number of homophilic bonds between NCAM molecules on apposing membranes. These interactions are modulated by the polysialic acid (PSA) content of NCAM Citation[7], Citation[8]. Heterophilic interactions involve the interaction of NCAM with extracellular matrix components Citation[9], L1, CD24 as well as integrins Citation[10].
The carbohydrate polysialic acid component of NCAM (PSA-NCAM) that is highly expressed in developmental and neural tissues modulates cell-cell and cell-substrate interactions Citation[9]. The molecular mechanism by which PSA exercises this function remains an open question Citation[11]. There is general agreement that the main influence of PSA on cell-cell interactions is a non-specific contribution to the physical chemical repulsive barrier at the cell surface Citation[12], Citation[13]. This repulsion combines an electrostatic component Citation[14] and a simple steric mechanism Citation[15], by which expression of PSA at the cell surface can hinder membrane-membrane and NCAM receptor-receptor apposition Citation[16]. A more general role as a negative regulator of cell interactions (not only those mediated by NCAM) has been attributed to PSA Citation[17], Citation[18].
A number of assays have been explored to identify the role of NCAM and PSA-NCAM as regulators of cell-cell interactions. In classical studies chick embryonic membrane vesicles Citation[19] and intact F11 cells in suspension Citation[8] assayed in a 20 ml rotating suspension (90 rpm) at intervals over 15 min showed increased ‘aggregation rate’ following digestion with an α-2,8 polysialic acid cleaving endoneuraminidase. The total number of vesicles and vesicle aggregates was monitored with a Coulter Counter and an aggregation rate established from the change in this number with time. Pizzey et al. Citation[20] applied a less hydrodynamically stressful and more sensitive assay to aggregate formation by L cell NCAM mutants formed by transfection with cDNA that were suspended in 15 µl microwell. This technique was applied subsequently to the study of aggregation when it was shown that the rotation technique could not differentiate between NCAM transformants and control cells Citation[21] and to the study of peptide inhibition of hippoccampal neuron adhesion Citation[22]. Immunofluorescence monitoring of the temporal progression of the molecular consequences of cell-cell aggregation, that has often been applied to cells on substrata, does not appear to have been applied to cells aggregating in suspension possibly because the incubation periods involved (t ≥ 15 min) do not provide well synchronized aggregates.
Johnson et al. Citation[18] exploited a surface force apparatus and fluorescence correlation spectroscopy to provide direct evidence that NCAM polysialylation increases membrane repulsion and abrogates adhesion. They showed that the increase in the intermembrane repulsion following NCAM polysialylation was sufficient to overwhelm both homophilic NCAM as well as homophilic cadherin attraction.
The recent development of an ultrasound standing wave trap (USWT) (see Supplementary data i,ii – online version only) that rapidly and synchronously forms 2-D particle or cell aggregates in a low-stress small-volume suspension in the focal plane of a light microscope Citation[23], Citation[24] has enabled cell adhesion to be quantified by the rate of membrane contact spreading at cell perimeters Citation[25], fractal dimension and void analysis Citation[26]. Subsequent immunofluorescent staining of aggregates removed from the trap showed progressive F-actin and N-cadherin accumulation at sites of cell-cell contact Citation[25] as well as gap junctional communication between cells Citation[27].
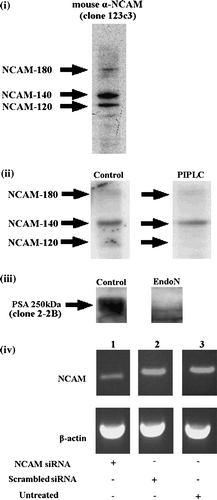
Figure 1. Western blot analysis of (i) the NCAM profile of control neural cells; all three isoforms of NCAM (-120, -140, -180) are expressed by neural cells; (ii) PIPLC-treated neural cells; 70% of NCAM-120 is removed. (iii) EndoN-treated cells; embryonic neural cells are highly sialylated (PSA was detected at 250 kDa), while enzymatic digestion resulted in complete removal of PSA from NCAM. (iv) PCR analysis at 48 h post transfection of NCAM siRNA transfected cells (lane 1), cells transfected with scrambled oligos (lane 2) and untreated cells (lane 3) (n=3). β-actin was used for normalization. Data are representative of 2 or 3 independent experiments.
The USWT is an ultrasound resonator where the acoustic pathlength in the cell suspension is a single half wavelength. The resonator has a pressure node plane half way through the cell suspension and parallel to the transducer (see Supplementary data ia). The cell trap exploits the fact that particles in general experience an axial direct acoustic radiation force when in an ultrasound standing wave field. This force drives them towards a node plane (Supplementary data ib). They then move, within that plane, to accumulate at the centre of the field (Supplementary data ic). This in-plane movement arises because variations in the pressure distribution within the node plane give rise to a weak lateral radiation force (DRFl) and because cells are convected by acoustic streaming Citation[23–25].
The resulting 2-D aggregate provides good resolution capability for optical examination of cells in situ in the trap and in the immununofluorescence characterization on aggregate removal from the trap. The above developments in cell manipulation as well as in molecular techniques (for example siRNA for the targeted silencing of the gene of interest as well as the use of peptides specifically designed to inhibit the action of membrane receptors without the significant steric effects imposed by use of antibodies) make it timely to revisit cellular systems and refine some understandings of NCAM and PSA-NCAM modulation of cell-cell adhesion.
In the present study, we aim to examine the influence of NCAM and PSA-NCAM on cell-cell adhesion and perimeter membrane contact spreading in adhering neural cell monolayers in suspension in an ultrasound trap.
Materials and methods
Culture of 921202-6 (Clone 6 (C6)) neural cells
All reagents were from Sigma (UK) unless otherwise stated. The conditionally immortalized neural cell line (derived from embryonic rat mesencephalon) was maintained as a replicative culture at 33°C/5% CO2 in neuronal supplemented medium (NSM) and supplemented with 5 ng/ml fibroblast growth factor (FGF-2), as previously described Citation[25].
Phosphatidyl-inositol-specific phospholipase C (PIPLC) and Endoneuraminidase (EndoN) treatment
Neural cells were prepared as described above and diluted to 3×10⁶/ml. Cells were suspended in NSM containing 2 U/ml of phosphatidyl-inositol-specific phospholipase C (PIPLC) Citation[2] or 20 U/ml of Endoneuraminidase (EndoN, AbCys S. A., Paris, France) Citation[28], and incubated for 1 and 2 h respectively at 33°C/5% CO2. Cells were then pelleted by centrifugation (5 min, 28 g) and suspended in NSM at the same concentration prior to introduction into the ultrasound trap.
Western blot analysis
Cells suspended in NSM or treated with NSM containing 2 U/ml PIPLC or NSM containing 20 U/ml EndoN, were lysed in boiling extraction buffer (10 mM tris (pH 7.4), 1% SDS, 1 mM sodium orthovanate) and protein concentrations determined using a BCA™ protein assay kit (Pierce, Rockford, IL, USA). Equal amounts of protein (20 µg) from three independent experiments were separated on a 7.5% SDS-PAGE gel and Western blotting performed as described previously Citation[29] using a monoclonal anti-NCAM antibody that recognizes all three NCAM isoforms (clone 123c3, (1:100), Abcam, UK) or a monoclonal anti-PSA-NCAM antibody (clone 2-2B, (1:500), Chemicon, UK), which only recognizes PSA attached to NCAM, and not NCAM alone.
Peptide inhibition of NCAM
Neural cells were prepared as described earlier and resuspended in NSM containing 0.2, 0.5, 1, 3 or 5 mg/ml of the 21 amino acid peptide KHIFSDDSSELTIRNVDKNDE (resuspended in PBS) (Severn Biotech Ltd., UK) corresponding to the homophilic binding site of the Ig3 domain of NCAM between Lys-243 and Glu-263 Citation[21]. A suspension of NSM with PBS, or NSM with an equivalent concentration of the peptide KYSFNYDGSELIIKKVDKSDE (Severn Biotech Ltd., UK), a chicken homologue of the inhibitory peptide described above (the sequence homology between the rat and chicken peptides is 52%) were used as negative controls to confirm the peptide-specific inhibition of NCAM.
siRNA treatment of cells
Neural cells were plated on a 24-well plate at a concentration of 25×104 cells per well in 1 ml of NSM media. Cells were incubated overnight at 33°C/5% CO2 to allow cells to reach confluence. Cells were incubated with either 25 ng of NCAM siRNA (Santa Cruz Biotechnology, Inc) specifically designed to knock out all three isoforms of NCAM, or an unrelated scrambled siRNA (5′-UAAUGUAUUGGAACGCAUATT-3′). Transfections were performed according to the manufacture's protocol (INTERFERin™ siRNA transfection reagent; Autogen Bioclear, UK). For experiments in the trap, cells were plated in a 75 cm2 flask at a concentration of 106/ml and treated with 175 ng of NCAM siRNA.
Confirmation of NCAM knock down: RNA extraction and RT-PCR
Cells were lysed into 1 ml Trizol® reagent (Invitrogen, UK) at 24, 48 and 72 h post-transfection. Total RNA was extracted with chloroform and precipitated overnight with isopropanol as previously described Citation[29]. cDNA was produced using 0.5 µg/µl oligo (dT)15 (Promega, UK) as previously described Citation[29]. Abolition of NCAM mRNA was assessed, by PCR, using primers specifically designed against exons 9–11 of the rat sequence, which are present in all 3 NCAM isoform transcripts (S 5′-TAGATGGGCACATGGTGGTA-3′ and AS 5′-GGGTAGGCAAAGACCTCACA-3′, 0.27 µM each, annealing temperature 58°C, 232 bp product). 25 cycles were carried out in a Techne TC-312 thermal cycler (PCR analysis determined that 25 cycles was within the logarithmic phase of amplification for both genes). Amplified products were analysed on 2% agarose gels with a 100–1000 bp DNA ladder for size identification. Amplification of the housekeeping gene β-actin was used for normalization using previously published primer sequences Citation[30].
Ultrasound trap
The ultrasound trap employed in the present work had four layers; a piezoceramic ultrasound transducer (Ferroperm, Kvistgard, Denmark) in a housing of radial symmetry, a steel layer coupling the ultrasound to a one half wavelength (λ/2 or 0.5 mm depth, where λ is the wavelength of sound in water), an aqueous layer and a reflector that provided optical access from above (Supplementary data ii) (we note that the acoustic frequency (f) is given by the formula f = c/λ, where c is the speed of sound in water). The constant transducer drive voltage came from a function generator (HM 8138, HAMEG, Germany). The ultrasound trap has been previously described in detail Citation[25], Citation[31], Citation[32]. The sound pressure amplitude (P0) was 0.54 MPa (corresponding to 20 Vp-p) for the first 30 s of ultrasound initiation and subsequently reduced to 0.27 MPa (i.e., 10 Vp-p) for 30 s and 0.06 MPa (i.e., 2.2 Vp-p, the level at which the acoustic radiation force just balanced the gravitational force on the aggregate and thus maintained the aggregate in suspension) for the remaining 29 min of aggregate levitation in the trap Citation[27].
Optical system
A fast, high-resolution CCD F-view II camera (12-bit depth) (Soft Imaging System, SIS, GmbH) mounted on an Olympus BX41M reflection epi-microscope allowed observation in the direction of sound propagation (negative z-axis) (Supplementary data ii). Images were captured by a standard PC equipped with the Cell-P image acquisition and processing software (Soft Imaging System, SIS, GmbH).
Immunofluorescence
Cells subjected to EndoN, NCAM blocking peptide or NCAM siRNA treatments as well as control, untreated cells were levitated in the trap for 1, 3, 7, 10 or 30 min. Cells subjected to PIPLC treatment were levitated in the trap for 1 or 30 min, whereas those pre-treated with 0.5, 1, 3 or 5 mg/ml of peptide were levitated in the trap for only 30 min. Fixation and immunostaining of the aggregates was performed as previously described Citation[25]. Cells were dual-labeled for F-actin (2 U/ml, Phalloidin-Alexa 488 conjugate; Invitrogen, UK) and NCAM (1:1000, AbCAM, UK) or PSA-NCAM (1:200, Chemicon, UK). The secondary antibody used was Alexa 594 conjugated anti-mouse IgG (5 µg/ml, Invitrogen, UK). Immunolabelling of non-sonicated neural cells subjected to all of the above treatments was performed on cells (106 cells/ml) retained for 1, 3, 7, 10 or 30 min in suspension. A 100 µl cell suspension aliquot was placed on a Histobond slide, fixed and double stained for F-actin and NCAM or PSA-NCAM as described above.
Measurements of membrane spreading
Estimates of the angle θ subtended by the F-actin staining region at the centres of a pair of interacting cells were measured as previously described Citation[33]. A detailed description and a Figure (Supplementary data iii) illustrating how the angle θ is determined is given in the Supplementary data (online version only).
Statistical analysis
The data presented here are shown as mean±standard error, whereas those of the angle θ are presented as mean±standard deviation, unless otherwise stated. Each experiment was repeated three times and representative data are presented. Analysis of means was performed with a two-tailed two sample t-test (Minitab 13.0). Differences were considered significant at p values less than 0.05.
Results
NCAM profile of neural cells
Control (NSM-suspended) neural cells express all three isoforms of NCAM (NCAM-120, -140, -180) (i); their relative ratios are shown in . NCAM-140 is predominantly present (50%), while NCAM-180 and NCAM-120 are less abundant (at percentages of 30% and 20% respectively) (). PIPLC treatment on the other hand resulted in a 70% removal of NCAM-120 as quantified from densitometric analysis of the Western blot. As expected, the relative ratios of the NCAM-140 and NCAM-180 isoforms were essentially unchanged (ii; ). Treatment of cells with 2 U/ml of EndoN resulted in complete removal of PSA from NCAM (iii). Finally, transfected siRNA NCAM cells were analysed 24, 48 and 72 h post-transfection at the mRNA level using PCR. At 24 h there was no gene silencing, while the maximum silencing (44%) was observed at 48 h post transfection (iv). Data are representative of 2 or 3 independent experiments. NCAM mRNA levels were normalized to the housekeeping gene β-actin. NCAM expression 72 h post transfection increased reaching levels similar to the scrambled siRNA and untreated cells. The transfection efficiency reported here for neural cells lies within the range of transfection efficiencies in neural-like cells reported elsewhere Citation[34], Citation[35]. A summary of the NCAM related treatments applied in the current work is given in .
Table I. Summary of the percentages of the different NCAM isoforms measured by densitometric analysis for control and PIPLC-treated cells.
Table II. Summary of the NCAM-related treatments together with their effect on NCAM and PSA-NCAM.
Aggregate growth and morphology
Neural cells suspended in NSM formed a small aggregate, of an approximate diameter of 500 µm, within 20 s of ultrasound initiation at the central region of the nodal plane (a), while a more closely packed aggregate was formed within 3 min of initiation of cell-cell contact (b) Citation[25]; the first signs of extended perimeter cell-cell contacts (i.e., membrane spreading) were already noticeable at that time (b, arrows). An aggregate was fully formed within 5 min of ultrasound exposure, as characterized by the absence of free single cells from the field of view. No detectable difference could be observed in the aggregate formation pattern between control (i.e., neural cells suspended in NSM), enzyme treated (PIPLC and EndoN) and NCAM siRNA transfected cells (unpublished data). Continuous microscopic observation showed that the aggregates were formed as follows: incoming single cells and dendritic small clusters formed strong contact instantly with the peripheral of the growing aggregate and did not roll along the periphery. The short dendritic clusters rotated, without internal reorganization, about their first contact point with the main aggregate so that it developed a more closely packed form over an extended area Citation[25]. We have previously shown Citation[36] that at the operational acoustic pressures (0.06–0.54 MPa) employed here, the stress imposed on cells at the pressure nodal plane by acoustic streaming flow is much less than that experienced by cells during standard centrifugation procedures, i.e.,<28 g.
Figure 2. (a) Neural cell aggregate levitated in the trap for 20 s. Cell aggregate morphology was open with a number of voids. Scale bar is 60 µm. (b) Zoom-in image of part of an aggregate levitated in the trap for 3 min; the initial signs of an extended perimeter contact are shown (arrows). Scale bar is 20 µm.
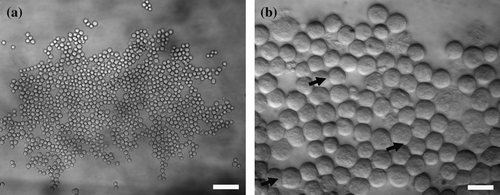
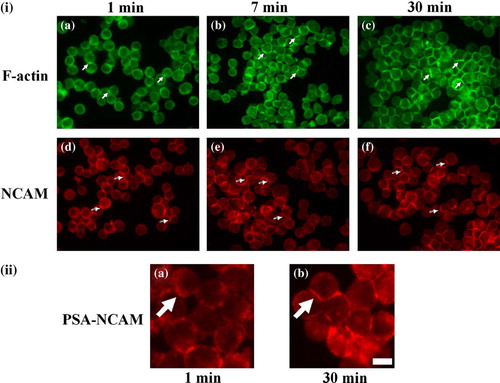
Figure 3. (i) Representative micrographs captured from different fields of view of the distribution of F-actin (a, b, c) and NCAM (d, e, f) in neural cells levitated in the trap for 1 (a, d), 7 (b, e) and 30 min (c, f). At 1 min (a) cells showed a small and thin interfacial actin (arrows), while at 7 min (b) the length and thickness of the interface has increased (arrows); at 30min (c) strong actin accumulation at the cell- cell interface is shown (arrows). NCAM was present at the cell interface from the initial minutes of cell-cell contact (1 min, d, arrows) with progressive accumulation at the interface over the ensuing 29 min (e-f, arrows).Scale bar is 50 µm. (ii) Close-up representative micrographs showing the distribution of PSA-NCAM in cells levitated in the trap for 1 (a) and 30 min (b). PSA is initially (1 min, a) located pericellularly in a spot-like pattern (arrow), while after 29 min (b) a continuous PSA-NCAM interface is observed (arrow). Scale bar is 15 µm. This Figure is reproduced in colour in Molecular Membrane Biology online.
F-actin reorganization and NCAM distribution in cell aggregates subjected to different treatments
Neural cell aggregates removed from the trap after 1 min of ultrasound exposure dissociated into small 2-D clumps (typically 10–50 cells) upon deposition on a glass slide. In contrast, 30 min aggregates remained intact when placed on a slide (indicating that the mechanical strength of the aggregate had increased), but subsequently broke up into large fragments of 100 or more cells during the fixation process Citation[27]. Images were captured from all the fragments of the aggregate (approximately 100 fragments), providing guidance on the typical recurring patterns characteristic of a sample. It is noted that, while samples were removed from the trap after 1, 3, 7, 10 and 30 min of levitation, the immunofluorescent images correspond to the ‘real’ times of 2.5, 4.5, 8.5, 11.5 and 31.5 min due to the time gap (typically 1.5 min) from termination of ultrasound to specimen fixation.
Control (NSM-suspended cells), PIPLC- and EndoN-treated cells
F-actin in control cells, following 1 min of ultrasound exposure was distributed in a cortical arrangement at the cell surface (ia). A thin and short region of high staining at the cell-cell contact region was also observed (ia, arrows). After 7 min, actin label progressively increased at the interfaces of the cells (ib, arrows), while in the ensuing 23 min, F-actin strongly accumulated at the cell-cell contact interface (ic, arrows). There was no detectable difference in F-actin organization, as observed by immunofluorescence, between control, PIPLC-treated (unpublished data) or EndoN-treated cells (ia).
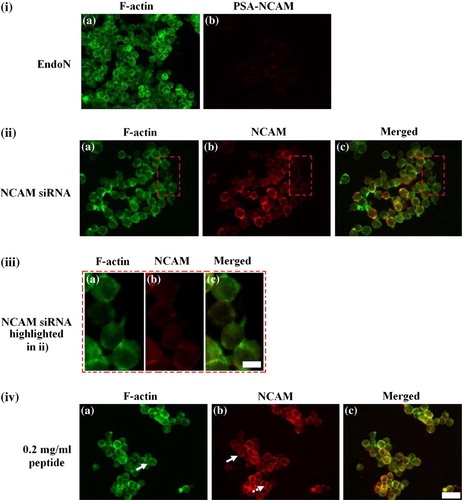
Figure 4. Representative micrographs of the distribution of F-actin (i–iv a), PSA-NCAM (i b) and NCAM (ii–iv b) in cells pre-treated with (i) 20 U/ml EndoN, (ii, iii) 175 ng of NCAM siRNA and (iv) 0.2 mg/ml of peptide. (i) EndoN pre-treated cells showed an F-actin distribution at 7 min (a) comparable to control cells at 30 min (ic), while no PSA-NCAM (b) was detected. (ii) Little F-actin could be detected at the cell-cell interface (a) in NCAM siRNA transfected cells levitated in the trap for 30 min; (b) NCAM -/- staining in these cells; (c) superimposed image of F-actin with NCAM. Attention is drawn to a set of four NCAM -/- cells present in this field of view embedded in a red rectangle and highlighted in (iii). (iii) F-actin (a) in NCAM knockdown cells was diffusely localized in the cells; a short and thin interface is also shown. Very little or no NCAM (b) could be detected; (c) superimposed image of F-actin with NCAM. (iv) In peptide pre-treated cells, 2.76-fold less F-actin (a) is concentrated at the cell-cell interface over 30 min; NCAM (b) was to a great extent localized pericellularly (block arrow), whereas interfacial NCAM staining appeared quite punctate (dotted arrow); (c) superimposed image. Scale bar in (i, ii, iv) is 100 µm and in (iii) 10 µm. This Figure is reproduced in colour in Molecular Membrane Biology online.
NCAM on the other hand, in control cells was detected at the cell-cell interface from the first minutes of ultrasound exposure (i.e., at 1 min of ultrasound exposure) (id); however, the interfacial staining was occasionally non-continuous (id, arrows). NCAM staining at the interface was more continuous 6 min later (ie, arrows), while after 30 min NCAM was distributed evenly at the cell-cell contact area (if, arrows). As was the case for F-actin, no detectable difference in the temporal distribution of NCAM could be observed between control, PIPLC- or EndoN-treated cells (unpublished data).
NCAM siRNA knockdown cells
As shown in iv, there was an overall 44% reduction in the amount of NCAM mRNA expressed by siRNA transfected cells at 48 h. Selection of a targeted cell population (as in the present case of NCAM -/- cells) by flow cytometry (FACS) has been achieved elsewhere Citation[34]; however, no rat NCAM antibody, including the NCAM antibody we have used in this study for Western blotting and immunofluorescence, is currently available for FACS analysis, to our knowledge. Consequently, the unselected neural cell population was introduced into the trap. Removal of aggregates from the trap at different time points, fixation of aggregates and immunofluorescence proceeded as usual; however, measurements of the F-actin integral intensity and the angle θ of the cell-cell interface ‘chord’ were made only from pairs of cells that were NCAM -/-; a total of 20 randomly pairs of NCAM -/- cells were analysed (n=20). iia shows the F-actin distribution at sites of cell-cell contact of a 30 min aggregate consisting of cells expressing different levels of NCAM (iib). A range of NCAM intensities is observed; pairs of cells having a high NCAM staining intensity are found adjacent to cells of low NCAM staining intensity respectively. Attention is drawn to a set of four NCAM -/- cells present in this field of view (iib and highlighted in iiib). F-actin in NCAM knockdown cells was localized in a very short and thin interface (iia and iiia), while no cortical organization could be observed (iia and iiia). No difference could be observed between knockdown cells in contact for 1 or 30 min, i.e., no F-actin reorganisation was detectable. iic and iiic show almost no co-localization of F-actin with NCAM in the NCAM siRNA transfected cells.
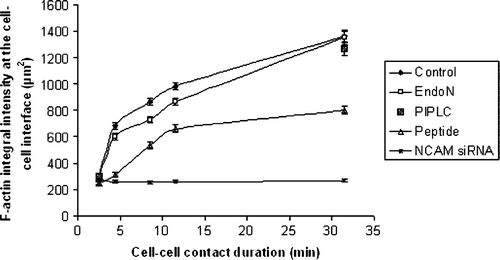
The above qualitative observations were validated by quantifying the temporal accumulation of F-actin at the cell-cell interface (). Intensity measurements of the phalloidin staining of 20 randomly selected paired cells (with the exception of NCAM siRNA cells where measurements were performed on a selected NCAM -/- subpopulation of 20 paired cells) showed that the amount of F-actin at the cell-cell contact region progressively increased over 30 min of cell-cell contact duration (). A similar increase was quantified for the PIPLC pre-treated cells (). In contrast, the amount of F-actin recruited to the cell-cell interface of EndoN-treated cells was lower than that of control cells; however it increased similarly to control cells to reach the same final integral intensity at 30 min (). There was no significant difference (p>0.05) in the F-actin integral intensity of control, PIPLC and EndoN pre-treated cells in contact for 1 and 30 min. Finally, NCAM siRNA cells showed no significant F-actin reinforcement at sites of cell-cell contact from 1 to 30 min (p<0.05, i.e., significantly different to control cells) ().
Figure 5. Measurements of the integral intensity of AlexaFluor 488-Phalloidin staining at the cell-cell interface of 20 randomly selected pairs of cells (n=20) pre-subjected to different treatments. Measurements were performed in aggregates of cells being in contact in the trap for 1, 3, 7, 10 and 30 min. Error bars represent one standard error of the mean.
PSA-NCAM distribution in control and EndoN-treated cells
PSA-NCAM in control (NSM-suspended) cells in contact for 1 min was localized at the cell-cell contact area in a punctate arrangement (iia, arrow). Concentration of PSA at the cell-cell interface increased over the following 29 min of cell-cell contact duration and exhibited a continuous, clearly defined staining pattern at the cell-cell contact area (iib, arrow); no PSA-NCAM was immunofluorescently found in cell-cell contact free regions. In contrast, no PSA-NCAM could be detected by immunolabelling aggregates of cells pre-treated with EndoN in contact for 1 or 30 min in the trap. ib shows that negative PSA-NCAM immunofluorescence was obtained in EndoN pre-treated cells in contact for 7 min; as mentioned earlier no re-expression of PSA-NCAM at the cell surface was observed over the 30 min experimental period.
Intensity measurements of AlexaFluor-594 staining revealed that the amount of PSA present at the cell-cell interface increased by 2-fold, from 503 at 1 min to 1011 µm2 at 30 min of cell-cell contact duration. The mean intensity of PSA was derived from measurements of 20 randomly selected pairs of cells from each of two replicate experiments. The variances and means of the intensity distributions of the sets of measurements were not significantly different (p>0.05). AlexaFluor-594 intensity measurements for EndoN-treated cells were not performed as no staining was detected (ib).
Peptide inhibition of NCAM-NCAM interactions and their effect on cytoskeletal reorganization and membrane spreading
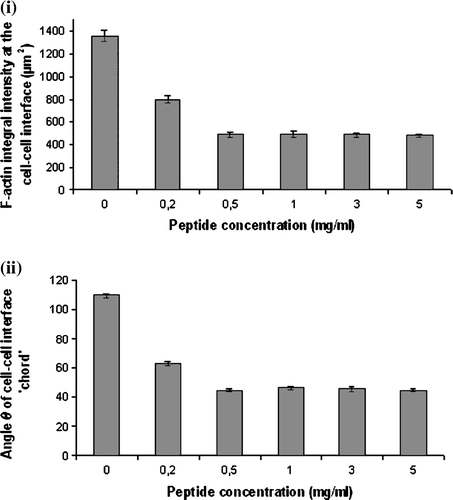
A 0.2 mg/ml concentration of the NCAM blocking peptide showed a 41% decrease in the F-actin integral intensity (i) and a 42% decrease in the angle θ of the ‘cell-cell interface chord’ (ii), following 30 min contact compared with the control value for that time. These indices fell further to limiting values at 0.5 mg/peptide (i, ii). There was no significant difference between the mean F-actin integral intensity and angle θ values of cells suspended in 0.5–5 mg/ml of peptide; in contrast, control cells and cells suspended in 0.2 mg/ml of peptide were significantly different than cells suspended in 0.5–5 mg/ml of peptide (p<0.05). Cells suspended in NSM containing PBS or a scrambled peptide showed no significant difference (p>0.05) in the amount of F-actin recruited to the cell-cell interface or the angle θ of the cell-cell interface ‘chord’ in relation to control cells.
Figure 6. Measurements of (i) the integral intensity of AlexaFluor 488-Phalloidin staining at the cell-cell interface of 20 randomly selected pairs of cells (n=20), and (ii) of the angle θ formed by paired cells pre-subjected to 0–5 mg/ml of NCAM-blocking peptide. Error bars represent one standard error of the mean.
F-actin temporal reorganization in the presence of 0.2 mg/ml of peptide
A 2.8-fold increase of F-actin integral intensity over 30 min in cells of aggregates formed in suspension in NSM containing 0.2 mg/ml of peptide was significantly different (p<0.05) from the 4.4-fold increase in the respective value of control cells ().
Immunofluorescence observations detected little F-actin at the interface of cells in contact for 1 min (unpublished data). Some peripheral (cortical) F-actin staining was also observed (unpublished data) as was the case for control, NSM-suspended cells (ia). In the following 29 min there was some accumulation of F-actin at the interface (iva, arrow) but the levels of accumulation were lower than those observed for control cells (ia). NCAM, on the other hand, was to a greater extent localized pericellularly (ivb, block arrow), whereas interfacial NCAM staining appeared quite punctate (ivb, dashed arrow). The limited extent of co-localization of F-actin and NCAM in the peptide-treated cells is shown in ivc.
Assessing the rate of membrane spreading under different conditions
The angle θ of the cell-cell interface ‘chord’ of paired cells, as an indication of the spreading ability of cells, was measured for 20 different pairs of cells subjected to all of the above treatments (PIPLC, EndoN, NCAM blocking peptide, NCAM siRNA) as well as for control, untreated cells (). The rates and the asymptotic extents of spreading of control, EndoN and peptide pre-treated cells (but not for PIPLC-treated cells as only two time points were investigated, nor for siRNA NCAM transfected cells as no detectable difference was observed between the angle θ value of cells in contact for 1 or 30 min) were determined from an Origin 7 best fit of the nonlinear curve () (). The following phenomenological equation (Equation 1) was employed:1 where α is the asymptotic value of the angle θ reached after 30 min of cell-cell contact, b is the rate of membrane spreading and t is the cell-cell contact duration time (min).
Figure 7. Measurements of the angle θ of the cell-cell interface ‘chord’ of cells subjected to different treatments over time (min). Measurements were conducted in 20 randomly selected pairs of cells (n=20); error bars represent the standard deviation.
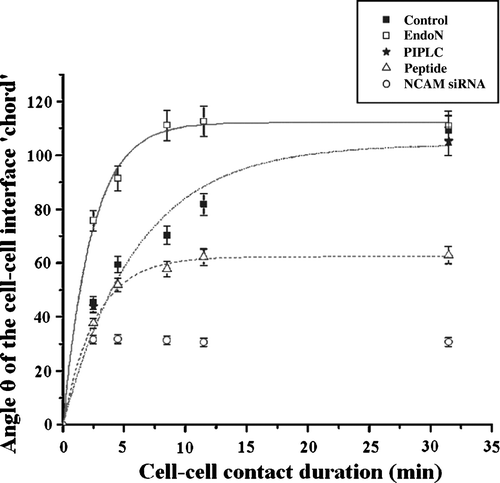
Table III. Summary of the different rates of spreading ‘b’ extracted from Origin 7 for the different NCAM-related treatments applied in this study, together with the values of the asymptotic extent of spreading ‘α’.±represents the estimated standard error of ‘α’ and ‘b’ after 10 iterations as generated in Origin 7.
Control and Endo-N treated cells
α in cells suspended in NSM alone (control) progressively increased over 30 min to reach 104.1°±1.6 after 30 min of cell-cell contact in the trap ( and a), while in EndoN-treated cells α is 112.2°±1.6 ( and b).
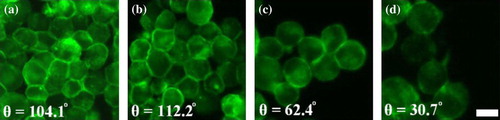
Figure 8. Zoom-in typical micrographs of sets of cells stained with AlexaFluor 488-Phalloidin after 30 min in contact in the trap; (a) control, (b) EndoN, (c) peptide and (d) siRNA NCAM pre-treated cells. The angle θ is measured from immunofluorescence F-actin images, as F-actin reorganization is a marker of the extent of perimeter contact increase. Scale bar is 10 µm. This Figure is reproduced in colour in Molecular Membrane Biology online.
Control and PIPLC-treated cells
PIPLC-treated cells showed no significant difference (p>0.05) in their ability to spread in relation to control cells; α was 105°±2.4 after a 30 min period of cell-cell contact duration.
Control and peptide-treated cells
α for cells treated with 0.2 mg/ml of NCAM-blocking peptide was significantly reduced by 1.75-fold ( and c) in relation to control cells (p<0.05) ( and a).
Control and NCAM siRNA cells
Membrane spreading in NCAM siRNA transfected cells was significantly impaired (p<0.05) in relation to control cells. The value of α was 31.5°±2.5 after 1 min and remained essentially unchanged over the 30 min period of cell-cell contact duration ( and d), i.e., 3.6 times lower than that reported above for control, NSM-suspended cells ( and a).
The experimental data gave values of b of 0.16±0.02 min−1 and 0.42±0.05 min−1 for control and EndoN-treated cells respectively (), whereas for the peptide pre-treated cells b was 0.37±0.08 min−1 (). The ratio of b of EndoN and control cells and its standard error were 2.63±0.076, whereas the ratio of α was 1.07±0.003. In contrast, the ratio of α and b of control and peptide (0.2 mg/ml) pre-treated cells were 2.31±0.14 and 0.6±0.003 respectively. b of EndoN pre-treated cells was significantly different (p<0.05) than that for controls as was that for peptide pre-treated cells (p<0.05).
Discussion
NCAM has a fundamental role in nervous system development including the mediation of adhesion between neural cells and control of cell motility Citation[3]. Therefore we undertook the present study to examine the specific influence of NCAM and PSA-NCAM on cell-cell adhesion and perimeter membrane contact spreading in adhering neural cell monolayers in suspension using a novel ultrasound trap.
One of the key findings was the observation that the asymptotic extent of spreading α and the rate of membrane spreading b were affected when NCAM was modulated using NCAM siRNA, NCAM blocking peptide, PIPLC or EndoN treatments (). In the NCAM siRNA transfected cells, in which NCAM expression was to a great extent abolished, α was significantly impaired (). Similarly, addition of the competitive NCAM peptide also reduced α in a concentration dependent manner indicating the necessity of NCAM for membrane spreading (). At the highest peptide concentration, α was comparable to the limiting value obtained in the NCAM siRNA transfected cells. The early (i.e., 10 min) occurrence of the asymptotic value α in the temporal study of change in θ in the presence of 0.2 mg/ml peptide (), suggests that the decreased value of α observed in the peptide inhibition experiments at 30 min ( and c) is not controlled by change in the spreading rate b. However, the rate of spreading of peptide pre-treated cells is higher than that of control cells (). Although this result was confirmed in three independent experiments, we can offer no hypothesis at this stage to explain this surprising result; further work is currently in progress to elucidate this point.
PIPLC treatment, although removing 70% of the GPI-linked NCAM-120 isoform, had no detectable effect on the 1 and 30 min values of θ compared to those for control cells ( and ). While it is reasonable that the partial removal by PIPLC treatment of the lowest incidence NCAM isoform might not modify adhesion the result also suggests that the lipid rafts that are uniquely associated with GPI-linked proteins (not exclusive to NCAM-120) Citation[37] also had no clear influence on adhesion.
Enzymatic digestion, using EndoN, of PSA bound on NCAM significantly increased b (; ). The increase in b quantified for the EndoN-treated cells falls within the 2.5-fold increase in a basic cell aggregation probability assay Citation[8] and the 5-fold increase in the rate of NCAM-dependent aggregation of membrane vesicles in vitro Citation[38]. As a result, the general role of a negative regulator of cell interactions (not only those mediated by NCAM) has been attributed to PSA Citation[17], Citation[18]. This suggestion well supports the experimental data presented here. The negative electrostatic and steric contributions imposed on cell adhesion by PSA have been removed thus allowing dynamic changes in membrane contacts Citation[10]; consequently cells are able to spread around each other at a faster rate. The asymptotic value α of the angle θ however reaches the same level as control cells after 30 min of cell-cell contact (, ). The molecular mechanism by which PSA exercises this function remains however an open question Citation[11].
Clearly, in the absence of NCAM receptor interaction there is no subsequent spreading of perimeter contact or increase in length of membrane below which the F-actin cytoskeleton is reorganised. We have also demonstrated, in suspended neural cells, that while the spreading process was complete within 7 min of initiation of cell-cell contact in EndoN pre-treated cells (), F-actin integral intensity continued to increase at later times through recruitment of F-actin to the cell-cell interface (). More specifically, EndoN pre-treated cells had already reached 70% of its asymptotic value after 1 min of contact concomitant with an F-actin integral intensity of 23% of its final value. Therefore, F-actin is laid down only up to the limiting points that membrane perimeter contact has been achieved. It is well established that cadherins influence F-actin reorganization Citation[39], however little is known about the interactions of NCAM with cytoskeletal proteins. NCAM-140 and -180 can interact directly with isolated β1-subunits of spectrin Citation[40], α-actinin Citation[41] and α- and β-tubulin Citation[41]. There is as yet no specific evidence of which we are aware, that NCAM alone can trigger F-actin cytoskeletal reorganization.
Organization of the intercellular space is often governed by more than one type of adhesion molecule Citation[18]. We have previously shown that C6 neural cells express NCAM and N-cadherin and that NCAM appears at the interface of interacting cells within 1 min of initiation of cell-cell contact Citation[25], while N-cadherin is located intracellularly (i.e., it had not yet redistributed to the cell surface). Redistribution of N-cadherin to the interfacial region occurred after 8 min from initiation of cell-cell contact Citation[25]. The implication is that NCAM concentration at the interface precedes cadherin arrival. In support of this conclusion, Sandig et al. reported that NCAM accumulated first at the tips of filopodia-like processes followed by the arrival of cadherins Citation[42]. This suggests that NCAM is responsible for the initial spreading of the cell perimeter contact and cadherins stabilize these contact areas by anchoring them to the cytoskeleton. Likewise, Keller et al. Citation[43] showed that Walker carcinosarcoma cells with minimal cortical actin and no morphologically recognisable protrusions (due to colchicine and latrunculin A treatments), migrated faster on substrata than control cells with lamellipodia and an intact cortical actin layer Citation[43]. They concluded that the cortical actin layer or actin-powered force generation at the front is redundant for locomotion Citation[43]. Our results, demonstrating that NCAM controls membrane spreading and that cadherins control the subsequent rate of F-actin integral intensity increase, in C6 cells in suspension, are consistent with reports of cells on substrata. We recognize that the NCAM dependence of membrane spreading shown here for the C6 neural cell line cannot be a general model for cell adhesion since cells that do not express NCAM (as for example the prostate epithelial cell line PZ-HPV-7) have exhibited a spreading capacity similar to that reported here for neural cells Citation[33].
Our data also indicate that the Ig3 domain of NCAM is capable of inducing NCAM cell-cell adhesion. This correlates well with a previous study that showed inhibition of E8 chicken embryo neuronal cell aggregation as well as aggregation of NCAM coated microspheres when an antibody against Ig3 was included in the suspending phase Citation[44]. Domain deletion studies with NCAM-transfected cells also support a model in which Ig3 domain inhibition is sufficient to abrogate adhesion Citation[21], Citation[45]. It has been suggested that Ig1 Citation[46] or Ig1 and Ig2 Citation[47] or all five Ig domains Citation[48] are responsible for NCAM homophilic binding. It was beyond the scope of this study to identify which other Ig domains can contribute to the homophilic binding of NCAM.
In conclusion, the results presented here provide direct evidence that the limiting extent of membrane-membrane perimeter spreading of neural cells is attributable to the functionality of NCAM at the cell surface, whilst the subsequent F-actin reorganization is attributable to cadherins localized at the cell surface. In this instance, in the absence of NCAM, no other adhesion molecule was capable of inducing membrane spreading in neural cells. Modulation of PSA content also had a significant effect on the rate of perimeter adhesion development. The cytomechanical consequences of the NCAM modulation approaches described above can also be measured (e.g., by using the dual micropipette assay recently described by Chu et al. Citation[49]) in order to further understand the biological consequences of in vivo changes in PSA-NCAM properties.
Supplementary text
Measurements of membrane spreading
Estimates of the angle θ subtended by the F-actin staining region at the centres of a pair of interacting cells were measured as previously described Citation[33]. Briefly, the contact region was treated as a shared chord of ‘overlapping’ circles (Supplementary iii). It is appreciated that the cell perimeters are longer than those for perfect circles as cells have surface area in excess of that required to contain a spherical cell volume (a property necessary so that when a cell divides the two resulting smaller volumes are each continuously covered by membrane) Citation[33]. No geometrical allowance can therefore be made for the consequent departure from circular profiles as membrane spreading continues Citation[33]. Within that limitation it will be taken, for a ‘cell-cell contact chord’ L and cell radius R (Supplementary iii), that θ? is the angle subtended by the chord at the centre of the cell. While the membrane dynamics and micromechanics at the end of contact regions are not known it is reasonable to assume that, for cells, the ability to continue to increase the length of a chord depends, among other things, on both the surface density of the homophilic receptors and the local resistance of the membrane to deformation Citation[33]. Measurements of the angle θ of a cell-cell interface ‘chord’ were performed using Cell-P software.
Supplementary Figure 1. (i) Schematic of the temporal progression of cells in a ?/2 ultrasound trap, showing (a) particles homogeneously distributed at time zero, (b) cells already in the pressure node plane within 1 s and (c) subsequent concentration of the cells in a single aggregate. (ii) Experimental assembly: The resonator outer diameter is 25 mm. Its main components were a 1.5 MHz disc transducer that was glue-attached to a steel acoustic coupling layer, a sample volume and glass acoustic reflector. The assembly is placed on the top of an epi-fluorescence microscope's stage. (iii) Schematic diagram of an interacting cell doublet; L is the length of the F-actin staining region or ‘chord’ (drawn here as a straight line), R is the radius of the cells and ? is the angle subtended by the ‘chord’ at the centre of the cell [33].
![Supplementary Figure 1. (i) Schematic of the temporal progression of cells in a ?/2 ultrasound trap, showing (a) particles homogeneously distributed at time zero, (b) cells already in the pressure node plane within 1 s and (c) subsequent concentration of the cells in a single aggregate. (ii) Experimental assembly: The resonator outer diameter is 25 mm. Its main components were a 1.5 MHz disc transducer that was glue-attached to a steel acoustic coupling layer, a sample volume and glass acoustic reflector. The assembly is placed on the top of an epi-fluorescence microscope's stage. (iii) Schematic diagram of an interacting cell doublet; L is the length of the F-actin staining region or ‘chord’ (drawn here as a straight line), R is the radius of the cells and ? is the angle subtended by the ‘chord’ at the centre of the cell [33].](/cms/asset/4f33a8d5-bedb-4343-b04f-83c793f5d389/imbc_a_261687_f0009_b.jpg)
Acknowledgements
We would like to thank Dr. G. A. Foster for providing the C6 neural cell line.
References
- Thornton MR, Mantovani C, Birchall MA, Terenghi G. Quantification of NCAM and N-cadherin expression in axotomized and crushed rat sciatic nerve. J Anat 2005; 206: 68–78
- Saffell JL, Doherty P, Tiveron MC, Morris RJ, Walsh FS. NCAM requires a cytoplasmic domain to function as a neurite outgrowth-promoting neuronal receptor. Mol Cell Neurosci 1995; 6: 521–531
- Prag S, Lepekhin EA, Kolkova K, Hartmann-Petersen R, Kawa A, Walmod PS, Belman V, Gallagher HC, Berezin V, Bock E, Pedersen N. NCAM regulates cell motility. J Cell Sci 2001; 115: 283–292
- Cambon K, Hansen SM, Venero C, Herrero AI, Skibo G, Berezin V, Bock E, Sandi C. A synthetic neural cell adhesion molecule mimetic peptide promotes synaptogenesis, enhances presynaptic function and facilitates memory consolidation. J Neurosci 2004; 24: 4197–4204
- Sandi C, Cordero MI, Merino JJ, Kruyt ND, Regan CM, Murphy KJ. Neurobiological and endocrine correlates of individual differences in spatial learning ability. Learn Memory 2004; 11: 244–252
- Povlsen GK, Ditlevsen DK, Berezin V, Bock E. Intracellular signalling by the neural cell adhesion molecule. Neurochem Res 2003; 28: 127–141
- Rutishauser U, Acheson A, Hall A, Mann DM, Sunshine J. The neural cell adhesion molecule -NCAM- as a regulator of cell-cell interactions. Science 1988; 240: 53–57
- Acheson AJ, Sunshine L, Rutishauser U. NCAM polysialic acid can regulate both cell-cell and cell-substrate interactions. J Cell Biol 1991; 114: 143–153
- Decker L, Durbec P, Rougon G, Baron-Van Evercooren A. Loss of polysialic residues accelerates CNS neural precursor differentiation in pathological conditions. Mol Cell Neurosci 2002; 19: 225–238
- Kiss JZ, Troncoso E, Djebbara Z, Vutskits L, Muller D. The role of neural cell adhesion molecules in plasticity and repair. Brain Res Rev 2001; 36: 175–184
- Zhang H, Vutskits L, Calaora V, Durbec P, Kiss JZ. A role for the polysialic acid-neural cell adhesion molecule in PDGF-induced chemotaxis of oligodendrocyte precursor cells. J Cell Sci 2004; 117: 93–103
- Rutishauser U. Polysialic acid and the regulation of cell interactions. Curr Opin Cell Biol 1996; 8: 679–684
- Brusés JL, Rutishauser U. Roles, regulation and mechanism of polysialic acid function during neural development. Biochimie 2001; 83: 635–643
- Toikka J, Aalto J, Hayrinen J, Pelliniemi LJ, Finne J. The polysialic acid units of the neural cell adhesion molecule NCAM form filament bundle networks. J Biol Chem 1998; 273: 28557–28559
- Fujimoto I, Bruses JL, Rutishauser U. Regulation of cell adhesion by polysialic acid. J Biol Chem 2001; 276: 31745–31751
- Yang P, Yin X, Rutishauser U. Intercellular space is affected by the polysialic acid content of NCAM. J Cell Biol 1992; 116: 1487–1496
- Rutishauser U. Polysialic acid at the cell surface: biophysics in service of cell interactions and tissue plasticity. J Cell Biochem 1998; 70: 304–312
- Johnson CP, Fujimoto I, Rutishauser U, Leckband DE. Direct evidence that the neural cell adhesion molecule (NCAM) polysialylation increases intermembrane repulsion and abrogates adhesion. J Biol Chem 2005; 280: 137–145
- Rutishauser U, Watanabe M, Silver J, Troy FA, Vimr ER. Specific alteration of NCAM-mediated cell adhesion by an Endoneuraminidase. J Cell Biol 1985; 101: 1842–1849
- Pizzey JA, Rowett LH, Barton CH, Dickson G, Walsh FS. Intercellular adhesion mediated by human muscle neural cell adhesion molecule – effects of alternative exon use. J Cell Biol 1989; 109: 3465–3476
- Rao Y, Wu X-F, Gariepy J, Rutishauser U, Siu C-H. Identification of a peptide sequence involved in homophilic binding in the neural cell adhesion molecule NCAM. J Cell Biol 1992; 118: 937–949
- Soroka V, Kiryushko D, Novitskaya V, Ronn LCB, Poulsen FM, Holm A, Bock E, Berezin V. Induction of neuronal differentiation by a peptide corresponding to the homophilic binding site of the second Ig module of the neural cell adhesion molecule. J Biol Chem 2002; 277: 24676–24683
- Spengler J, Coakley WT. Ultrasonic trap to monitor morphology and stability of developing microparticle aggregates. Langmuir 2003; 19: 3635–3642
- Coakley WT, Bazou D, Morgan J, Foster GA, Archer CW, Powell K, Borthwick KAJ, Twomey C, Bishop J. Cell-cell contact and membrane spreading in an ultrasound trap. Colloids Surf B 2004; 34: 221–230
- Bazou D, Foster GA, Ralphs JR, Coakley WT. Molecular adhesion development in a neural cell monolayer forming in an ultrasound trap. Mol Memb Biol 2005; 22: 229–240
- Bazou D, Coakley WT, Meek KM, Yang M, Pham DT. Characterisation of the morphology of 2-D particle aggregates in different electrolyte concentrations in an ultrasound trap. Colloids Surf A 2004; 243: 97–104
- Bazou D, Dowthwaite GP, Khan IM, Archer CW, Ralphs JR, Coakley WT. Gap junctional intercellular communication and cytoskeletal organization in chondrocytes in suspension in an ultrasound trap. Mol Membr Biol 2006; 23: 195–205
- Wang C, Rougon G, Kiss JZ. Requirement of polysialic acid for the migration of the O-2A glial progenitor cell from neurohypophyseal explants. J Neurosci 1994; 14: 4446–4457
- Blain E, Gilbert SJ, Hayes AJ, Duance VC. Disassembly of the vimentin cytoskeleton disrupts articular cartilage chondrocyte homeostasis. Matrix Biol 2006; 25: 398–408
- Nudel U, Zakut R, Shani M, Neuman S, Levy Z, Yaffe D. The nucleotide sequence of the rat cytoplasmic ß-actin gene. Nucleic Acids Res 1983; 11: 1759–1771
- Spengler JF, Coakley WT, Christensen KT. Microstreaming effects on particle concentration in an ultrasonic standing wave. AiChE J 2003; 49: 2773–2782
- Hawkes JJ, Coakley WT, Groschl M, Benes E, Amstrong S, Tasker PJ, Nowotny H. Single half-wavelength ultrasonic particle filter: predictions of the transfer matrix multilayer resonator model and experimental filtration results. J Acoust Soc Am 2002; 111: 1259–1266
- Bazou D, Davies G, Jiang WG, Coakley WT. Rapid molecular and morphological responses of prostate cell lines to cell-cell contact. Cell Commun Adh 2006; 13: 279–294
- Roy NS, Benraiss A, Wang S, Frazer RAR, Goodman R, Couldwell WT, Nedergaard M, Kawaguchi A, Okano H, Goldman SA. Promoter-targeted selection and isolation of neural progenitor cells from the adult human ventricular zone. J Neurosci Res 2000; 59: 321–331
- Nunes MC, Roy NS, Keyoung HM, Goodman RR, McKhann G II, Jiang L, Kang J, Nedergaard M, Goldman SA. Identification and isolation of multipotential neural progenitor cells fro the subcortical white matter of the adult human brain. Nat Med 2003; 9: 439–447
- Bazou D, Kuznetsova LA, Coakley WT. Physical environment of 2D animal cell aggregates formed in a short pathlength ultrasound standing wave trap. Ultrasound Med Biol 2005; 31: 423–430
- Jamney PA, Lindberg U. Cytoskeletal regulation: rich in lipids. Nat Mol Cell Biol 2004; 5: 658–666
- Hoffman S, Edelman GM. Kinetics of homophilic binding by embryonic and adult forms of the neural cell adhesion molecule. Proc Natl Acad Sci USA 1983; 80: 5762–5766
- Braga V. Epithelial cell shape: cadherins and small GTPases. Exp Cell Res 2000; 261: 83–90
- Leshchyns'ka I, Sytnyk V, Morrow JS, Schachner M. Neural cell adhesion molecule (NCAM) association with PKC beta (2) via beta I spectrin is implicated in NCAM-mediated neurite outgrowth. J Cell Biol 2003; 161: 625–639
- Büttner B, Kannicht C, Reutter W, Horstkorte R. The neural cell adhesion molecule is associated with major components of the cytoskeleton. Biochem Biophys Res Commun 2003; 310: 967–971
- Sandig M, Kalnins VI, Siu C-H. Role of NCAM, cadherins, and microfilaments in cell-cell contact formation in TM4 immature mouse sertoli cells. Cell Motil Cytoskel 1997; 36: 149–163
- Keller H, Zadeh AD, Eggli P. Localised depletion of polymerised actin at the front of Walker carcinosarcoma cells increases the speed of locomotion. Cell Mot Cytoskel 2002; 53: 189–202
- Ranheim TS, Edelman GM, Cunningham BA. Homophilic adhesion mediated by the neural cell adhesion molecule involves multiple immunoglobulin domains. Proc Natl Acad Sci USA 1996; 93: 4071–4075
- Johnson CP, Fujimoto I, Perrin-Tricaud C, Rutishauser U, Leckband D. Mechanism of homophilic adhesion by neural cell adhesion molecule: use of multiple domains and flexibility. Proc Natl Acad Sci USA 2004; 101: 6963–6968
- Kiryushko D, Kofoed T, Skladchikova G, Holm A, Berezin V, Bock E. A synthetic peptide ligand of neural cell adhesion molecule (NCAM), C3d, promotes neuritogenesis and synaptogenesis and modulates presynaptic function in primary cultures of rat hippocampal neurons. J Biol Chem 2003; 278: 12325–12334
- Kasper C, Rasmussen H, Kastrup JS, Ikemizu S, Jones EY, Berezin V, Bock E, Larsen IK. Structural basis of cell-cell adhesion by NCAM. Nat Struct Biol 2000; 7: 389–393
- Zhou H, Fuks A, Alcaraz G, Bolling TJ, Stanners CP. Homophilic adhesion between Ig superfamily carcinoembryonic antigen molecules involves double reciprocal bonds. J Cell Biol 1993; 122: 951–960
- Chu Y-S, Thomas WA, Eder O, Pincet F, Perez E, Thiery JP, Dufour S. Force measurements in E-cadherin-mediated cell doublets reveal rapid adhesion strengthened by actin cytoskeleton remodeling through Rac and Cdc42. J Cell Biol 2004; 167: 1183–1194