Abstract
Site directed spin-labeling (SDSL) has been used to probe the structural and dynamic features of residues comprising the sixth transmembrane segment of the mitochondrial oxoglutarate carrier. Starting from a functional carrier, where cysteines have been replaced by serines, 18 consecutive residues (from G281 to I298) have been mutated to cysteine and subsequently labeled with a thiol-selective nitroxide probe. The labeled proteins, reconstituted into liposomes, have been assayed for their transport activity and analyzed with continuous-wave electron paramagnetic resonance. Linewidth analysis, that is correlated to local probe mobility, indicates a well defined periodicity of the whole segment from G281 to I298, indicating that it has an α-helical structure. Saturation behaviour, in presence of paramagnetic perturbants of different hydrophobicities, allow the definition of the polarity of the individual residues and to assign their orientation with respect to the lipid bilayer or to the water accessible translocation channel. Comparison of the EPR data, homology model and activity data indicate that the segment is made by an alpha helix, accommodated in an amphipathic environment, partially distorted in the middle at the level of L289, probably because of the presence of a proline residue (P291). The C-terminal region of the segment is less restrained and more flexible than the N-terminus.
| Abbreviations | ||
| AAC | = | ADP/ATP carrier |
| DM | = | dodecyl-β-D-maltoside |
| EPR | = | electron paramagnetic resonance |
| MCF | = | mitochondrial carrier family |
| MTSL | = | (1-Oxyl-2,2,5,5-tetramethyl-3-pyrroline-3-methyl)methanethiosulfonate |
| NiEDDA | = | nickel-ethylenediaminediacetate |
| OGC | = | oxoglutarate carrier |
| PIPES | = | piperazine-N,N′-bis(2-ethanesulphonic acid) |
| SDSL | = | site directed spin-labeling |
| TMS | = | transmembrane segment |
Introduction
The mitochondrial oxoglutarate carrier (OGC) catalyzes the transport of 2-oxoglutarate across the mitochondrial inner membrane in exchange for malate, or other dicarboxylates, and plays an important role in several metabolic processes Citation[1]. The OGC belongs to a large family of related transport proteins called the mitochondrial carrier family (MCF). The primary structures of the family members are made up of three tandemly-repeated homologous domains of about 100 amino acids in length, each containing a characteristic sequence motif and two hydrophobic stretches Citation[2]. An important contribution to the description of the structural characteristics of the mitochondrial transporter family has been provided by EM studies on two dimensional crystals of the yeast ADP/ATP carrier (AAC) Citation[3] and by the elucidation of the crystal structure of the bovine AAC. AAC consists of six transmembrane helices and three little helices parallel to the membrane Citation[4]. At the end of the odd transmembrane helices of the MCF proteins there are three very conserved sequence motifs: P-X-[D/E]-X-X-[R/K] and also between the little helices, parallel to membrane, and the even transmembrane helices there are three other very conserved sequence motifs: [D/E]-G-X-X-X-X-[Y/W][K/R]G. AAC was crystallized in complex with its powerful inhibitor carboxyatractyloside (CATR). In the crystal structure it is possible to see the salt bridge network that closes the carrier on the matrix side, constituted by charged residues of the sequence motifs of odd transmembrane helices.
No 3D structure is available for OGC yet, but several spectroscopic and functional studies have unveiled some of its features. The OGC is folded into six transmembrane segments too in the inner mitochondrial membrane Citation[5], Citation[6]. It has been the first eukaryotic membrane protein to be expressed in Escherichia coli and refolded in the reconstitutively active state Citation[7]. This allowed further structure-function correlation studies, which first included Cys-scanning mutagenesis of TMS II, IV and VI Citation[8], Citation[9] and NMR spectroscopy of protein fragments corresponding to TMS I, II, V and VI and part of their flanking hydrophilic loops Citation[10], Citation[11]. More recently, Cys-scanning mutagenesis has been employed to examine the importance of the residues in the odd numbered TMSs in the structure-function relationship and assess their sensitivity to modification by sulphydryl reagents Citation[12].
Site directed spin-labeling (SDSL) involves the systematic introduction of a nitroxide side chain at a selected site, achieved by cysteine substitution mutagenesis followed by modification of the protein's sulfhydryl group with a selective nitroxide reagent. SDSL has been successfully applied to several membrane proteins Citation[13–17], including TMS IV of OGC Citation[18].
In this work we have extended the SDSL approach to TMS VI of OGC, introducing the methane thiosulphonate spin-label (MTSL) at 18 consecutive residues from G281C to I298C and studying their relative mobility as well as their accessibility to molecular oxygen and nickel-ethylenediaminediacetate (NiEDDA). The results indicate that TMS VI is in an α-helical conformation and identify a face of the helix as solvated by the lipid bilayer. Furthermore they indicate a region of the helix that may be prone to distortion likely favoured by the presence of P291 at about the middle of the segment.
Materials and methods
Construction of plasmids and site-directed mutagenesis
The plasmids containing the cDNA of the bovine OGC mutant devoid of Cys residues (C-less OGC) or the cDNAs corresponding to single-Cys-replacement mutants of the C-less OGC (from G281C to I298C) were obtained as previously described Citation[8].
Overexpression and purification of C-less OGC and single-Cys OGC mutants
The overproduction of OGC mutants as inclusion bodies in E. coli C0214(DE3) was performed as described before Citation[8]. Inclusion bodies were isolated as described previously Citation[7], and the recombinant OGC mutants were extracted in the presence of 1% SDS and purified by SDS-PAGE as described previously Citation[18]. Briefly, after electrophoresis, the band corresponding to the OGC mutants was excised from the gel and electroeluted using a Tris-glycine-SDS buffer. The buffer was then extensively exchanged with DM buffer (0.17 mM dodecylmaltoside, 1 mM EDTA and 10 mM Tris-HCl, pH 7.1) using Centricon-30 tubes flooded repetitively with excess DM buffer for about 36 hours at 4°C Citation[18]. The amount of recombinant protein was estimated from Coomassie blue-stained SDS-PAGE by the Bio-Rad GS-700 Imaging Densitometer equipped with the software Bio-Rad Multi-Analyst, using carbonic anhydrase as standard.
Spin-labeling of single-Cys OGC mutants
The recombinant proteins (about 80 µM) were incubated with DTE and, after removal of the reductant by size-exclusion chromatography on a Sephadex G-25 column, labeled with threefold excess MTSL, a paramagnetic probe that reacts selectively with Cys residues. The unreacted label was removed by gel-filtration on an FPLC apparatus with a Fast Desalting column HR 10/10 (Amersham-Pharmacia, Milan, Italy) eluted with DM buffer. Protein was concentrated to about 10 mg/ml using Centricon 30 tubes (Amicon, Milan, Italy) and analyzed by EPR spectroscopy. Labeling efficiency, that varied from ∼60 to 90%, was assessed comparing the label and protein concentration. The label concentration was evaluated by double integration of EPR signal compared to that of a freshly prepared label solution of known concentration. Specificity of the reaction of the label with the singly inserted cysteine is ensured by the absence in the C-less mutant of any EPR signal (data not shown).
Reconstitution of OGC mutants into liposomes and transport measurements
Labeled recombinant proteins were reconstituted into artificial phospholipid vesicles as described previously Citation[8]. The reconstitution mixture consisted of DM-solubilized protein (about 500 or 10 µg for EPR measurements or functional assays, respectively), 10 mg of Triton X-114, 10 mg of egg-yolk phospholipids (Fluka, Milan, Italy) as sonicated liposomes, 30 mM oxoglutarate, 10 mM PIPES, pH 7.0, and water (final volume 700 µl). The mixture was recycled, at room temperature, 13 times through an Amberlite column pre-equilibrated with buffer containing 30 mM oxoglutarate and 10 mM PIPES, pH 7.0. All other operations were performed at 4°C. The amount of protein incorporated into liposomes was determined as described in Citation[19]. The external substrate was removed from proteoliposomes on a Sephadex G-75 gel filtration column, pre-equilibrated with buffer A (50 mM NaCl and 10 mM PIPES, pH 7.0). The eluted proteoliposomes were either pelleted at 110,000 g for 90 min at 4°C and resuspended in a minimal volume of supernatant for EPR measurements, or used directly for functional assays. The steady-state levels of oxoglutarate transport were measured as follows. Transport at 25°C was started by adding 3 mM [14C]oxoglutarate to proteoliposomes and terminated after 90 min via the inhibitor-stop method Citation[18]. Entrapped radioactivity was counted Citation[8]. The experimental values were corrected by subtracting control values, and the transport activities were calculated by taking into account the efficiency of reconstitution (i.e., the share of successfully incorporated protein). In order to exclude possible protein-protein interaction effects on the detected transport activity, on some mutants measurements have been carried out at different protein-lipid ratios. No appreciable difference in activity was detected, even when using the high protein to lipid ratios as the ones used for EPR samples, thus excluding concentration-dependent effects on transport.
EPR measurements
EPR spectra were recorded as first derivative spectra on a Bruker ESP 300 spectrometer equipped with a loop gap resonator using 1.0 G modulation at room temperature. Spin concentration as evaluated by double integration of the signal compared to that of a standard label solution was of the order of 10−5 M. The line width (ΔH) of each spectrum was evaluated as the peak-to-peak center line width using the Bruker EPR software. The linewidth of all the investigated mutants, evaluated for reconstituted samples at different protein to lipid ratios, is independent in the range of ca. 0.3 to 0.7 mg of protein per preparation. Power saturation experiments, from 0.2 up to 200 mW incident power, were carried out under a nitrogen atmosphere, in the presence of oxygen or in the presence of 70 mM NiEDDA in equilibrium with nitrogen; gas permeable TPX capillaries were used as sample holders. Power saturation curves were obtained and analysed as described Citation[18], Citation[20]. Three sets of values were generated in this way corresponding to different experimental conditions: in equilibrium with nitrogen (as reference), in equilibrium with air (20% oxygen) and in the presence of 70 mM NiEDDA in equilibrium with nitrogen. The difference, ΔP1/2, between the values of the half saturation parameter measured in the presence and absence of paramagnetic perturbants, was used to calculate the dimensionless accessibility parameters ΠO2 and ΠNiEDDA Citation[18], Citation[21]. ΔH and Π values were fitted to a sine wave using the GraphPad Prism Software and fits were evaluated by least squares and R2 with the built in software.
Results
Mobility and accessibility
shows the EPR spectra of the OGC TMS VI single-Cys mutants, from G281C to I298C, labeled with MTSL. Analysis of the line width (ΔH) allows the division of the residues into two main groups according to their mobility.
Figure 1. EPR spectra of the 18 single-Cys OGC mutants reconstituted into liposomes, containing the nitroxide chain at the indicated positions. EPR conditions: room temperature, 1.0 Gauss modulation; scan sweep 100 Gauss. Scale bar at the bottom represents 20 Gauss.
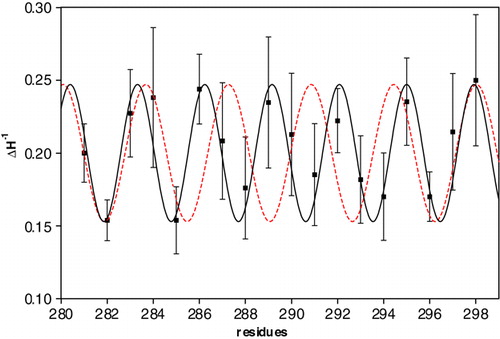
The line shape of the spectra is indeed a reporter of the local dynamics and of the local constraints affecting the nitroxide ring Citation[20], Citation[22]. The mutants with a medium-high mobility (ΔH−1>0.20), carry the spin-label at positions 283, 284, 286, 287, 289, 290, 292, 295, 297 and 298. Those with a medium-low mobility (ΔH−1<0.20) are located at position 282, 285, 288, 291, 293, 294 and 296. The spin-label G281C shows intermediate mobility (ΔH−1=0.20). The medium-high degree of mobility of the first group suggests that these residues reside on the face of the segment facing the lipid bilayer, located between TMS VI and the neighbouring transmembrane helices, because of the low steric constrictions that the spin-label experiences in this environment Citation[23]. More immobilized residues are likely to be located on the face of the segment, between TMS VI, other transmembrane helices and/or the carrier channel where side chains create specific constraints. A, which reports ΔH−1 values as a function of the label position along the 281–298 segment, indicates that this parameter is characterized by a clear periodicity. Indeed, the experimental data can be well fitted with a sinusoid with a period of 3.1. This value is slightly lower than that of an ideal α-helix, that is expected when helices pack parallel to one another. Attempts to fit the data with a sine wave of period 3.6 were unsuccessful (see Supplementary in the online version). The deviations from the 3.6 value can be explained by helices packing at an angle with respect to one another and with respect to the membrane plane normal or by distortions of the helix itself. In our model (see ) both the distortion of the helix and the left-handed helical bundle formed bt the TM segments contribute to this periodicity.
Figure 2. Mobility and accessibility to paramagnetic quenchers as a function of OGC-labeled single-Cys mutants. (A) Inverse linewidth, ΔH−1, diagnostic of mobility. A sinusoidal fit is superimposed. (B) ΠO2, accessibility to molecular oxygen, along with a superimposed sinusoidal fit. (C) ΠNiEDDA, accessibility to the hydrophilic metal complex NiEDDA. The accessibility values for R288C are not reported.
To establish if, in a mutant, a spin-labeled Cys-residue points to the membrane or to the cavity of the carrier and to gain further information concerning the properties of TMS VI the SDSL approach was extended. This can be obtained upon investigating the accessibility of the spin-label to broadening reagents of different polarity Citation[20]. Two such reagents were used: molecular oxygen, which is highly soluble in the low dielectric lipid environment, and NiEDDA, which is a water-soluble Ni(II) chelate complex. High O2 accessibility is diagnostic of a membrane-exposed residue. By contrast high NiEDDA accessibility is indicative of a water-exposed residue. The accessibility parameters of the spin-label bound to every single residue of the 281–298 segment were determined by power saturation experiments carried out in the presence and absence of each paramagnetic perturbing agent.
B shows the plot of the O2 accessibility profile (ΠO2) along the 281–298 segment. ΠO2 has a periodic trend almost identical to that observed for the mobility parameter ΔH−1, indicating low O2 accessibility about every three residues. The data follow a sinusoid having a periodicity of about 3.1, in phase with the sinusoid overlapping the ΔH−1 data. The residues with the highest mobility (high ΔH-1 values) correspond to local maxima in ΠO2, confirming that these residues mainly interface the lipidic bilayer, while residues corresponding to minima should face the opposite site. The accessibility of the water-soluble NiEDDA (ΠNiEDDA) along TMS VI displays a complex behavior (C). The segment is characterized by quite low NiEDDA values likely because the NiEDDA is too large to enter in almost every part of the channel Citation[15]. Two distinct regions emerge. The segment's N-terminus, from residue 282 to 286, shows ΠNiEDDA values lower than 0.2, diagnostic of a very low accessibility of this region to the probe Citation[24]. The segment's C-terminus, from residue 287 to 298, is characterized by ΠNiEDDA values higher than 0.2, diagnostic of a partial accessibility to the reagent. In this region two residues at the end of the segment, T296C and I298C, show a large accessibility to NiEDDA, having a ΠNiEDDA value of 0.6 and 1.5 respectively. Importantly, despite the existence of two different regions, the ΠNiEDDA values oscillate between maxima and minima with a periodicity largely out of phase with the O2-accessibility.
Effect of the spin-label on the activity of OGC mutants
The OGC 18 single-Cys mutants from G281C to I298C, reconstituted into liposomes, were probed for their functionality before and after modification with the MTSL spin-label. The steady-state levels of oxoglutarate transport are reported in for each of the Cys mutants, with and without labels, as a percentage of the C-less value. Before labeling, most of the mutants transported oxoglutarate very significantly with respect to the C-less OGC; 12 mutants exhibited steady-state levels that were between 60% and 100% or more of C-less and 3 mutants transported oxoglutarate at lower but significant extent (>20% of C-less). Only R288C, T293C and F297C displayed negligible levels as compared to that of C-less OGC. After modification with MTSL the majority of the mutants still retain a significant activity. Only G281C, F282C, Y285C and A287C were inhibited very strongly, whereas the activity of F297C was increased 5–6 times up to about 30% of that of C-less OGC.
Figure 3. Steady-state levels of oxoglutarate transport by reconstituted single-Cys OGC mutants with (black bars) and without (white bars) MTSL labelling. The single-letter amino acid code along the horizontal axis denotes the residues of the C-less OGC replaced with Cys. Transport was started by the addition of 3 mM [14C]oxoglutarate and terminated after 90 min. The data are expressed as percentage of the C-less OGC values, that was on average 8635±1215 nmol/min *(mg protein)−1. The data represent means±SD of at least three independent experiments in duplicate.
![Figure 3. Steady-state levels of oxoglutarate transport by reconstituted single-Cys OGC mutants with (black bars) and without (white bars) MTSL labelling. The single-letter amino acid code along the horizontal axis denotes the residues of the C-less OGC replaced with Cys. Transport was started by the addition of 3 mM [14C]oxoglutarate and terminated after 90 min. The data are expressed as percentage of the C-less OGC values, that was on average 8635±1215 nmol/min *(mg protein)−1. The data represent means±SD of at least three independent experiments in duplicate.](/cms/asset/185e2bf6-a088-4449-8ee2-27ebfd731ab7/imbc_a_285997_f0003_b.gif)
Discussion
The EPR data reported above indicate that the OGC TMS VI has an α-helical structure that is accommodated in an amphipathic environment, according to the amphipathic nature of its sequence, This conclusion is in agreement, although with some discrepancies, with the TMS VI structure predicted by the homology model of OGC built on the available 3D structure of the AAC carrier Citation[9], Citation[12], Citation[25] and with the NMR structure of the synthetic peptide P284-I298 Citation[11]. The information about the orientation obtained by EPR and homology modelling is summarized in , where the residues are color-coded as white or black depending on whether they reside on the internal or the external face of TMS VI with respect to the interior of the protein, respectively. In detail the data extracted from the EPR spectra are color-coded in white or black according to oxygen accessibility, respectively high or low, as already done in other works Citation[15].
Table I. Residue orientation of the OGC TMS VI.
Overall the above results are in agreement with the orientations of residues of TMS VI inferred from the homology model, except for A287, L289, P291, F297 and I298. One of the features of TMS VI is the presence of Pro291, which is not found in the sequence of the TMS VI of AAC although it is found in many other members of the MCF Citation[26]. The EPR data of P291 are very particular. Indeed the spin-labeled P291C has both very low O2-accessibility and very low NiEDDA-accessibility, indicating that label is not accessible to both paramagnetic perturbants. We propose that this residue is facing the lipids since the transport activity is significant before and after the labeling and it has been recently shown that amino acids which face lipids can be replaced with Cys without affecting the translocation Citation[12]. In line with the homology model, P291 protrudes towards TMS V and the lipids. P291 most likely causes a local deformation of the TMS VI at the level of L289, also aided by the presence of G290 that is not highly conserved ( and ). In the model the main chain of L289 is facing the cavity, but its side chain is located close to the lipidic surface behind the side chain of R288, compressed by R288, Y285 and P291 (B). In line, following the EPR data, the L289 spin-label faces the lipids, as indicated by its rather high O2-accessibility and mobility values. The presence H-bonds between R288, Y285 and T293, observed in the model, contribute to the deformation of TMS VI at the level of L289, making the residue R288 more available for the interaction with substrates. It has already been shown that R288 is part of the common substrate binding site for the two main OGC substrates, oxoglutarate and malate Citation[27]. In the case of Arg288 O2- and NiEDDA-accessibilities data were not determined because the EPR signal of R288C is too weak to be appropriately analyzed. We can, however, confidently locate this conserved arginine in the carrier channel on the basis of the mobility data (A) and the observation that it is essential for the transport activity Citation[9].
Figure 4. Panel A: 3D model of OGC TMS VI in cartoon and sticks representation depicted with VMD 1.8.5. The H-bonds between R288, Y285 e T293 residues and the segment deformation at the level of L289 (orange) are highlighted. Panel B: Surface representation of R288, T293, Y285 (blue) and P291 (yellow) shows more evidently its steric hindrance causing the deformation around L289. This Figure is reproduced in colour in Molecular Membrane Biology online.
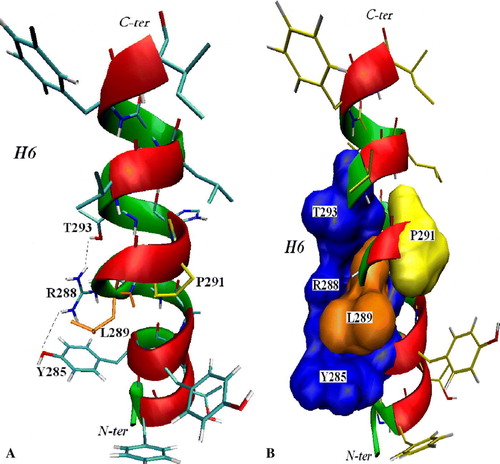
Figure 5. Views of TMS VI and nearby helices H1 and H5. Panel A: Outside view, with the lipophylic face of the segment in the foreground. Panel B: Inside view showing the face pointing to the cavity of the carrier. Mainchains of residues in the cartoon are colored red when facing the membrane and green when facing the cavity. Nearby helices H1 and H5 are represented as cartoons and colored in cyan. VMD 1.8.5 Citation[29] was used for the rendering. This Figure is reproduced in colour in Molecular Membrane Biology online.
![Figure 5. Views of TMS VI and nearby helices H1 and H5. Panel A: Outside view, with the lipophylic face of the segment in the foreground. Panel B: Inside view showing the face pointing to the cavity of the carrier. Mainchains of residues in the cartoon are colored red when facing the membrane and green when facing the cavity. Nearby helices H1 and H5 are represented as cartoons and colored in cyan. VMD 1.8.5 Citation[29] was used for the rendering. This Figure is reproduced in colour in Molecular Membrane Biology online.](/cms/asset/4e8ebe17-a6e7-4f2d-9652-ea3729e5eff8/imbc_a_285997_f0005_b.jpg)
Supplementary Figure 1. ΔH−1 values drawn as filled squares along with their corresponding errors, in correspondance of all the residues examined. The data were well fitted with a sine wave of 3.1 period (black filled curve) but not with the value of 3.6 (red dashed curve), the ideal alpha helix periodicity value.
The other two discrepancies can be explained by observing that Cys-mutations and its further labeling with the large MTSL can cause a local perturbation that may lead to the reorientation of their side chains. This can be the case for A287, that in the model points towards the lipids, but the mutant protein bearing this mutation is strongly inhibited when labeled with MTSL. Moreover the EPR signal coming from this label is diagnostic of a low accessibility to oxygen indicating that it may position itself towards the cavity, thus sterically inhibiting transport. In a similar way F297 is in a position where the labeling can influence its relative accessibility. In the model the side-chain is facing helix 1, albeit pointing towards the channel; instead the EPR data show it as accessible to oxygen. It must be also noted that the Cys mutation nearly abolishes transport, but after labeling the activity is restored significantly.
EPR data show a region of amino acids next to the N-terminal from G281C to Y286C which display a mean NiEDDA-accessibility that is lower than for residues near the C-terminal. The medium-low accessibility of the N-terminal of the segment and the relatively higher accessibility of the C-terminal part suggests that the channel is partially closed at the matrix side and more opened at the cytoplasmatic side. These results indicate that we are likely probing a carrier conformation resembling the one determined by X-ray diffraction of the AAC in presence of CATR Citation[4] that corresponds to the c-state of the carrier Citation[28]. In the C-terminal region two residues at the end of the segment, T296C and I298C, exhibit a large accessibility to NiEDDA, having a ΠNiEDDA values of 0.7 and 1.7 respectively. In the case of T296C the high accessibility of the NiEDDA is in agreement with its low O2-accessibility as shown in B. On the other hand I298C displays some accessibility to O2 as well (B). This latter observation can be explained if this residue is quite mobile, partially exposed to the cavity on the cytoplasmic side and in contact with the lipid bilayer in a relatively open region, making the residue accessible both to the hydrophobic and the hydrophilic paramagnetic quencher.
In the diagram of NiEDDA-accessibility there is a clear separation at the level of Y286C between mean values of ΠNiEDDA of residues at the starting positions of TMS VI and other residues of the α-helix. In the model, built using as template the crystallized AAC Citation[25], it is possible to see more spatial constraints in the region next to the N-terminal of the TMS VI when compared to the region next to the C-terminal. Indeed the model shows that the first helical turn, between G281 and Y285 is at the same level of the salt bridge network, which keeps together odd helices, closing the carrier at the matrix side. Moreover G281 and adjacent residues have many physical constraints. G281 corresponds to the second G of the conserved motif [D/E]-G-X-X-X-X-[Y/W]-[K/R]-G, present in all the proteins of MCF and connects the third loop to H6. G281 and nearby residues could play an important role in modulating the conformational changes of the carrier. Activity data also show a more pronounced sensitivity in the region next to N-terminal (), especially after the introduction of the label, likely because of its steric hindrance. Thus the carrier may not translocate the substrate anymore likely because of new stabilizing interactions with the substrate itself and/or with neighbouring helices H1 and H5 (see ). These modifications may be better tolerated in the less densely packed C-terminal region.
In conclusion we have identified the VI transmembrane segment of OGC as an α-helix, with a high degree of amphipathicity and that it is less densely packed towards its C-terminal region. The helix is distorted above the conserved R288, likely by a proline residue conserved in the carriers transporting amino acids, dicarboxylic acids and ketoacids. This work puts together another piece of the puzzle in the quest for elucidating the structure-function relationship of the mitochondrial oxoglutarate/malate carrier.
Acknowledgements
This work was supported in part by grants FIRB 2001 and COFIN 2006 “Structure and biogenesis of mitochondrial transport proteins” issued by Ministero della Università e Ricerca, and by grants from Ministero della Sanità and the University of Bari.
References
- Kramer R, Palmieri F. Metabolite carriers in mitochondria. Molecular mechanisms in bioenergetics, L Ernster. Elsevier Science Publishers, Amsterdam 1992; 359–384
- Palmieri F. Mitochondrial carrier proteins. FEBS Lett 1994; 346: 48–54
- Kunji ER, Harding M. Projection structure of the atractyloside-inhibited mitochondrial ADP/ATP carrier of Saccharomyces cerevisiae. J Biol Chem 2003; 278: 36985–36988
- Pebay-Peyroula E, Dahout-Gonzalez C, Kahn R, Trezeguet V, Lauquin GJ, Brandolin G. Structure of mitochondrial ADP/ATP carrier in complex with carboxyatractyloside. Nature 2003; 426: 39–44
- Runswick MJ, Walker JE, Bisaccia F, Iacobazzi V, Palmieri F. Sequence of the bovine 2-oxoglutarate/malate carrier protein: structural relationship to other mitochondrial transport proteins. Biochemistry 1990; 29: 11033–11040
- Bisaccia F, Capobianco L, Brandolin G, Palmieri F. Transmembrane topography of the mitochondrial oxoglutarate carrier assessed by peptide-specific antibodies and enzymatic cleavage. Biochemistry 1994; 33: 3705–3713
- Fiermonte G, Walker JE, Palmieri F. Abundant bacterial expression and reconstitution of an intrinsic membrane-transport protein from bovine mitochondria. Biochem J 1993; 294: 293–299
- Stipani V, Cappello AR, Daddabbo L, Natuzzi D, Miniero DV, Stipani I, Palmieri F. The mitochondrial oxoglutarate carrier: cysteine-scanning mutagenesis of transmembrane domain IV and sensitivity of Cys mutants to sulfhydryl reagents. Biochemistry 2001; 40: 15805–15810
- Cappello AR, Curcio R, Miniero DV, Stipani I, Robinson AJ, Kunji ER, Palmieri F. Functional and structural role of amino acid residues in the even-numbered transmembrane alpha-helices of the bovine mitochondrial oxoglutarate carrier. J Mol Biol 2006; 363: 51–62
- Castiglione-Morelli MA, Ostuni A, Pepe A, Lauria G, Palmieri F, Bisaccia F. Solution structure of the first and second transmembrane segments of the mitochondrial oxoglutarate carrier. Mol Membr Biol 2004; 21: 297–305
- Castiglione-Morelli MA, Ostuni A, Croce F, Palmieri F, Bisaccia F. Solution structure of the fifth and sixth transmembrane segments of the mitochondrial oxoglutarate carrier. Mol Membr Biol 2005; 22: 191–201
- Cappello AR, Miniero DV, Curcio R, Ludovico A, Daddabbo L, Stipani I, Robinson AJ, Kunji ER, Palmieri F. Functional and structural role of amino acid residues in the odd-numbered transmembrane (α-helices of the bovine mitochondrial oxoglutarate carrier. J Mol Biol 2007; 369: 400–412
- Perozo E, Cortes DM, Cuello LG. Three-dimensional architecture and gating mechanism of a K+ channel studied by EPR spectroscopy. Nat Struct Biol 1998; 5: 459–469
- Gross A, Columbus L, Hideg K, Altenbach C, Hubbell WL. Structure of the KcsA otassium channel from Streptomyces lividans: a site-directed spin-labeling study of the second transmembrane segment. Biochemistry 1999; 38: 10324–10335
- Kaplan RS, Mayor JA, Kotaria R, Walters DE, McHaourab HS. The yeast mitochondrial citrate transport protein: determination of secondary structure and solvent accessibility of transmembrane domain IV using site-directed spin-labeling. Biochemistry 2000; 39: 9157–9163
- Altenbach C, Klein-Seetharaman J, Cai K, Khorana HG, Hubbell WL. Structure and function in rhodopsin: mapping light-dependent changes in distance between residue 316 in helix 8 and residues in the sequence 60-75, covering the cytoplasmic end of helices TM1 and TM2 and their connection loop CL1. Biochemistry 2001; 40: 15493–15500
- Cuello LG, Cortes DM, Perozo E. Molecular architecture of the KvAP voltage-dependent K+ channel in a lipid bilayer. Science 2004; 306: 491–495
- Morozzo della Rocca B, Lauria G, Venerini F, Palmieri L, Polizio F, Capobianco L, Stipani V, Pedersen J, Cappello AR, Desideri A, Palmieri F. The mitochondrial oxoglutarate carrier: structural and dynamic properties of transmembrane segment IV studied by site-directed spin-labeling. Biochemistry 2003; 42: 5493–5499
- Phelps A, Briggs C, Mincone L, Wohlrab H. Mitochondrial phosphate transport protein. replacements of glutamic, aspartic, and histidine residues affect transport and protein conformation and point to a coupled proton transport path. Biochemistry 1996; 35: 10757–10762
- Altenbach C, Greenhalgh DA, Khorana HG, Hubbell WL. A collision gradient method to determine the immersion depth of nitroxides in lipid bilayers: application to spin-labeled mutants of bacteriorhodopsin. Proc Natl Acad Sci USA 1994; 91: 1667–1671
- Columbus L, Hubbell WL. A new spin on protein dynamics. Trends Biochem Sci 2002; 27: 288–295
- Altenbach C, Yang K, Farrens DL, Farahbakhsh ZT, Khorana HG, Hubbell WL. Structural features and light-dependent changes in the cytoplasmic interhelical E-F loop region of rhodopsin: a site-directed spin-labeling study. Biochemistry 1996; 35: 12470–12478
- Mchaourab HS, Lietzow MA, Hideg K, Hubbel WL. Motion of the spin-labeled side chains in T4 lysozyme. Correlation with protein structure and dynamics. Biochemistry 1996; 35: 7692–7704
- Koteiche HA, Reeves MD, McHaourab HS. Structure of the substrate binding pocket of the multidrug transporter EmrE: site-directed spin-labeling of transmembrane segment 1. Biochemistry 2003; 42: 6099–6105
- Morozzo Della Rocca B, Miniero DV, Tasco G, Dolce V, Falconi M, Ludovico A, Cappello AR, Sanchez P, Stipani I, Casadio R, Desideri A, Palmieri F. Substrate-induced conformational changes of the mitochondrial oxoglutarate carrier: a spectroscopic and molecular modelling study. Mol Membr Biol 2005; 22: 443–452
- Jezek P, Jezek J. Sequence anatomy of mitochondrial anion carriers. FEBS Lett 2003; 534: 15–25
- Robinson AJ, Kunji ER. Mitochondrial carriers in the cytoplasmic state have a common substrate binding site. Proc Natl Acad Sci USA 2006; 103: 2617–2622
- Klingenberg M, Mayer I, Dahms AS. Interaction of fluorescent adenine nucleotide derivatives with the ADP/ATP carrier in mitochondria. 2. [5-(Dimethylamino)-1-naphthoyl]adenine nucleotides as probes for the transition between c and m states of the ADP/ATP carrier. Biochemistry 1984; 23: 2442–2449
- Humphrey W, Dalke A, Schulten K. VMD: visual molecular dynamics. J Mol Graph 1996; 14: 33–38