Abstract
Solid-state nuclear magnetic resonance (SSNMR) spectroscopy is used for the first time to examine the relative substrate-binding affinities of mutant forms of the Escherichia coli sugar transporter GalP in membrane preparations. The SSNMR method of 13C cross-polarization magic-angle spinning (CP-MAS) is applied to five site-specific mutants (W56F, W239F, R316W, T336Y and W434F), which have a range of different sugar-transport activities compared to the wild-type protein. It is shown that binding of the substrate D-glucose can be detected independently of sugar transport activity using SSNMR, and that the NMR peak intensities for uniformly 13C-labelled glucose are consistent with wild-type GalP and the mutants having different affinities for the substrate. The W239F and W434F mutants showed binding affinities similar to that of the wild-type protein, whereas the affinity of glucose-binding to the W56F mutant was reduced. The R316W mutant showed no detectable binding; this position corresponds to the second basic residue in the highly conserved (R/K)XGR(R/K) motif in the major facilitator superfamily of transport proteins and to a mutation in human GLUT1 found in individuals with GLUT1-deficiency syndrome. The T336Y mutant also showed no detectable binding; this mutation is likely to have perturbed helix structure or packing to an extent that conformational changes in the protein are hindered. The effects of the mutations on substrate-binding are discussed with reference to the putative positions of the residues in a 3D homology model of GalP based on the X-ray crystal structure of the E. coli glycerol-3-phosphate transporter GlpT.
| Abbreviations | ||
| CP-MAS | = | cross-polarization magic-angle spinning |
| CPPI | = | cross-polarization with polarization inversion |
| MFS | = | major facilitator superfamily |
| OPA | = | Organophoshate:Phosphate Antiporter |
| SDS-PAGE | = | sodium dodecyl sulphate polyacrylamide gel electrophoresis |
| SSNMR | = | solid-state 13C nuclear magnetic resonance |
| SP | = | Sugar Porter |
| TM | = | transmembrane helix |
| WT | = | wild-type |
Introduction
Transport proteins facilitate the movement of a diverse range of metabolites and other solutes across the lipid membranes of all living organisms. Their functions range from capturing nutrients for uptake into bacterial cells, to providing routes of entry for drugs into human cells and tissues Citation[1]; they are also involved in ATP synthesis, environmental sensing and the removal of toxins from cells Citation[2–4]. However, knowledge about how membrane transport proteins recognise and interact with specific substrates remains limited, because of the difficulties of applying the experimental techniques (X-ray crystallography, solution-state NMR spectroscopy) that are typically used to provide high-resolution structural details in the case of water-soluble proteins. To date, only 11 unique high-resolution structures of such α-helical transport proteins have been determined by X-ray crystallography, four with native substrate bound Citation[5].
Solid-state nuclear magnetic resonance (SSNMR) is a versatile technique for obtaining details about the conformation, dynamics and the microenvironment of isotopically-enriched ligands bound to proteins embedded in their native membranes. An important advantage of SSNMR is that site-specific information can be obtained from functional proteins in situ in fluid (i.e., non-frozen, non-crystalline) membranes. For example, the SSNMR technique of cross-polarization magic-angle spinning (CP-MAS) has provided quantitative information about ligand binding affinities for overexpressed proteins embedded in natural lipid membranes Citation[6–8]. The method exploits differences in molecular dynamics of the ligand in the free and bound environments to detect signals only from 13C-ligand associated with the membrane components. With appropriate control experiments using competitive ligands it is possible to assign peaks in the NMR spectrum to ligands or substrates bound to a specific protein. The first application of this approach to a transport protein was on the Escherichia coli galactose-H+ symport protein, GalP Citation[9], a member of the major facilitator superfamily (MFS) Citation[10] and, importantly, a structural and functional homologue of the GLUT family of human sugar transporters Citation[11]. The GalP protein has 464 amino acid residues, a molecular weight of 52 kDa and forms twelve putative membrane-spanning α-helices, so is a challenging protein on which to perform NMR experiments.
The aim of the work here was to identify specific residues of GalP that influence substrate recognition, by observing the effects of site-specific mutations on the binding of the substrate D-glucose. The selected mutants (W56F, W239F, R316W, T336Y and W434F) have a range of different sugar transport properties compared with the wild-type (WT) protein, which have been determined by measurement of radiolabelled substrate uptake into energized whole cells () Citation[12]. The transport activities of the mutants range from one (R316W) for which transport is abolished, corresponding to a mutation in GLUT1 (R333W) found in the blood-brain barrier of children with GLUT1-deficiency syndrome Citation[13], to others (W56F, W239F and W434F) with transport activities similar to the WT protein. The T336Y mutant was constructed to change the residue in GalP to that found at the corresponding position in the homologous E. coli arabinose transporter AraE. GalP and AraE share 64% amino acid sequence identity Citation[14], Citation[15]; residues specific to one or the other protein may be important for their selective abilities to bind/transport hexose and pentose sugars, respectively, and T336 is in a region of the protein (transmembrane helix (TM) 9 and TM10) possibly involved in sugar selectivity and the binding of inhibitors Citation[16], Citation[17].
Table I. Transport properties of wild-type and mutant forms of GalP. Transport activities are from the measurement of [3H]-D-galactose uptake into energised whole cells expressing WT GalP or mutants. Vmax:Km ratios were taken as a measure of transport efficiency. The data are taken from Reference Citation[12]a and G. Psakis, S. A. Baldwin & P. J. F. Henderson (unpublished work)b.
To investigate substrate recognition it is important to distinguish the effects of specific mutations on substrate binding from their effects on substrate transport: single mutations may disable the mechanism for substrate transport without preventing substrate binding. Previously, the affinities of substrate binding could not be measured easily for GalP because binding is weak (millimolar Kd) and there were no direct and reliable conventional biochemical assays available for this type of protein. Here we exploit 13C CP-MAS SSNMR to determine the relative affinities of the WT and mutant forms of the protein, in native E. coli membrane preparations, for uniformly 13C-labelled D-glucose, a weak-binding substrate. It is shown that the site-specific mutations of GalP have, in some cases, substantial effects on the binding affinities for the sugar substrate.
Materials and methods
Membrane preparation
E. coli strain JM1100 with the plasmid pPER3(His6) for expressing WT GalP with a His6-tag or with the genetically modified plasmid for expressing the relevant mutant form of the protein Citation[12] (and G. Psakis, S. A. Baldwin & P. J. F. Henderson, unpublished work) was grown in minimal medium containing 28 mM D-glucose, as described previously Citation[18], in batch culture or in a 30-l fermenter (Applikon). E. coli cells were disrupted using a French press (Sim Aminco) or by using a cell disruptor (Constant Cell Disruption Systems) followed by separation of inner/outer membranes by sucrose-density gradient ultracentrifugation Citation[18]. The inner membrane fraction was washed three times by resuspension in 20 mM Tris-HCl buffer (pH 7.5) followed by ultracentrifugation, resuspension in the same buffer and storage at -80°C after rapid freezing. The total protein concentration in the final suspensions was determined by the method of Schaffner and Weissmann Citation[19] and the % GalP content was estimated by densitometric analysis on the proteins resolved by SDS-PAGE and stained with Coomassie Brilliant Blue.
NMR sample preparation
NMR measurements were performed on E. coli inner membrane preparations that contained ∼5 mg (100 nmoles) GalP protein at a concentration of ∼1 mM. The membranes were suspended to 3 ml in 20 mM Tris-HCl buffer (pH 7.5) with D-[U-13C6]glucose (99% 13C; Cambridge Isotope Laboratories) at a concentration of 10 mM and with brief vortexing to mix the sample, followed by incubation at 4 °C for 30 min. When used, forskolin (2 mM) was pre-incubated with membrane samples for 30 min at 4 °C before adding the labelled glucose. The membranes were collected by ultracentrifugation (100,000 g) and then packed into a MAS NMR sample rotor (4 mm external diameter) using a brief slow spin in a bench-top centrifuge.
NMR methods
CP-MAS NMR experiments were performed at 4 °C using a Bruker Avance 400 spectrometer equipped with a double-resonance solid-state MAS probe tuned to 100.13 MHz for 13C and 400.1 MHz for 1H. A sample spinning frequency of 4 kHz was used throughout and spectra were acquired with 3072 scans. Proton field strengths of 63 kHz for cross-polarization, over contact times ranging from 1–10 msec, and 85 kHz for continuous wave proton decoupling during the acquisition period were used. Cross-polarization with polarization inversion (CPPI) experiments were performed after the procedure of Wu and Zilm Citation[20] and as described by us previously Citation[7], using a contact time of 10 msec and an inversion time of 40 µs. Chemical shifts were referenced to adamantane at 37.8 ppm and spectra were processed with 40 Hz exponential line broadening.
Homology modelling
A homology model of GalP was constructed using Modeller version 8.2 Citation[21] and the crystal structure of E. coli GlpT Citation[22] (PDB accession 1PW4) as the structural template. Alignment of the GalP and template sequences was guided by comparisons of the patterns of residue conservation and hydrophobicity in 122 homologues of GalP in the Sugar Porter (SP) Family of the MFS and 100 homologues of GlpT in the Organophosphate:Phosphate Antiporter (OPA) family of the MFS. One hundred models were generated, and the five of lowest energy were further analysed using MolProbity Citation[23]. That selected for detailed analysis had 98.3% of residues in the allowed regions of the Ramachandran plot. Mutants were generated from the model in silico using PyMOL Citation[24], which was also used to create the images shown in and 5.
Results
Expression levels
NMR measurements were performed on WT and mutant forms of GalP after their amplified expression in native E. coli inner membrane preparations. SDS-PAGE separation of the proteins and densitometric analysis showed that GalP was expressed at similar levels in the different membrane samples (). Based on the total protein content and the percentage contribution of GalP in the samples, the final concentration of GalP in membranes packed into the NMR sample rotor was approximately 1 mM in all cases. The NMR measurement of glucose-binding was therefore performed under equivalent conditions on the different membrane samples.
Figure 1. SDS-PAGE analysis of E. coli inner membrane preparations from cells expressing WT and mutant forms of GalP. The arrow indicates the position of GalP and the % expression of GalP in the different samples determined by densitometric analysis of the gel stained with Coomassie Brilliant Blue is as follows: WT (40%), W56F (32%), W239F (32%), R316W (38%), T336Y (35%) and W434F (40%).
Binding of D-[U-13C]glucose by wild-type GalP using CP-MAS NMR
a shows a 13C CP-MAS spectrum (contact time 5 msec) of WT GalP-enriched E. coli membranes containing 10 mM D-[U-13C]glucose. Above the background signal, due to the naturally abundant 13C content of the lipids and proteins, can be seen peaks from all carbon positions in the labelled substrate. The two peaks at 92 ppm and 96 ppm, which conveniently do not overlap with any in the background signal, are signatures corresponding to C-1 for, respectively, the α- and β-anomers of glucose in their equilibrium ratio of 0.36:0.63 Citation[25], where the hydroxyl group at C-1 in the β-isomer occupies the preferred equatorial position on the sugar ring.
Figure 2. 13C solid-state NMR experiments to detect the interactions of D-[U-13C]glucose with GalP in E. coli inner membrane preparations. (a) A CP-MAS spectrum of membranes containing WT GalP and 10 mM substrate. The peaks for glucose (inset) are labelled according to the numbering system for the chemical structure; PC indicates the peak for the membrane phosphatidylcholine N-CH3 groups. (b) A CPPI spectrum of the same sample.
![Figure 2. 13C solid-state NMR experiments to detect the interactions of D-[U-13C]glucose with GalP in E. coli inner membrane preparations. (a) A CP-MAS spectrum of membranes containing WT GalP and 10 mM substrate. The peaks for glucose (inset) are labelled according to the numbering system for the chemical structure; PC indicates the peak for the membrane phosphatidylcholine N-CH3 groups. (b) A CPPI spectrum of the same sample.](/cms/asset/145eb8b3-af67-45f0-a1f4-44e3671be7a5/imbc_a_337363_f0002_b.gif)
Discrimination of D-[U-13C]glucose and membrane signals using cross-polarization with polarization inversion (CPPI)
b shows a CPPI NMR spectrum for the same WT GalP sample containing 10 mM D-[U-13C]glucose (as in a). In the CPPI experiment a short, polarization-inverting spin-lock period is applied to the 13C and 1H spins following the initial contact time. The NMR peak intensities for the 13C spins are modulated according to the magnitude of the field generated by the local 1H spin reservoir, becoming negative in intensity at long inversion periods or when the 1H-13C dipolar interactions are strong. The peak intensities are thus sensitive to molecular dynamics, which attenuate the 1H-13C dipolar interactions; peak intensities for highly mobile species remain positive at longer inversion periods whereas the peaks for more restrained species are inverted. An inversion time was selected so as to invert or abolish the peaks from the lipids and proteins as well as any other species retained by the membranes and, by association, undergoing similar anisotropic motions. Under these conditions the peaks from glucose remain positive, indicating that the D-[U-13C]glucose substrate is highly mobile and/or in fast exchange between the free and bound environments.
Dynamic properties of D-[U-13C]glucose in wild-type GalP and mutant membranes
The above conclusion is supported by the normalized cross-polarization (CP) build-up curve for glucose in the WT GalP membranes, measured from the peak intensity for C-5 of the β-isomer at contact times ranging from 1–10 msec (a). The curves are essentially linear within this range, indicating that the rates of CP build-up are slow and rotating frame relaxation times (T1ρ) are long. These characteristics have been seen for other weakly-binding substrates of transport proteins Citation[7], Citation[26], Citation[27] and are consistent with the substrate molecules having short residency times within the binding site, during which cross-polarization occurs, before dissociating into the aqueous environment where T1ρ is on the order of seconds. The build-up curves for glucose in membranes enriched in the GalP mutants are also linear (b–f), indicating that the substrate has roughly the same dynamic properties as in the WT GalP membranes.
Figure 3. Cross-polarization (CP) build-up curves measured from the peak intensities for C-5 of glucose (10 mM) in membranes containing: (a) WT GalP or the mutants (b) W239F, (c) W434F, (d) W56F, (e) T336Y and (f) R316W. The concentration of GalP is approximately 1 mM in all samples. Peak intensities are normalized to the intensity for each sample at a contact time of 10 msec. Error bars represent the level of the noise.
Relative affinities of wild-type and mutant forms of GalP for binding D-[U-13C]glucose
A consequence of the linearity of CP build-up is that the peak intensities at contact times of up to 10 msec are in principle proportional to the affinity of glucose for WT GalP and the mutant forms when the spectra have been corrected for small variations in sample size (by normalizing to the background signals). a shows the spectrum of the WT GalP sample (at a contact time of 10 msec) with 10 mM D-[U-13C]glucose, superimposed on the spectrum of a second WT GalP/glucose sample after scaling to match the background lipid/protein signal intensities for the two samples. The spectra confirm that the intensity of the peaks for the substrate can be reproduced, within the level of the noise, for different membrane samples enriched in the same form of GalP (WT in this case). Comparison of the WT spectrum with spectra for the GalP mutant samples (b–f) reveals some variation in the total (T) absolute peak intensities for D-[U-13C]glucose, which reflects differences in the relative affinities for the substrate by the different mutants. Mutants W239F and W434F show substrate peak intensities similar to those for the WT sample, whereas for W56F, T336Y and R316W the peak intensities are clearly lower.
Figure 4. 13C CP-MAS NMR spectra (obtained with a contact time of 10 msec) of E. coli inner membrane preparations containing: (a) WT GalP or the mutants (b) W239F, (c) W434F, (d) W56F, (e) T336Y and (f) R316W, all with 10 mM D-[U-13C]glucose. Each spectrum was obtained with 3072 scans over 52 min. In each panel the spectra for the total binding of D-[U-13C]glucose (T = specific + non-specific binding) in WT or mutant GalP membranes (left) are shown normalized to the background signal intensity (in the 10–80 ppm and 160–180 ppm frequency ranges) so as to achieve the closest correspondence of the background signals in each spectrum. The right spectrum in each panel (S = specific binding) shows peaks only from D-[U-13C]glucose bound specifically to GalP. These were obtained by subtracting from each scaled spectrum (representing specific + non-specific binding on the left) the spectrum of the same samples obtained after incubation in the presence of the inhibitor forskolin (2 mM) to block glucose from the specific binding site in GalP (representing non-specific binding). The residual peak intensities thus reflect the binding affinities of WT GalP and the mutant forms for D-glucose.
![Figure 4. 13C CP-MAS NMR spectra (obtained with a contact time of 10 msec) of E. coli inner membrane preparations containing: (a) WT GalP or the mutants (b) W239F, (c) W434F, (d) W56F, (e) T336Y and (f) R316W, all with 10 mM D-[U-13C]glucose. Each spectrum was obtained with 3072 scans over 52 min. In each panel the spectra for the total binding of D-[U-13C]glucose (T = specific + non-specific binding) in WT or mutant GalP membranes (left) are shown normalized to the background signal intensity (in the 10–80 ppm and 160–180 ppm frequency ranges) so as to achieve the closest correspondence of the background signals in each spectrum. The right spectrum in each panel (S = specific binding) shows peaks only from D-[U-13C]glucose bound specifically to GalP. These were obtained by subtracting from each scaled spectrum (representing specific + non-specific binding on the left) the spectrum of the same samples obtained after incubation in the presence of the inhibitor forskolin (2 mM) to block glucose from the specific binding site in GalP (representing non-specific binding). The residual peak intensities thus reflect the binding affinities of WT GalP and the mutant forms for D-glucose.](/cms/asset/95d11a20-2435-4e69-bc0f-b8e790bf2c13/imbc_a_337363_f0004_b.gif)
Previous control experiments have shown that at a substrate concentration of 10 mM the 13C NMR peaks arise exclusively from glucose interacting with GalP when the contact time is short (2 msec) Citation[28–30]. Here, a longer contact time was used to maximise the signal to noise ratio that could be obtained over a practicable experimental period (<2 h), but, consequently, unwanted contributions to the signal were introduced from non-specifically bound substrate. These contributions were eliminated by subtracting from each spectrum a second spectrum obtained from the same sample but after the addition of the inhibitor forskolin to displace glucose from the specific binding site in GalP, leaving non-specifically bound glucose (the forskolin-binding affinities of the mutants, determined by fluorimetric and equilibrium dialysis measurements in inner membranes are similar to that of the WT protein Citation[12] (and G. Psakis, S. A. Baldwin & P. J. F. Henderson, unpublished work). Peaks in the difference spectrum can thus be ascribed to substrate interacting exclusively with GalP. The corrected spectra (denoted S, for specific binding, in ) indicate that the peak intensities for the W239F and W434F mutants are similar to those for the wild-type protein, the peak intensities for the W56F mutant are smaller, and that there is virtually no signal corresponding to specifically bound substrate in the T336Y and R316W mutant samples. For the W56F mutant, the glucose signals in the difference spectrum (S) are close to the noise level, but there are clearly signals for C-1(β), C-5 and C-6, which are more obvious when the spectrum is compared with the WT difference spectrum above, to see the chemical shift positions of signals, and when compared with the difference spectra for the mutants (T336Y and R316W) that show no detectable binding. Thus it is reasonable to conclude that the WT, W239F and W434F forms of GalP have roughly similar affinities for glucose, W56F has lower affinity and virtually no binding occurs to R316W and T336Y. These conclusions are supported by comparison of integral values from the D-[U-13C]glucose-binding region of the background normalized spectra, which also demonstrate the reproducibility/noise level of the measurements ().
Figure 5. Integral values for total binding of D-[U-13C]glucose (T) and for D-[U-13C]glucose bound specifically to WT GalP and the 5 mutants (S). Integration of background normalized spectra was performed over the entire resonance frequency range for D-[U-13C]glucose from 55–100 ppm. For the WT protein, T(1) and T(2) represent integrals for total binding of the substrate to 2 membrane samples prepared independently, to show the reproducibility of the measurement.
![Figure 5. Integral values for total binding of D-[U-13C]glucose (T) and for D-[U-13C]glucose bound specifically to WT GalP and the 5 mutants (S). Integration of background normalized spectra was performed over the entire resonance frequency range for D-[U-13C]glucose from 55–100 ppm. For the WT protein, T(1) and T(2) represent integrals for total binding of the substrate to 2 membrane samples prepared independently, to show the reproducibility of the measurement.](/cms/asset/6927f71b-3f5d-4f8b-bf75-a719ca222664/imbc_a_337363_f0005_b.gif)
Discussion
General discussion
We have shown how 13C CP-MAS SSNMR can be used to determine relative substrate affinities for wild-type and mutant forms of the sugar transporter GalP, which can be distinguished from, and compared to, their properties of substrate transport. It is challenging to obtain high-resolution structures (by crystallography or by NMR spectroscopy) of transport proteins like GalP, so it is important to have reliable experimental approaches to examine the effects of site-specific mutations on ligand interactions with the protein for investigating structure-function properties. The solid-state NMR approach described here produces a direct signal for the ligand binding to the transporter, whilst alternative experimental approaches, e.g., fluorescence quenching, provide an indirect measure of ligand binding and so may be less reliable. The experiments are performed on unenergized inner membrane preparations in which the transport cycle of the protein is not functioning as it would in energized whole cells. The signal therefore comes from the ligand binding to the protein and coming off again, without participating in any transport cycle. For GalP, it has been shown that the sugar remains bound to the protein on the NMR time-scale (> 10−1 sec) and so does not exchange rapidly between the bound and free (in solution) environments Citation[9]. The approach offers an important measure of the substrate-binding properties of the protein compared with its transport properties for screening the effects of mutations. For example, if a mutation has caused transport of the sugar to be abolished, the NMR measurements can demonstrate whether or not this is a result of the protein being unable to recognise/bind the sugar at the first stage of the transport cycle.
The mutants of GalP examined here showed varying affinities for glucose, ranging from no detectable binding to full wild-type activity. is a 3D homology model of GalP based on the crystal structure of the E. coli GlpT Citation[22], showing the putative positions of the mutated residues. The model is based on GlpT, rather than on the LacY structure, Citation[31] because the residue positions corresponding to W371 in TM10 and W395 in TM11, which are known to be directly involved in substrate binding/transport, are at positions that would allow direct interaction with the substrate in the model based on GlpT. The model of GalP based on LacY does not allow this.
Figure 6. A 3D model of GalP based on the crystal structure of the E. coli glycerol-3-phosphate transporter GlpT, in a conformation in which the substrate-binding site is open to the cytoplasmic face of the membrane Citation[22]. The putative positions of the residues mutated in the present study are shown, together with tryptophan residues, W371 and W395, predicted to be close to the substrate-binding site. The model is viewed from the periplasmic face (top) and from the side (bottom). In the latter view, the likely approximate boundaries of the lipid bilayer are indicated. This Figure is reproduced in colour in Molecular Membrane Biology online.
![Figure 6. A 3D model of GalP based on the crystal structure of the E. coli glycerol-3-phosphate transporter GlpT, in a conformation in which the substrate-binding site is open to the cytoplasmic face of the membrane Citation[22]. The putative positions of the residues mutated in the present study are shown, together with tryptophan residues, W371 and W395, predicted to be close to the substrate-binding site. The model is viewed from the periplasmic face (top) and from the side (bottom). In the latter view, the likely approximate boundaries of the lipid bilayer are indicated. This Figure is reproduced in colour in Molecular Membrane Biology online.](/cms/asset/440e997e-7117-46fc-a974-17eac6d4159e/imbc_a_337363_f0006_b.jpg)
Mutation of the highly conserved residue arginine-316 impedes sugar-binding
Previous work showed that the R316W mutant has no detectable sugar-transport activity in energized whole cells Citation[12] (and G. Psakis, S. A. Baldwin & P. J. F. Henderson, unpublished work). The current NMR experiments demonstrate that this mutant is also unable to bind D-glucose in unenergized membranes. In the homology model of GalP, R316 is located in the loop connecting TM8 and TM9 on the cytoplasmic side of the membrane, where it possibly interacts with the phospholipid headgroup region of the lipid bilayer. This is well away from the putative substrate-binding site in the protein, so the R316W mutation is almost certainly having an indirect effect on sugar-binding. R316 in GalP corresponds to a highly-conserved arginine residue in the characteristic (R/K)XGR(R/K) motif found in the region between TM8 and TM9 in the MFS proteins, including GalP and human GLUT1 Citation[32]. In the latter, the positive charges have been shown to be critical anchor points for determining the local membrane topology Citation[33]. It is therefore possible that the R316W mutation in GalP has perturbed the membrane topology of the protein to an extent that it can no longer bind the sugar substrate.
Mutation of threonine-336 impedes sugar-binding through perturbation of helix structure or packing
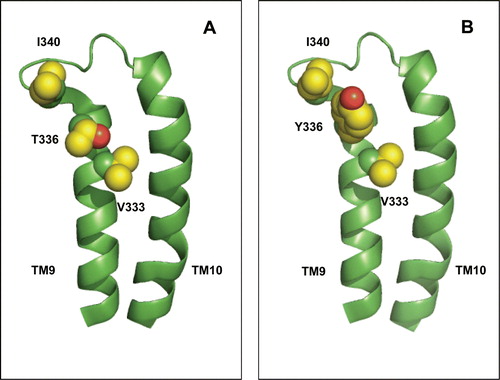
The NMR experiments also detected no definite binding of D-glucose by the T336Y mutant of GalP. This mutant had retained only minimal transport efficiency (6%) compared with WT. In the homology model of GalP, this residue is located close to the presumed periplasmic end of TM9. This position, while non-conserved, is typically occupied by a hydrophobic residue in the 122 SP family members analysed in the present study and its side-chain is predicted to be exposed to the hydrophobic core of the bilayer. In the case of GalP, the hydrogen-bonding capacity of the threonine side-chain is possibly satisfied by bonding to the backbone carbonyl groups of TM9 residue V333. Being remote from the proposed substrate-binding site, the effects of the T336Y mutation on substrate binding and transport are most likely to be the result of indirect perturbations in protein structure. For example, although the mutation can be made in silico without introducing any steric clashes with other residues, the tyrosine side-chain is predicted to be close to the large side-chain of I340 in the loop between TM9 and TM10 (). The corresponding position in AraE is occupied by a residue with a smaller side-chain, Q347. The mutation at position 336 could thus have hindered conformational changes in the protein, perhaps favouring a cytoplasmic-facing conformation that is unable to bind substrate.
Figure 7. Possible interaction between TM9 residue 336 and adjacent parts of the protein. (A) Wild-type protein bearing threonine at position 336. (B) Mutant protein bearing tyrosine at position 336. The predicted location of V333, the backbone carbonyl of which is within H-bonding distance of the T336 side-chain, and of the bulky residue I340 in the TM9-TM10 loop, are indicated. The indicated residues are shown in space-filled representation. This Figure is reproduced in colour in Molecular Membrane Biology online.
Effects of mutating tryptophan residues W56, W239 and W434 on sugar-binding
Unlike tryptophan residues 371 and 395 in GalP, which are involved in direct interactions with the sugar substrate and are essential for transport activity Citation[30], Citation[34] (and G. Psakis, S. A. Baldwin & P. J. F. Henderson, unpublished work), the tryptophan residues (W56, W239 and W434) studied here by NMR spectroscopy appear not to be directly involved and their individual mutations to phenylalanine have more subtle effects on sugar-binding and transport activities. The NMR experiments show a binding affinity of the W56F mutant for glucose that is clearly reduced compared with the WT protein, although the mutant does have similar kinetic properties of transport compared to WT (). This tryptophan is located in a relatively well-conserved hydrophobic position, typically occupied by an aromatic amino acid or leucine, and is expected from the GalP model to be close to the periplasmic end of TM2. Its side-chain is predicted to be exposed to the lipid bilayer and its in silico replacement by phenylalanine resulted in no changes in hydrogen bonding interactions or in helix packing within the model. The W239F and W434F mutants showed glucose-binding affinities similar to that of the WT protein in the NMR experiments. Mutant W239F had shown similar kinetic properties of transport compared to WT protein; in the homology model, this poorly-conserved position is predicted to be located towards the C-terminal end of the large cytoplasmic loop connecting TM6 and TM7, and unlikely to be involved in direct interactions with the substrate. Residue W434 occupies a poorly-conserved position predicted by the GalP model to lie close to the cytoplasmic end of TM12, with its side-chain facing outward to the lipid bilayer. Consistent with its predicted lack of direct interaction with the sugar substrate, the efficiency of transport by the W343F mutant, as measured by the Vmax:Km ratio, was similar to that of the wild-type protein (), as was its ability to bind glucose ().
Conclusions
In summary, we have shown how 13C CP-MAS SSNMR can be used to investigate the effects of site-directed mutagenesis on the substrate-binding affinities of transport proteins expressed in their native membranes. The approach allows substrate-binding activity to be distinguished from transport activity in the mutant proteins for investigating the role of specific residue positions in functional activity. By combining the results of binding and transport measurements with homology modelling, potential residues can be identified for isotopic labelling and SSNMR measurements to probe protein-substrate interactions and binding-site structure.
Acknowledgements
We thank the BBSRC for support of research in the laboratories of P.J.F.H., S.A.B. (under the Membrane Protein Structure Initiative), and D.A.M. and for a PhD studentship to G. P. The work was also supported by the BBSRC as part of the North of England Structural Biology Centre (NESBiC). We thank the EU EMeP consortium for contributions towards the work in the P.J.F.H. laboratory and the EPSRC for an equipment grant to support solid-state NMR at the University of Leeds and the development of a joint solid-state NMR project with the University of Southampton (Professor Malcolm Levitt). We also thank Mr John O'Reilly, Dr Peter Roach and Miss Halina Nobertczak for culturing bacteria in a fermenter and for help with preparations of samples of inner membranes. Declaration of interest: The authors report no conflicts of interest. The authors alone are responsible for the content and writing of the paper.
References
- Henderson PJF. Function and structure of membrane transport proteins. Transporters factsbook, JK Griffith, CE Sansom. Academic Press, London 1997; 3–29
- Hoch JA, Silhavy TJ. 1995. Two-component signal transduction. Washington, DC: ASM Press.
- Weber J, Senior AE. ATP synthesis driven by proton transport in F1F0-ATP synthase. Febs Lett 2003; 545: 61–70
- Saidijam M, Benedetti G, Ren QH, Xu ZQ, Hoyle CJ, Palmer SL, Ward A, Bettaney KE, Szakonyi G, Meuller J, Morrison S, Pos MK, Butaye P, Walravens K, Langton K, Herbert RB, Skurray RA, Paulsen IT, O'Reilly J, Rutherford NG, Brown MH, Bill RM, Henderson PJF. Microbial drug efflux proteins of the major facilitator superfamily. Curr Drug Targets 2006; 7: 793–811
- Membrane proteins of known 3D structure [Internet]. ,Irvine: Department of Physiology and Biophysics Stephen White Laboratory at UC [cited 2008 May 16]. Available from: http://blanco.biomol.uci.edu/Membrane_Proteins_xtal.html.
- Basting D, Lehner I, Lorch M, Glaubitz C. Investigating transport proteins by solid state NMR. N-S Arch Pharmacol 2006; 372: 451–464
- Patching SG, Brough AR, Herbert RB, Rajakarier JA, Henderson PJF, Middleton DA. Substrate affinities for membrane transport proteins determined by 13C cross-polarization magic-angle spinning nuclear magnetic resonance spectroscopy. J Am Chem Soc 2004; 126: 3072–3080
- Boland MP, Middleton DA. Insights into the interactions between a drug and a membrane protein target by fluorine cross-polarization magic angle spinning NMR. Magn Reson Chem 2004; 42: 204–211
- Spooner PJR, Rutherford NG, Watts A, Henderson PJF. NMR observation of substrate in the binding-site of an active sugar-H+ symport protein in native membranes. Proc Natl Acad Sci USA 1994; 91: 3877–3881
- Pao SS, Paulsen IT, Saier MH, Jr. Major facilitator superfamily. Microbiol Mol Biol Rev 1998; 62: 1–34
- Baldwin SA, Henderson PJF. Homologies between sugar transporters from eukaryotes and prokaryotes. Ann Rev Physiol 1989; 51: 459–471
- Psakis G. 2004. The D-galactose-H+ symporter (GalP) from Escherichia coli: Structure-activity relationships [Thesis]. University of Leeds, UK. Available from University of Leeds library.
- Wang D, Kranz-Eble P, De Vivo DC. Mutational analysis of GLUT1 (SLC2A1) in Glut-1 deficiency syndrome. Hum Mutat 2000; 16: 224–231
- Maiden MC, Davis EO, Baldwin SA, Moore DC, Henderson PJF. Mammalian and bacterial sugar-transport proteins are homologous. Nature 1987; 325: 641–643
- Cairns MT, McDonald TP, Horne P, Henderson PJF, Baldwin SA. Cytochalasin B as a probe of protein-structure and substrate recognition by the galactose/H+ transporter of Escherichia coli. J Biol Chem 1991; 266: 8176–8183
- McDonald TP, Walmsley AR, Henderson PJF. Asparagine 394 in putative helix 11 of the galactose-H+ symport protein (GalP) from Escherichia coli is associated with the internal binding site for cytochalasin B and sugar. J Biol Chem 1997; 272: 15189–15199
- Litherland GJ. 1996. Substrate and inhibitor recognition by chimaeric sugar-H+ transport proteins of E. coli [Thesis]. University of Leeds, UK. Available from University of Leeds library.
- Ward A, Sanderson NM, O'Reilly J, Rutherford NG, Poolman B, Henderson PJF. The amplified expression, identification, purification, assay and properties of hexahistidine-tagged bacterial membrane transport proteins. Membrane transport – a practical approach, SA Baldwin. Blackwell, Oxford 2000; 141–166
- Schaffner W, Weissmann C. Rapid, sensitive and specific method for determination of protein in dilute-solution. Anal Biochem 1973; 56: 502–514
- Wu X, Zilm KW. Complete spectral editing in CPMAS NMR. J Magn Reson 1993; 102: 205–213
- Fiser AS, Sali A. MODELLER: Generation and refinement of homology-based protein structure models. Method Enzymol 2003; 374: 461–491
- Huang Y, Lemieux MJ, Song J, Auer M, Wang D-N. Structure and mechanism of the glycerol-3-phosphate transporter from Escherichia coli. Science 2003; 301: 616–620
- Davis IW, Leaver-Fay A, Chen VB, Block JN, Kapral GJ, Wang X, Murray LW, Arendall WB 3rd, Snoeyink J, Richardson JS, Richardson DC. MolProbity: All-atom contacts and structure validation for proteins and nucleic acids. Nucleic Acids Res 2007; 35: W375–383
- DeLano WL. 2002. The PyMOL Molecular Graphics System. DeLano Scientific, Palo Alto, CAUSA. Available from the website: http://www.pymol.org.
- Angyal SJ. Composition and conformation of sugars in solution. Angew Chem Int Edit 1969; 8: 157–226
- Spooner PJR, O'Reilly WJ, Homans SW, Rutherford NG, Henderson PJF, Watts A. Weak substrate binding to transport proteins studied by NMR. Biophys J 1998; 75: 2794–2800
- Xie H, Patching SG, Gallagher MP, Litherland GJ, Brough AR, Venter H, Yao SYM, Ng AML, Young JD, Herbert RB, Henderson PJF, Baldwin SA. Purification and properties of the Escherichia coli nucleoside transporter NupG, a paradigm for a major facilitator transporter sub-family. Mol Memb Biol 2004; 21: 323–336
- Appleyard AN, Herbert RB, Henderson PJF, Watts A, Spooner PJR. Selective NMR observation of inhibitor and sugar binding to the galactose-H+ symport protein GalP, of Escherichia coli. Biochim Biophys Acta 2000; 1509: 55–64
- Patching SG, Herbert RB, O'Reilly J, Brough A, Henderson PJF. Low 13C-background for NMR-based studies of ligand binding using 13C-depleted glucose as carbon source for microbial growth: 13C -labeled glucose and 13C-forskolin binding to the galactose-H+ symport protein GaIP in Escherichia coli. J Am Chem Soc 2004; 126: 86–87
- Patching SG, Henderson PJF, Herbert RB, Middleton DA. Solid-state NMR spectroscopy detects interactions between tryptophan residues of the E. coli sugar transporter GaIP and the alpha-anomer of the D-glucose substrate. J Am Chem Soc 2008; 130: 1236–1244
- Abramson J, Smirnova I, Kasho V, Verner G, Kaback HR, Iwata S. Structure and mechanism of the lactose permease of Escherichia coli. Science 2003; 301: 610–615
- Henderson PJF. The homologous glucose-transport proteins of prokaryotes and eukaryotes. Res Microbiol 1990; 141: 316–328
- Sato M, Mueckler MA. A conserved amino acid motif (R-X-G-R-R) in the GLUT1 glucose transporter is an important determinant of membrane topology. J Biol Chem 1999; 274: 24721–24725
- McDonald TP, Walmsley AR, Martin GEM, Henderson PJF. The role of tryptophans 371 and 395 in the binding of antibiotics and the transport of sugars by the D-galactose-H+ symport protein (GalP) from Escherichia coli. J Biol Chem 1995; 270: 30359–30370