Abstract
The production of diffraction quality crystals for the structural determination of inner membrane proteins relies on obtaining large amounts of stable protein. Achieving this, by finding the correct parameters to successfully express and purify these proteins is often time-consuming and frustrating. The methods described here examine the most important parameters, in both expression and purification, quickly and simply. They take into account methods previously used in successful structural determinations of inner membrane proteins and collect and analyse data for use in further experiments and to investigate overall trends. These methods make use of histidine-tagged membrane proteins with a green fluorescent protein fusion but could be adapted easily for other proteins.
Introduction
Integral membrane proteins are an abundant and important class of proteins. Spanning biological cell membranes, they are involved in a variety of fundamental processes, such as energy conservation, transportation, lipid biosynthesis, signal transduction, and cell recognition. They account for more than 50% of current drug targets and are targeted by approximately 60% of all prescription drugs Citation[1]. However, despite their importance, they are still grossly under-represented in terms of structural knowledge.
To date, (July, 2008) the total number of protein structures in the protein data bank (PDB, Citation[2]) determined by X-ray crystallography is around 43,900. The number for integral membrane protein structures is around 375, with 160 of these being classed as unique Citation[3]. Similar statistics, reported in February 2002 Citation[4] showed 100 entries for integral membrane proteins compared with 13,600 total protein entries. In both cases integral membrane protein structures account for around 0.8% of the total protein structures in the database. Encouragingly, this shows that the structure determination of integral membrane proteins continues to grow exponentially like the structural determination of soluble proteins Citation[5]. However, integral membrane proteins are expected to account for 20–25% of all open reading frames in sequenced genomes Citation[6], suggesting that a great deal of work remains to be done in order for our knowledge of integral membrane protein structures to match that of soluble protein structures.
Solving the three-dimensional structure of a membrane protein is still regarded as a major challenge. However, the increased use of high-throughput (HTP) methods and robotics for crystallization allows small amounts of sample (as little as 0.5 µg per condition) to be tested against a large number of conditions within a very short time frame. However, many of the problems with integral membrane proteins are found upstream of the crystallization process, where a number of the difficulties arise in expressing and purifying large quantities of stable protein. Typically, expressing and isolating recombinant membrane proteins is more challenging than doing so with soluble proteins.
Recombinant expression of membrane proteins often results in low yields or expression in inclusion bodies. T× can be a direct result of toxicity to the host, lack of intrinsic stability or incorrect folding. Successful over-expression of recombinant proteins depends on a variety of parameters including the constructs, cell-lines, media, and growth temperature used.
The isolation of membrane proteins is also problematic because detergent molecules are required for both extraction from the membrane (solubilization) and purification. Choosing the wrong detergent can be detrimental to the experiment as successful purification and crystallization depends on the stability (and crystallizability) of the protein/detergent complex. While finding the correct detergent system is imperative to obtaining membrane protein crystals, other parameters such as the buffer system and pH; purification tags and tag removal; and the choice of purification media and number of purification steps, all play a part in a successful experiment. Since each protein is unique, successful expression and purification systems must be identified for every one and it is important to find a quick, reliable and flexible way to do this.
Integral membrane proteins generally fall into two classes: Alpha-helical (all-alpha) and beta-barrel (all-beta) type proteins. The different classes are generally found in different membranous regions, e.g., in Gram negative bacteria the outer membrane is typically (but not exclusively) made up of all-beta type proteins while the all-alpha proteins are found in the inner (or cytoplasmic) membrane. These two classes of proteins often behave quite differently. The all-beta type proteins are more frequently expressed in inclusion bodies and often require a different subset of detergents for stability than their all-alpha counterparts (See Citation[7] for review on the crystallization of all-beta type proteins).
The Membrane Protein Structure Initiative (MPSi) is particularly interested in recombinantly expressed, inner membrane proteins and as a consequence the methods described in this paper were developed particularly for this subset of proteins. However, they are easily adaptable for other integral membrane proteins. To date, there are around 60 unique, recombinantly expressed, all-alpha type proteins in the PDB Citation[8]. Where available, the methods and materials used to obtain the diffraction quality crystals have been collected and organised in a database (K. McLuskey and N. W. Isaacs, unpublished). The HTP methods described in this paper are based on this data and are used to maximise the possibility of finding successful expression and purification conditions for the protein(s) of choice with several criteria in mind:
To use a simple benchtop HTP system that allows maximum flexibility without the necessity (but allowing for the use) of robotics.
To gather the maximum amount of information, using a small amount of protein, in the shortest time-frame.
To create a standardized, flexible, protocol where the parameters can be easily changed.
To manage data collection in order to allow successful data mining and method development in the future.
To work with several proteins in parallel, if required.
To concentrate on parameters previously successful in obtaining diffraction quality crystals of all-alpha type proteins.
These methods were established using small-scale expression and purification procedures (24, 48 and 96-well systems) and were designed for proteins containing a histidine purification tag (His-tag). They were optimised around protein constructs, generated by HTP methods, consisting of membrane proteins with a tobacco etch virus (TEV) protease cleavage site, a green fluorescent protein (GFP) fusion and C-terminal His8-tag (protein-TEV-GFP-His8) Citation[9], Citation[10]. However, in the absence of GFP, dot-blot analysis with a His-tag specific antibody (see Citation[11] for an example) would allow these methods to be adapted for a wider set of proteins. The methods database (K. McLuskey and N. W. Isaacs, unpublished data) provides information about the parameters used in both the expression and purification of inner membrane proteins that produced diffraction quality crystals. The starting parameters suggested in these protocols are the most common parameters found in this database.
Methods and materials
Expression
Using GFP for overexpressing membrane proteins provides an easily visible and quantitative tool Citation[12], Citation[13] for a process that is often laborious. By collecting fluorescence intensity (FI) data (excitation 485 nm, emission 512 nm), on samples where the optical density at 600 nm (OD600) is < 1.5, there is a direct correlation between the concentration of GFP and the fluorescence signal (F. Kroner, personal communication).
The expression system described here was developed to examine 12 individual proteins (P1–P12), in four different cell lines (C1–C4), using four types of auto-induction media (M1–M4) and two growth temperatures (T1, T2); giving results for 32 expression conditions per protein and a total of 384 results in a relatively short time-frame (less than one week). It was developed for use on the bench and was designed to maximise the use of eight-channel multi-pipettes and 96, 48 and 24-well blocks, where rows are represented alphabetically and columns numerically (A–H and 1–12, respectively for a 96-well block). Additionally, 96-well blocks are divided into four sections: Rows A–D × Columns 1–6, are denoted Section I; E–H × 1–6, Section II; A–D × 7–12, Section III; and E–H × 7–12, Section IV (see (1)). Steps 1–5 in represent the blocks used throughout the process and these steps are, shown in brackets and described, in the text below.
Figure 1. An overall schematic of the expression process using 24, 48 and 96-well systems. (1) Transformation block showing Sections I and II along with the positions of membrane proteins P1–P12 and cell lines C1–C4. (2) 24-well agar plates copying Sections I and II of the transformation block. (3) Block of starter cultures. (4) Two 48-well expression blocks (T1 and T2) grown at two different temperatures T1 and T2, respectively. These were set up for each type of media (M1–M4). (5) Representation of analysis blocks M1–M4, showing the final positions of proteins P1–P12, in cell lines C1–C4, grown at temperatures T1 and T2 (labelled T1 and T2).
The most common cell lines used in producing diffraction quality crystals of all-alpha type proteins were variants of BL21 (DE3) including BL21 pLysS and C41 (DE3) and C43 (DE3) Citation[14]. Since these all belong to the same family it may be useful to test a wider set of strains. The growth media used were LB, TB and Minimal Media, with IPTG being the most common form of induction, and growth temperatures were either 37°C or 22°C. These are suggested as starting parameters for C1–C4, M1–M3 (auto-induction media is suggested as a starting point as it is particularly useful for HTP work and M4 can be chosen separately) and T1, T2, in the protocol.
Transformation
(1) Thaw the competent cells (C1–C4) and assemble a block of 96 microtubes (Transformation Block) (Abgene), on ice. Pipette 10 µl of the competent cells, C1–C4, into Rows A–D respectively of Section I in Transformation block. Repeat with cells C1–C4 into Rows E–H of Section II. Add 1 µl (∼ 20 ng/µl of DNA) of each expression vector, encoding the GFP fusion proteins, P1–P6 and P7–P12, into Columns 1–6 of Sections I and II, respectively (a). Incubate the block on ice for 20 min. Transform the cells by heat-shock, placing the entire block at 42°C for 45 s before returning to ice for 3 min. Add 500 µl of warm (42°C) GS96 media (Qbiogene) to each microtube (containing a transformant), and incubate at 37°C for 1 h (no shaking required).
(2) Using sterile techniques, prepare two 24-well LB agar plates, with the appropriate antibiotics, and prewarm to 37°C. Using a multi-channel pipette, and the same grid system, plate out 10 µl of Transformation block, Section I onto the first agar plate and 10 µl of Section II onto the second ((2)). Incubate the plates at 37°C for 16 h and store at 4°C until required.
Cell growth
(3) Prepare starter cultures by adding 500 µl of GS96 media to Sections I and II of a 96-well deep well block (DWB). Keeping the grid system, pick single colonies from the first agar plate to inoculate starter cultures in Section I, and colonies from the second agar plate to inoculate Section II ((3)). Seal the overnight cultures with a gas permeable adhesive seal (Abgene) and incubate at 37°C at 180 rpm, for 16 h.
(4) Prepare two 48-well expression-blocks (T1 and T2) (Abgene) for each medium M1–M4 (a total of eight blocks M1T1–M4T1 and M1T2–M4T2) by adding 2.5 ml of media to each well. Transfer 50 µl from each well of Sections I and II of the starter culture DWB to M1T1, using an eight-channel multi-pipette. This 48-well block now replicates Sections I and II from the 96-well overnight culture block ((4)). Repeat this inoculation for all eight expression-blocks and incubate at 37°C at 220 rpm. After 4 h, transfer one set of blocks into a separate incubator at temperature T1 (M1T1–M4T1) and place the other set at temperature T2 (M1T2–M4T2). Shake all blocks at 220 rpm for a further 18 h.
(5) To prepare the analysis blocks, take samples from the expression blocks before harvesting the cells. For the blocks containing M1 media transfer 100 µl of each condition from M1T1 into Sections I and II of a 96-well DWB (Analysis block, Block M1). Repeat with M1T2 and Sections III and IV of the same DWB ((5)). Repeat the sample collection, storing Blocks M2–M4. To harvest the cells, spin the expression blocks at 5000 g for 5 min, remove the supernatant and seal. These blocks can be stored at −20°C, if necessary.
Purification
A number of trends were found from analysing information in the methods database (K. McLuskey and N. W. Isaacs, unpublished data). In around 50% of the structures of inner membrane proteins, diffraction quality crystals were obtained from protein that was solubilised using a different detergent than the one used to purify and crystallize it; the detergent-exchange was typically carried out on chromatographic media (size-exclusion or affinity); the majority of purified proteins were obtained from a two-step purification procedure; around 70% of the purification protocols used Tris-HCl as a buffer system (pH range 7.0–8.0); and 90% of the buffer systems contained an additional salt (NaCl or KCl). Using this information the following purification protocol was developed.
The protocol described here purifies 12 different proteins (P1–P12) using a single solubilization detergent (DS) and eight purification detergents (D1–D8) (1 × 8 × 12 = 96 samples, a), but using a 96-well purification system allows for maximum flexibility in experimental design e.g. the system can be adapted to analyse a single protein, using six different solubilization detergents, eight different purification detergents, and two buffer systems (1 × 6 × 8 × 2 = 96); or any combination of the 96 wells.
Figure 2. Sample plates used in the 96-well purification procedure. (a) Standard purification block. This represents the grid system used throughout the 96-well purification procedure. P1–P12 represents 12 different protein samples in columns 1–12. In rows E–H the eight purification detergents D1–D8 are used. (b) Analysis Block 1, used to look for loss of fluorescence during cell lysis, membrane preparation and solubilization. Columns 1–12 contain P1–P12 and rows E–H contain the different samples collected for analysis.
With 12 different proteins, this method tests the impact of different detergents on the purification system; and looks in particular at the ease of purification, the amount of aggregation observed and the final yield of protein. It takes advantage of both the GFP and the cleavable tag to easily track the protein and use a simple two-step purification system. Membrane preparation and solubilization follow standard (non-HTP) procedures, allowing the protein to be split into eight identical samples and providing enough of the final product to assess both the quantity and quality, and hence the success, of the experiment.
To date, n-Dodecyl-β-D-maltoside (DDM) is the solubilization detergent used most successfully in obtaining crystals of inner membrane proteins and it is typically used at concentrations of around 1.5% (w/v). Consequently, DDM is recommended as an initial choice for DS. Additionally, several detergents have been particularly successful in the purification and crystallization of recombinant inner membrane proteins. These include: 0.04% DDM, 1% β-OG (n-Octyl-β-D-glucopyranoside), 0.2% DM (n-Decyl-β-D-maltopyranoside), 0.06% LDAO (lauryl-dimethylamine-N-oxide), 0.4% NG (n-nonyl-β-D-glucopyranoside), 2% β-OM (n-Octyl-β-D-maltopyranoside), 0.05% C12E9 (polyoxyethylene(9)docecyl ether), and 0.05% FC-14 (n-Tetradecylphosphocholine). The percentages used are an average of those used to obtain crystals previously and are suggested as initial detergents D1–D8.
Cell harvesting, membrane preparation and solubilization
Grow 500 ml cultures for proteins P1–P12 using the conditions identified in the expression trials. Harvest the cells by centrifuging at 3500 g for 20 min at 4°C. Collect and weigh the cell pellets, before storing at −20°C, if required. Resuspend the cell pellets in lysis buffer (50 mM Tris-HCl pH 7.5, 50 mM NaCl, 50 U/ml DNase, 1 mM MgCl2 and complete protease inhibitor cocktail EDTA-free [Roche]), using 50 ml of buffer per 10 g of cultured cells. Mechanically lyse the cells using 1–2 passes through a cell disrupter (Constant systems, Ltd) or a French pressure cell at 900 psi. To collect samples for analysis, place a 96-well DWB (Block 1) on ice and collect 10 µl of the lysed cells (P1–P12) in Row A, Columns 1–12, respectively (b).
Transfer the lysed cells to 50 ml polypropylene centrifuge tubes (Corning) and remove unbroken cells and cell debris by centrifugation at 9000 g for 30 min at 4°C saving 10 µl samples of the supernatants in Row B of Block 1. Pour the cleared lysate containing the membranes into ultra-centrifuge tubes and fill the tubes with extra lysis buffer to avoid collapsing, if required. Save a further 10 µl of these samples (Row C, Block 1) and pellet the membranes at 100,000 g for 50 min at 4°C. Collect 10 µl samples of the supernatant (Row D, Block 1) and discard the rest. Block 1 can be stored at -20°C. Carefully resuspend the membranes in 50 mM Tris-HCl pH 7.5, 50 mM NaCl and 10% glycerol, using a disposable syringe with a 21-gauge needle. Flash-freeze in liquid nitrogen and store at -80°C, if required.
Place the membranes for P1–P12 on ice and standardize the samples by diluting them with 20 mM Tris-HCl pH 7.5, 50 mM NaCl (Buffer A) to obtain a total protein concentration of ∼ 20 mg/ml (using the absorbance at 280 nm [A280] and assuming an extinction coefficient of 1). Add the solubilizing detergent, DS, at a concentration of approximately 10 times the critical micelle concentration (CMC) and incubate for 1 h at 4°C, with gentle stirring. After solubilization, pour into ultra-centrifuge tubes, fill the tubes with Buffer A and collect 10 µl samples (Row E, Block 1). Remove any unsolubilized material by centrifuging at 100,000 g for 50 min and collect further 10 µl samples from the supernatant (Row F, Block 1, b). Unsolubilized material can also be removed using a 96-well filter plate (Turbofilter, Qiagen) and a vacuum manifold.
HTP purification
This part of the protocol relies on the grid-system within the 96-well blocks to be maintained throughout. Protein samples P1–P12 are found in Columns 1–12 and detergents D1–D8 are used in Rows A–H, respectively (a). It is also helpful to prepare 96-well buffer blocks in order to transfer solutions directly to the working blocks with an eight-channel multi-pipette. The buffer blocks can be prepared individually or with the use of a liquid-handling robot. Each row, A-H, of Buffer block 1 should consist of 1800 µl of Buffer A containing detergents D1–D8 (at concentrations of at least twice their CMC), respectively. Two DWBs consisting of Buffer block 1 are required for the protocol. Buffer blocks 2, 3, 4 and 5 are identical to Buffer block 1 with the addition of 50 mM, 250 mM, 1 M imidazole, and 0.5 mM EDTA and 0.5 mM DTT, respectively. Buffer blocks should be stored at 4°C until required and all working blocks and plates should be kept on ice to minimise degradation of the protein samples. A schematic diagram representing the entire HTP purification process can be found in , numbered steps 1–4. These steps are, highlighted in brackets and described, in the text below.
Figure 3. The 96-well purification procedure. (a) This schematic follows the progress of P1–P12 with 96-well experimental steps being numbered 1–4 and the associated collection blocks denoted 1a–4a, respectively. The analysis plates collected are listed on the right hand side and measurements (Fl, A280 and A340) taken are listed below them. (b) A table listing the contents of each analysis sample and collection block.
(1) Set up 96 individual Ni2 + -affinity columns using a 96-well filter plate (Ni2 + -plate) (QIAfilter, Qiagen). Resuspend Ni-NTA Superflow resin (Qiagen) thoroughly and pipette 500 µl of the suspension into each well of the filter plate (Ni2 + -plate). This corresponds to a bed volume of 250 µl. Equilibrate the Ni2 + -plate by adding 750 µl of Buffer block 1. Place the plate onto a 96-well DWB and centrifuge at 1500 g for 2 min, discarding the flow through (FT). Repeat this equilibration.
Split each of the solubilised protein samples, P1–P12, into eight equal aliquots and load 750 µl batches onto Columns 1–12 (filling Rows A–H) of the Ni2 + -plate. Place the Ni2 + -plate on a clean DWB, centrifuge at 100 g for 15 min and collect the FT. Repeat protein loading until all of P1–P12 has been used. At this stage all protein samples are in the solubilization detergent, DS. Transfer 2 µl of the collective FT to a special optics, black-walled, clear-bottomed, 96-well microplate (denoted analysis plate) (Corning), (Plate FT), dilute to 100 µl (50× dilution), using Buffer block 1, and store at 4°C for later analysis.
Wash the Ni2 + -plate by loading 600 µl from Buffer block 1, centrifuge at 1000 g for 1 min, and discard the FT. Repeat this wash step a further two times. Drain the DWB between washes and carry out three further wash steps with Buffer block 2. Protein samples, P1–P12 have now been exchanged into detergents D1–D8 (a).
Using a fresh DWB (Elution block 1, Block E1), elute the protein using 600 µl of Buffer block 3 and centrifuging for 2 min at 5000 g. Resuspend the samples in Block E1 and transfer 20 µl of each well to an analysis plate (Plate E1). Add 80 µl of Buffer block 1 to Plate E1 (5× dilution) and store at 4°C. Repeat this elution step exactly; collect the FT in Block E2 and samples for analysis in Plate E2. Finally, wash the Ni2 + -plate with two washes of 600 µl of Buffer block 4, collecting the FT in Block E3 before transferring 100 µl into analysis plate, Plate E3. At this stage the fusion proteins P1–P12 can be easily identified by the FI signal obtained from Plates E1–E3 (see the data analysis section for details) and/or SDS-PAGE analysis using four, 26-lane midi-gels (Invitrogen).
(1a) Once identified, pool the samples containing fusion proteins P1–P12 into a clean DWB (Protein block 1, Block P1) maintaining the grid-system.
(2) To remove imidazole from the protein samples use a 96-well desalting plate (Zeba, PIERCE). Equilibrate the block by adding 250 µl of Buffer block 5 and centrifuge at 1000 g for 2 min. Discard the FT and repeat this equilibration three times. Place the desalting plate on a clean DWB (Desalting block, Block D), transfer 100 µl of Block P1 onto the desalting plate and centrifuge at 1000 g for 2 min. Remove Block D and reequilibrate the desalting plate (as the equilibration, above). Replace Block D and desalt a further 100 µl of P1–P12. Repeat these cycles of reequilibration and protein loading until all of the samples have been desalted into Block D. Transfer 100 µl of Block D into an analysis plate, Plate D, measure A280 of the samples (FLUOstar OPTIMA, BMG Labtech) and calculate the average concentration (µM) of the protein samples in the block.
(2a) To cleave the GFP-His8-tag, from P1–P12, add His-tagged TEV-protease to Block D using a molar ratio of 1:1, based on the average protein concentration and incubate at 30°C for 2 h (or 4°C for 16 h if preferred).
(3) Remove any precipitation from the cleaved samples in Block D by transferring to a filterplate (TurboFilter, Qiagen) and centrifuging at 500 g for 5 min.
(3a) Collect the FT in a fresh DWB (Cleaved protein block, Block C) and transfer 100 µl samples to analysis Plate C.
(4) Prepare a second Ni2 + -plate and load the samples from Block C (), as described above.
(4a) Collect the FT in Block P2 and transfer 100 µl of this to analysis plate P2 (Plate P2). Wash the Ni2 + -plate with Buffer block 3, collect the eluent in Block W (Wash Block) and transfer 100 µl samples to an analysis plate W (Plate W). Cleaved and purified samples of P1–P12 should now be in Block P2. Run SDS-PAGE analysis on these 96 samples to investigate their purity and scan the plate at A280 to calculate the concentration and yield of the protein, using the relevant extinction coefficients.
Analysis procedures
A schematic showing all sample plates collected for data analysis can be found in .
Expression
To take FI measurements from the expression trials, dilute the samples to an OD600<1.5, by adding the same amount of PBS (Phosphate buffered saline) pH 7.4, to every well of Block M1 (typically 1000 µl will suffice) and mix thoroughly by pipetting until the liquid appears homogenous. Maintaining a homogenous solution is important to obtain accurate readings and this should be carried out with care as individual cell lines can behave differently. Transfer 100 µl of Block M1 to an analysis plate and place in the fluorimeter (FLUOstar OPTIMA, BMG Labtech). Prior to taking the measurements incubate the plate for 5 min at 37°C, with shaking, to maintain the homogeneous solution. Take FI readings for all 96 wells and adjust the gain value to provide optimal sensitivity for the fluorimeter. This value must remain constant when repeating the measurements for Blocks M2–M4.
The collected FI data (for a typical example see a) identifies (by the highest values) the best condition (cell-line, media and temperature) for expressing a chosen GFP fusion target. However, with such a large collection of data points (32×12) it is possible to mine the data for emerging trends. Calculating averages across all the data points, the best overall media (i.e., the best media regardless of cell-line and temp), the best overall cell-line and the best overall temperature for each individual clone is revealed. It is also possible to look at the average FI values to determine whether each cell line and media produce more protein at T1 or T2; to discover whether some cell lines express better in certain media; and to determine if certain media are better suited to particular cell-lines. By gathering this information for 12 clones per experiment, an in-house bank of data can be quickly built up and used to adapt future experiments.
Cell harvesting, membrane preparation and solubilization
In this section, all samples for analysis are stored in Block 1 (b). Dilute these samples by adding 490 µl of Buffer A to Rows A–F (50× dilution), mix well and transfer 100 µl into an analysis plate. Take FI measurements of all samples, with a single gain value, and collect the data. The FI values from the following rows can be directly compared: A with B, C with D, and E with F. These data are used to examine any loss of fluorescence (and hence GFP fusion proteins). Comparing Row A with Row B shows FI lost in unbroken cells and cell debris; comparing Row C with Row D allows a calculation of the amount of GFP lost in the soluble fraction (as a result of either free or cleaved GFP) and a comparison of Row E and Row F shows the fraction of unsolubilized GFP fusion protein in the solubilization detergent, DS.
HTP purification
Data analysis for the purification consists of absorbance measurements at 280 and/or 340 nm (A340) along with FI measurements. The A280 measurement can be used to estimate the total protein content while FI measures the signal from GFP. Therefore, calculating the ratio FI:A280 gives an indication of the purity of the sample (GFP containing protein: total protein in the sample). Additionally, the turbidity of the solution is measured by A340 which is suitable for monitoring the protein precipitation in a sample Citation[15]. These measurements provide a rapid way of identifying the greatest amount of GFP fusion protein present along with its purity and solubility/stability in each chosen detergent.
The cleared solubilized protein samples of P1–P12 are the starting material (SM) for each column 1–12 of the first Ni2 + -plate, respectively. The FI values of the solubilized proteins have been obtained previously (Row F, Block 1) and samples of the FT from the Ni2 + -plate (stored in Plate FT) should be scanned similarly, using the same gain value and dilution factor (50×) (b (I) shows a typical example of the collected FI data). This allows a direct comparison of the FI in the SM and in the FT, which should be much higher in the SM as a result of P1–P12 binding to the Ni2 + -plate (b [II]). Additionally, since the same amount of protein was added to each column of the plate, the smallest FI values in a column of Plate FT show which detergents allow for the most efficient binding of each individual protein (b [III]). Calculating the average FI values for each detergent (D1–D8) makes it possible to investigate trends in protein binding in each detergent, and by calculating the average FI value for each protein the amount of protein bound, with respect to the SM, can also be obtained (b [I]).
Figure 4. Examples of typical fluorescence intensity (FI) results (a) Example of FI data collected on a single clone. M1–M4 and C1–C4 denote the different media types and cell lines, respectively. Different growth temperatures, T1 and T2 are shown in black and red, respectively. A box highlights the best condition for the clone and potential calculations of average values across the data are shown. (b) Example of FI results to investigate protein binding. (I) Example data showing the FI values of the starting material (SM) (Block1, Row F) loaded onto the Ni2 + and the data collected from the flow through (FT) for protein samples P1–P12 in detergents D1–D8 are shown. A box highlights P10 and the greatest (blue) and least (red) binding in the various detergents is highlighted. Potential calculations of average values across the data are shown and the percentage binding calculated. (II) A graph showing the FI value of the SM (green) versus the average FT (yellow) for each protein. (III) A graph showing the binding of P10 in D1–D8. (c) Example of graphs calculated from FI data in elution plates E1 (green) and E2 (yellow) (I) Chart showing FI values from P10 in D1–D8. (II) Chart showing average protein elution in D1–D8.
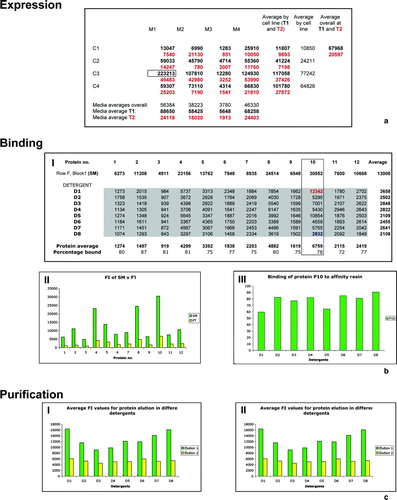
Scan elution Plates E1, E2 and E3 for FI as well as A280 and A340, keeping the gain value constant. E1 and E2 can be compared directly as they have the same dilution factor, and the greatest FI values identify the location of P1–P12 (c [I]). Additionally, calculating FI:A280 and A340 gives a good estimate of the purity and solubility of the samples in detergents D1–D8. The average FI, A280 and A340 values, across Rows A–H in the elution blocks, identify trends in the suitability of detergents D1–D8 in the purification of P1–P12. Furthermore, by calculating the average FI value of the eluted protein samples in each detergent, trends in the overall suitability of a detergent for the purification of membrane proteins can be investigated (see c [II]).
Once the identified protein samples have been pooled and desalted it is possible to monitor the loss of GFP-fluorescence after cleavage by comparing the FI values of Plate D to that of Plate C (). At this stage A280 would include absorbance from the TEV-protease and is not particularly useful in the comparison. The inhibition of TEV by certain detergents Citation[16] could affect the results and should be monitored by SDS-PAGE analysis of the final wash step (Plate W).
Loading the protein samples from Block C onto the second Ni2 + -plate provides the final purification step in the process. Here, the cleaved GFP-His8-tag along with the His-tagged TEV-protease should bind to the Ni2 + -columns (along with any impurities that bound to the first Ni2 + -plate) and purified samples of P1–P12 in detergents D1–D8 should bypass the Ni2 + -columns and remain in the FT (Block P2). A direct comparison of the FI in Plate C with Plate P2 should show a loss of FI (as a result of the GFP binding to the Ni2 + -plate) while readings at A280 and A340 of Plate P2 give an estimation of the protein concentration and solubility of the final samples.
For completion, FI readings of Plate W show that the final Ni2 + -plate was successful and that the majority of the Fl (GFP-His8) remained on the resin. It is important at this stage to examine P1–P12 using SDS-PAGE analysis to monitor the purity of the samples and the overall success of the experiment.
Obtaining diffraction quality crystals of integral membrane proteins is still inherently difficult. However, the use of HTP techniques and an ever-increasing bank of structures (along with the methods used to produce them) give an ideal basis for developing new methods. The methods described in this paper use HTP techniques along with GFP fusion proteins and information gathered from previously solved structures to tackle this problem. The protocols are designed to work quickly and effectively in order to gather information about the best conditions for producing sufficient amounts of stable proteins for crystallization trials. They provide a good starting place for initial experiments and allow a large amount of data to be gathered quickly on chosen membrane protein targets and can be used to examine one protein or to work with several in parallel.
Acknowledgements
This work was supported with funding from the BBSRC. KMcL, IB, RJC and NWI are members of the Membrane Protein Structure Initiative (MPSI). We also thank the University of Glasgow and Westchem for studentship funding (FK). Declaration of interest: The authors report no conflicts of interest. The authors alone are responsible for the content and writing of the paper.
References
- Drews J. Drug discovery: A historical perspective. Science 2000; 287: 1960–1964
- Berman HM, J Westbrook, Z Feng, G Gilliland, TN Bhat, H Weissig 2000. In: Shindyalov, Bourne PE. The protein data bank. Nucleic Acids Res 28:235–242.
- Membrane Proteins of known 3D structures [July 2008]. Available from http://blanco.biomol.uci.edu/Membrane_Proteins_xtal.html.
- Essen LO. Structural genomics of non-standard proteins: A chance for membrane proteins?. Gene 2002; 3: 39–48
- White SH. The progress of membrane protein structure determination. Protein Sci 2004; 13: 1948–1949
- Frishman D, Mewes HW. Protein structural classes in five complete genomes. Nat Struct Biol 1997; 4: 626–628
- Rummel G, Rosenbusch JP. Crystallization of bacterial outer membrane proteins from detergent solutions: Porin as a model. Methods and results in crystallization of membrane proteins, S Iwata. IUL, La Jolla 2003; 103–129
- Beis K, Whitfield C, Booth I, Naismith JH. Two-step purification of outer membrane proteins. Int J Biolog Macromolec 2006; 39: 10–14
- Daley DO, Rapp M, Granseth E, Melen K, Drew D, von Heijne G. Global topology analysis of the Escherichia coli inner membrane proteome. Science 2005; 308: 1321–1323
- Rapp M, Drew D, Daley DO, Nilsson J, Carvalho T, Melen K, De Gier JW, Von Heijne G. Experimentally based topology models for E. coli inner membrane proteins. Protein Sci 2004; 13: 937–945
- Niegowski D, Hedren M, Nordlund P, Eshaghi S. A simple strategy towards membrane protein purification and crystallization. Int J Biol Macromol 2006; 39: 83–87
- Drew D, Slotboom DJ, Friso G, Reda T, Genevaux P, Rapp M, Meindl-Beinker NM, Lambert W, Lerch M, Daley DO, Van Wijk KJ, Hirst J, Kunji E, De Gier JW. A scalable, GFP-based pipeline for membrane protein overexpression screening and purification. Protein Sci 2005; 14: 2011–2017
- Drew DE, von Heijne G, Nordlund P, de Gier JW. Green fluorescent protein as an indicator to monitor membrane protein overexpression in Escherichia coli. FEBS Lett 2001; 507: 220–224
- Miroux B, Walker JE. Over-production of proteins in Escherichia coli: Mutant hosts that allow synthesis of some membrane proteins and globular proteins at high levels. J Mol Biol 1996; 260: 289–298
- Vincentelli R, Canaan S, Campanacci V, Valencia C, Maurin D, Frassinetti F, Scappucini-Calvo L, Bourne Y, Cambillau C, Bignon C. High-throughput automated refolding screening of inclusion bodies. Protein Sci 2004; 13: 2782–2792
- Mohanty AK, Simmons CR, Wiener MC. Inhibition of tobacco etch virus protease activity by detergents. Protein Expr Purif 2003; 27: 109–114