Abstract
The production of well-ordered crystals of membrane proteins for structural investigation by X-ray diffraction typically requires extensive crystallization trials and may involve the screening of multiple detergents, lipids and other additives. Purification of sufficient amounts of protein for such trials is hampered by the fact that even when over-expressed, membrane proteins represent only a small percentage of the total protein content of bacteria. Fermentation-scale cultures of cells are therefore usually required. To maximize the efficiency and reduce the cost of such cultures, in the UK Membrane Protein Structure Initiative we have systematically investigated the use of auto-induction as an alternative to induction of expression with isopropyl-β-D-thiogalactoside. We report here the benefits of first optimizing expression on a multiwell plate scale by systematically varying the concentrations of glucose, glycerol, lactose and succinate present in the auto-induction medium. For subsequent scale-up, comparison of isopropyl-β-D-thiogalactoside induction in shake-flasks with auto-induction in shake-flasks and in 1L fermenters without and with control of pH and aeration revealed that highest yields of target protein were obtained using the latter culture conditions. However, analysis of the time-course of expression highlighted the importance of choosing the correct time for harvest. The high yields of target protein that can be obtained in a single batch by auto-induction, performed on a 30 l scale in a fermenter, obviate batch-to-batch variations that can add an unwanted variable to crystallization screening experiments. The approach described should therefore be of great utility for membrane protein production for structural studies.
Introduction
Membrane proteins are essential for many cellular functions and represent more than 50% of current therapeutic targets Citation[1]. They constitute up to 30% of the genes encoded by sequenced genomes Citation[2], Citation[3], but less than 1% of the total unique protein structures in the Protein Databank are of membrane proteins. Bottlenecks that have contributed to this discrepancy include difficulties in achieving sufficiently high levels of membrane protein expression, in their purification in monodisperse and stable form, and in the formation of crystals that diffract to sufficient resolution. The first of these bottlenecks is of key importance, because the availability of large amounts of protein is typically a pre-requisite for detailed investigation of the conditions required to maintain monodispersity and stability, and thence for the large-scale robotic screening of crystallization conditions. To date, the majority of recombinant membrane protein structures have been of eubacterial or archaeal proteins, because these can usually be expressed at higher levels in Escherichia coli than is the case for eukaryotic membrane proteins either in prokaryote or eukaryote expression systems. However, whereas sufficient amounts of water-soluble proteins for structural investigations can usually be obtained from simple shake-flask cultures Citation[4], in the case of membrane proteins it is often necessary to perform cultures on the fermenter scale. This is because cytoplasmic membrane proteins represent a much smaller fraction of total cellular protein in bacteria than do cytosolic proteins Citation[5]. Consequently, even when expression has been optimized, yields of only 1–5 mg purified protein per litre of E. coli culture are typically obtained for membrane proteins Citation[6], Citation[7].
Recently, the expression of water-soluble proteins from vector systems utilizing inducible lac and related promoters has been simplified by the use of auto-induction as a replacement for induction of expression with isopropyl-β-D-thiogalactoside (IPTG) Citation[8]. This approach obviates the need for monitoring the attenuance of the cultures to identify the correct time for induction, and is thus more suitable for high-throughput expression studies. Moreover, given the high cost of IPTG, auto-induction is a more cost-effective means of protein production, in particular when pilot-scale fermentation is required. This approach has been extended to membrane proteins in several laboratories, including our own Citation[9], Citation[10]. However, a systematic investigation of the effects on the expression levels for membrane proteins of the concentrations of the key components of the auto-induction system, namely glucose, glycerol and lactose, has not been reported. Similarly, the relationships between conditions that are optimal for membrane protein expression in the multiwell plate cultures typically used for high throughput screening, and those that are optimal for production in fermenters, have not been explored. Scale-up to the fermentation scale is not straightforward, because factors known to affect cell growth and protein expression levels, such as oxygenation, are typically not well-characterized or controlled in plate cultures Citation[11]. To address these points in the present study, conducted as part of the BBSRC-funded Membrane Protein Structure Initiative (MPSI), we examined the effects of glucose, glycerol and lactose concentrations on the expression levels of nine different membrane protein targets, cultured in 24-well plates. Having identified the optimal conditions for protein expression in microwell plates, the scale-up to 400 ml shake-flask cultures and to 750 ml fermenter cultures was explored. We demonstrate the importance of aeration, pH control and harvest time on the level of membrane protein expression.
Materials and methods
Plasmids and bacterial strains
The nine transporter genes chosen from the MPSI target list for the present study are listed in . Targets were cloned into pTTQ18-based Citation[12] expression vectors encoding either an N-terminal octahistidine tag followed by a Tobacco Etch Virus protease (TEV) cleavage site or C-terminal hexahistidine or octahistidine tags. Expression was performed in E. coli strains BL21-gold(DE3) (Stratagene), BL21 Star™ (DE3) (Invitrogen), which bears a truncated RNAse E gene to enhance RNA stability Citation[13], and C41(DE3) and C43(DE3) (Lucigen Corporation), strains selected to enhance expression of potentially toxic proteins, including membrane proteins Citation[14]. Except where indicated in the text, all strains had been transformed with the plasmid pRARE2 (Novagen), which encodes tRNAs for seven codons rarely used in E. coli and thus enhances translation efficiency of genes with codon usage different from endogenous E. coli ones Citation[15].
Table I. Expression of membrane transport proteins in microwell plates using optimized auto-induction conditions.
Media
The compositions (g/L) of the media used for IPTG induction experiments were as follows:
Modified M9 medium (M9IPTG): Na2HPO4, 6; KH2PO4, 3; NaCl, 0.5; glycerol, 1.84; casamino acids, 2; NH4Cl, 1; MgSO4.7H2O, 0.493; CaCl2.2H2O, 0.059; Luria-Bertani medium (LBIPTG): tryptone, 10; yeast extract, 5; NaCl, 5; pH 7.5; Superbroth medium (SBIPTG): tryptone, 32; yeast extract, 20; NaCl, 5.
Solutions used for auto-induction experiments were based on those detailed by Studier Citation[8]. The compositions (g/L) of the base media employed were as follows: Modified M9 medium (M9auto): Na2HPO4, 6; KH2PO4, 3; casamino acids, 1; CaCl2.2H2O, 0.003; Luria-Bertani medium (LBauto): tryptone, 10; yeast extract, 5; Superbroth medium (SBauto): tryptone, 32; yeast extract, 20.
The compositions (g/l) of supplementary solutions added to the base media were as follows: NPSC stock: Na2HPO4, 71; KH2PO4, 68; Na2SO4, 14.2; NH4Cl, 53.3; pH adjusted to 7.0 with NaOH; used at a final concentration of 50 ml per litre medium; Glucose stock: Glucose, 25; used at final concentrations of 10–40 ml per litre medium; Glycerol stock: Glycerol, 250; used at final concentrations of 10–40 ml per litre medium; Lactose stock: α-Lactose, 100; used at final concentrations of 10–40 ml per litre medium; Magnesium stock: MgSO4.7H2O, 246. 5; used at a final concentration of 1 ml per litre medium; Succinate stock: Na2Succinate.6H20, 135.1; when present, used at final concentration of 40 ml per litre medium.
For both IPTG and auto-induction, carbenicillin (100 µg/ml) and chloramphenicol (30 µg/ml) were included to select for the presence of pTTQ18-based plasmids and pRARE2 respectively, except where otherwise indicated.
Expression screening in microwell plates
For high throughput expression screening, E. coli strains harbouring expression plasmids were cultured in auto-induction media M9auto, LBauto or SBauto, supplemented with phosphate buffer, sodium sulphate, ammonium chloride, magnesium sulphate and differing amounts of glucose, glycerol, lactose and succinate as detailed above. Cultures (1 ml) were grown in deep 24-well plates at 37°C for 28 h with shaking at 1300 rpm. Subsequent analysis was performed with the aid of RoboSeq 4204 (MWG) and Theonyx (AVISO) liquid handling robots equipped with absorbance plate readers. Samples (10 µl) were transferred from the 24-well plates and diluted 20-fold in water for measurement of cell concentration via attenuance at 600 nm (D600nm). A second, 400 µl sample from each well was then centrifuged at 4000 g for 20 min at 4°C, the supernatant removed and the cell pellet frozen at −80°C for 30 min. Thawed pellets were then resuspended in 100 µl of lysis buffer (50 mM HEPES, pH 8.0, 5 mM MgCl2, 25% [w/v] sucrose, 1% Triton X-100, 0.1 mg ml−1 lysozyme [added freshly before use], and 10 U ml−1 of OmniCleave™ endonuclease [Cambio]). To achieve complete cell lysis, the mixtures were vortexed using a Mix-mate (Eppendorf) at 1500 rpm at room temperature for 30 min. Samples (5 µl) were taken for measurement of total protein concentration using the bicinchoninic acid (BCA) assay (Perbio Science UK Ltd) and then the protein concentration of the lysates was adjusted to 1 mg ml−1 with water. Samples (10 µg) were subsequently analysed by SDS-polyacrylamide gel electrophoresis (SDS-PAGE) on a 96-well E-PAGE gel (Invitrogen). Known amounts of a hexahistidine-tagged form of TEV protease Citation[16] were included on the gel to provide quantification standards. The gel was electro-blotted onto nitrocellulose membranes (0.2 µm pore-size) using an iBlot™ transfer system (Invitrogen). Blots were blocked using 3% bovine serum albumin in 20 mM Tris, 500 mM NaCl, pH 7.5 containing 0.2% (v/v) Tween-20, and then stained with a horseradish peroxidase-labelled monoclonal antibody against oligohistidine tags (R&D Systems clone AD1.1.10) followed by SuperSignal® West Pico chemiluminescent substrate (Perbio Science UK Ltd). Signals were detected and quantified using a GeneGnome Detection system and GeneTools software, respectively (Syngene Bio Imaging).
Yields for each target were calculated from comparison of signal intensity with that for the TEV standards and are expressed as mg l−1 of culture and as % of the total protein. Contour plots were generated by normalizing the data for each target, with the maximum expression level for each condition taken to be 100. The relative expression levels for the remaining conditions were calculated, and the data plotted as a 3D contour plot using OriginPro 7 (Originlab Corporation).
Shake-flask cultures
Shake-flask cultures (400 ml) were performed in 2 L Erlenmeyer flasks. Cultures were initiated by addition of 0.8 ml of a mid-log phase cell suspension to the appropriate medium and then incubated at 37°C with orbital shaking at 250 rpm. For induction of expression by IPTG, cultures were grown to a D600nm of 0.6 before addition of 0.5 mM IPTG. Samples (1 ml) were taken for the following 12 h for measurement of D600nm and target protein concentration. For auto-induction, cultures were grown for 40 h and sampled between 14 h and 40 h.
Fermenter cultures
Small-scale fermentations were performed using a Multifors six-parallel fermenter system (Infors-HT, Switzerland). Cultures were initiated by the addition of 375 µl of a mid-log phase cell suspension to 750 ml of the appropriate auto-induction medium. Samples (1 ml) were taken at the indicated intervals for the analysis of target protein expression and D600nm. To facilitate sampling over the entire 40 h culture period, two identical cultures, with staggered inoculation times, were used for investigation of each protein target. The fermenters were equipped with probes to monitor attenuance (TruCell, Finesse, USA) and to allow the monitoring and control of dissolved oxygen (DO2) and pH (Mettler-Toledo Ltd., USA). Each vessel was fitted with two Rushton turbines and a ring sparger for aeration. Cultures were performed at 37°C. Where indicated in the text, the pH of the medium was maintained at 7.0 by additions of 1 M phosphoric acid and 2 M sodium hydroxide as appropriate. Similarly, where indicated, dissolved oxygen was controlled to maintain a DO2 value above 40% air-saturated medium by a cascade involving aeration at 1 vessel volume min-1 (vvm) and an agitation speed between 400 and 800 rpm. No oxygen supplementation was employed. For cultures without DO2 control, aeration was at 1 vvm and agitation speed was 400 rpm.
Large scale fermentations were performed using a 40 l Applikon Bio Pilot Fermenter (Applikon, The Netherlands). Culture was initiated by the addition of 15 ml of a mid-log phase cell suspension to 30 l of the appropriate auto-induction medium. The fermenter was equipped with DO2 and pH probes (Mettler-Toledo Ltd) and was fitted with three Rushton turbines and a ring sparger. Samples (1 ml) were taken at the indicated intervals during the period from 3–22 h after inoculation for the analysis of sugar concentration, target protein expression and D600nm. Fermentation conditions were identical to those described for the 750 ml Multifors cultures, although because of the larger impeller diameter the agitation speeds employed ranged from 200–500 rpm.
Measurement of sugar and target protein concentrations
For measurements of sugar concentrations and target protein expression levels, 1 ml samples of cell culture were centrifuged at 12,000 gav for 10 min to sediment the cells. The glucose and lactose concentrations in 0.5 ml samples of the supernatants were analysed by treating with or without -galactosidase and then measuring glucose using a hexokinase/glucose-6-phosphate dehydrogenase coupled enzyme assay, in 96-well plate form. The assays were performed using enzymes obtained from Roche Applied Science, according to the manufacturer's instructions. Target protein levels in the cell pellets were measured by Western blotting, as described above.
Results and discussion
Auto-induction for membrane protein expression
For expression of proteins by the auto-induction procedure, cells are cultured in medium containing glucose, glycerol and lactose Citation[8]. The glucose supports growth to high densities during the first part of the culture, while preventing induction of target protein expression by lactose. This is of key importance for the large-scale production of membrane proteins, which represent a much smaller fraction of the cell protein than do cytosolic proteins, because it allows induction to occur at a high cell density. Induction of expression with IPTG is typically performed at much lower cell densities, and growth usually ceases or is dramatically reduced upon induction, probably reflecting a toxic effect on the host. When the glucose present in the auto-induction medium has been consumed, induction of target protein by lactose can occur. Glycerol, which does not prevent induction by lactose, also supports growth and so its inclusion in the medium yields cell densities, both before and after induction, higher than those achieved with lactose alone Citation[8]. Auto-induction is therefore typically performed using media containing 0.5% glycerol, 0.05% glucose and 0.2% lactose. However, the successful expression of the target protein can be affected not only by the individual concentrations of these components, but also by the acidification of the medium resulting from metabolism of glucose or glycerol: such acidification can be countered by inclusion of tricarboxylic acid cycle intermediates such as succinate Citation[8]. Similarly, aeration has a profound effect, higher levels of lactose being needed for induction of protein expression at higher rates of aeration Citation[8]. This phenomenon is likely to be of particular importance in scaling up expression experiments from plates or shake-flasks to fermenters, where greater and more controlled aeration can be achieved.
Owing to the complexity of the variables that influence expression under auto-induction conditions, the time at which the cells are harvested is also critical. For example, expression levels may fall at longer times of culture because of lactose depletion, cell lysis, or loss of expression plasmid and overgrowth by non-expressing cells. An example of this is shown in , which illustrates the time course of expression of target 0004A during auto-induction culture in M9auto medium on a 30-l scale in a fermenter.
Figure 1. Time course of membrane protein expression by auto-induction in a 30 L fermenter without control of pH or DO2. Fermentation of a culture harbouring target 0004A was performed using LBauto medium and samples were analysed as detailed in Materials and methods. DO2 values (•••••••••) were measured using an in-built probe. Samples were taken for measurement of D600nm (•), glucose (□) and lactose (▵) concentrations. The latter are expressed as percentages of their initial values, which were 0.5 g l−1 and 2 g l−1, respectively. The inset shows a western blot of samples of the culture taken at the indicated times (h), stained with an antibody against the hexahistidine tag of the target.
It can be seen that during the logarithmic phase of growth glucose was rapidly utilized, being essentially completely consumed by 8 h. Lactose consumption began at about 10 h, when the cells had entered near stationary phase, and continued at an approximately linear rate until it was completely consumed, at about 21 h. However, substantial expression of the target protein was achieved only after about 20 h, when most of the lactose had been consumed.
Effect of medium composition on membrane protein expression
Previous experience in the MPSI project had revealed considerable variation in the success of the auto-induction process between different membrane protein targets. Both the data shown in , and previous studies on water-soluble proteins Citation[8], suggested the likely contribution both of medium composition and of harvest time to this variation. In the present project, a systematic attempt was made to investigate these variables using nine target proteins (), from eight transporter families, that had previously been found to be well-expressed either following IPTG induction or auto-induction.
As an initial step, the expression of these targets by auto-induction was assessed in E. coli strains BL21-gold (DE3), BL21 Star™ (DE3), C41(DE3) and C43(DE3), each harbouring pRARE2. Cultures were grown in deep well plates, in three different media (M9auto, LBauto and SBauto), containing ‘standard’ concentrations of nutrients, i.e., 0.5% glycerol, 0.05% glucose and 0.2% lactose Citation[8]. Samples were taken after 20, 24 and 28 h and the concentrations of target proteins measured as detailed in Materials and methods. Highest levels of expression were obtained with either BL21 Star™ (DE3) or C41(DE3), although the optimum medium differed between targets, and in each case highest levels of expression were obtained at 28 h. This harvest time and the optimum combination of host strain and medium for each target were selected for further optimization experiments ().
To examine the individual effects of glycerol, glucose and lactose concentrations on target protein expression under auto-induction conditions, the systematic screen illustrated in was employed, based on the use of three deep 24-well plates per target.
Figure 2. Screening of auto-induction culture conditions to optimize membrane protein expression. (A) Western blots, stained with an antibody against the hexahistidine tag of the targets, showing the effects of varying the concentrations of nutrients on the expression levels for three targets cultured for 28 h in deep-well plates using the indicated base media. The concentrations of glucose, glycerol and lactose used for each individual well are given as multiples of the ‘standard’ concentrations of 0.05%, 0.5% and 0.2%, respectively. (B) Contour plots showing average concentrations of glucose, lactose and glycerol yielding highest levels of expression for target protein constructs 0278E, 0294C and 0550A, following auto-induction in SBauto medium.
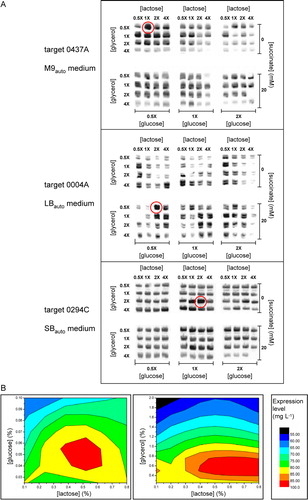
In this screen, lactose and glycerol concentrations were varied 8-fold, in the range from 0.5 to 4 times the “standard” auto-induction concentrations of 0.2% and 0.5%, respectively, while the glucose concentrations were varied 4-fold, in the range from 0.5–2 times the ‘standard’ auto-induction concentration of 0.05%. Each of these conditions was repeated twice in the screen, in the presence and absence of 20 mM succinate. Examples of the results of expression trials conducted using the screen on three different targets in three different media are shown in A. The conditions giving highest expression yield (mg protein per l of culture) are highlighted in each instance. It is clear from the examples shown that there can be considerable variation between different target membrane proteins, indicating that optimization of culture conditions should ideally be performed for each target individually in order to identify those yielding the highest levels of expression.
summarizes the conditions identified for optimal expression of the nine targets investigated using the screen of nutrient concentrations. In all cases but one, that of target 0356A, optimal expression was achieved using concentrations of glycerol, glucose and lactose that differed from the ‘standard’ values of 0.5%, 0.05% and 0.2%, respectively. In most cases, the increased yield of target protein per unit volume of culture did not merely reflect an increase in cell mass, but instead resulted from an increase in amount of target protein as a fraction of total protein. For example, for target 0004A the cell concentration, as measured by D600nm, after 28 h auto-induction under optimal conditions was only 80% of that obtained under ‘standard’ conditions, and the 4.4-fold increase in target yield instead resulted from a 5.4-fold increase in concentration of the target as a fraction of total protein (). These finding illustrate the importance, where possible, of screening auto-induction culture conditions for every target individually in order to identify those yielding highest expression levels. However, although optimal conditions were found to differ from target to target, it was possible to identify ‘generic’ conditions likely to yield optimal expression of targets in each medium type, by combining the expression data obtained to produce contour plots. Examples of these plots, showing (in the red area) the concentrations of glucose, glycerol and lactose that on average yield the highest levels of expression for three targets in SBauto medium, are given in B. It can be seen that the optimal lactose concentration, approximately 0.5%, is higher than the ‘standard’ value of 0.2%. Identification of such generic optimal conditions is likely to improve the reliability of high-throughput screens aimed at identifying highly-expressing targets.
Scale-up
In auto-induction trials performed in deep-well plates, it was not readily possible to monitor or control parameters such as pH and oxygenation, both of which may have an effect on protein expression Citation[8]. The same is true for shake-flask cultures. However, monitoring of fermenter cultures grown under auto-induction conditions, without use of pH or aeration control, showed that the pH could both rise and fall during the course of a single fermentation (data not shown). Moreover, in fermentations performed using rich media such as LBauto and SBauto, the dissolved oxygen levels were commonly found to fall to near zero during the exponential phase of growth, because of the rapid growth rates and high cell yields obtained in such media (data not shown). The effects of aeration and pH control on cell growth and target protein yield in auto-induction conditions were therefore next assessed. To this end, the yields of three target proteins in M9auto, LBauto and SBauto media were compared when cultures were grown under auto-induction conditions in shake-flasks or on a 750 ml scale in a fermenter, with or without control of pH and DO2, as detailed in Materials and methods. For comparison, cultures of the same targets in shake-flasks were also subjected to IPTG-induction. Samples were taken at regular intervals during the induction process and target levels assessed by western blotting. shows a comparison of the maximum levels of expression achieved during the time courses of expression in each of the four culture conditions.
Figure 3. Comparison of peak expression levels for three targets following induction of expression by IPTG or auto-induction in 400 ml shake-flask cultures, or by auto-induction in 750 ml fermentation cultures with or without control of pH and DO2. For auto-induction, cells were cultured in the indicated media containing the ‘standard’ glucose, glycerol and lactose concentrations of 0.05%, 0.5% and 0.2% respectively, as detailed in Materials and methods. Equal volumes of culture in each case were resolved by SDS-PAGE and a western blot of the gel was stained with an antibody against the hexahistidine tag of the targets.
In all cases, maximum yield of target protein was found to increase in the order IPTG induction (flask) < auto-induction (flask) < auto-induction (fermenter; no pH/DO2 control) < auto-induction (fermenter; pH/DO2 control). Densitometric analysis of the Western blots indicated that the maximum level of target protein expression achieved by auto-induction in fermenters with pH and DO2 control exceeded that achieved in the absence of such control by 29% in M9auto medium, 12% in LBauto medium and 10% in SBauto medium.
As previously indicated for auto-induction performed in a fermenter without pH and DO2 control (), the level of target protein obtained can be greatly influenced by time of harvest. Because induction of expression by lactose requires that the glucose in the medium has first been removed by metabolism, harvesting the cells too early may result not only in a smaller cell yield than the maximum otherwise achievable but also in a lower level of target expression. Conversely, extension of harvest time too long into the stationary phase may reduce target yield, for example as a result of cell lysis in general or of proteolytic degradation of the target itself. To investigate such possibilities in more detail, the time-course of auto-induction of expression was next examined during fermentation cultures (750 ml) for three targets, using media of composition previously determined to be optimal for expression in multiwell plates, as detailed in , and with pH and DO2 control. Samples taken from the cultures at regular intervals were assayed for the presence of the target proteins by western blotting, yielding the results shown in (A–C).
Figure 4. Time courses for protein expression by auto-induction in 750 ml fermentation cultures. (A) Target construct 0004A, in LBauto medium; (B) target construct 0294C, in SBauto medium; (C) target construct 0437C, in M9auto medium; (D) target construct 0356A in M9auto medium. In each case, the concentrations of glucose, glycerol, lactose and succinate were the optimal ones listed in . Fermentation was performed using control of both pH and DO2, as detailed in Materials and methods. D600nm values were measured using an in-dwelling probe and so are expressed in arbitrary units. Insets show western blots of equal volumes of culture taken at the indicated times and stained with an antibody against the hexahistidine tag of the targets. In (D), auto-induction expression of target construct 0356A was compared in host strains BL21 Star™ (DE3) and BL21 Star™ (DE3) harbouring plasmid pRARE2, cultured in the absence (––––) and presence (----) of chloramphenicol (cam; 30 µg/ml) respectively. In this case, the insets show western blot results only for the times of peak expression in the absence and presence of chloramphenicol, which were 19 h and 25 h, respectively.
For targets 0004A and 0294C, which were cultured in rich media (LBauto and SBauto respectively), expression commenced as the cells entered stationary phase, after about 10–12 h, and reached a maximum after approximately 18 h (A–B). In contrast, for target 0437C, which was cultured in minimal medium (M9auto), the cells reached stationary phase after about 18 h but only low levels of expression were found at this time. Expression levels increased substantially over the next 12 h and were highest at the end of the fermentation period, at the 40 h time point (C). The extensive lag phase before substantial expression was obtained in minimal medium probably reflects the slower rate of growth and smaller cell mass produced, and thus slower utilization of glucose, compared to cultures in richer media: The cell densities achieved in M9auto medium were substantially lower than those achieved in LBauto and SBauto media ().
Table II. Comparison of target yields following auto-induction of expression in shake-flask and fermenter cultures
The observed differences in the time of peak expression in different media emphasize the importance of harvest time in order to maximize yield when membrane proteins are being produced by auto-induction in fermenters. It is also important to consider the effects of constituents of the medium other than nutrients per se. An example is shown in D, where growth curves are compared for bacteria harbouring or not harbouring the plasmid pRARE2, grown in the presence and absence of chloramphenicol respectively. This plasmid, which confers chloramphenicol resistance on the host and which encodes tRNAs for codons rarely used in E. coli Citation[15], is routinely used in the MPSI project to enhance heterologous expression of membrane proteins in this bacterium. The presence of pRARE2 caused a significant reduction in growth rate and a lower final cell yield (D). The time at which maximum yield of target was achieved also differed, this being 19 h and 25 h, respectively in the absence and presence of chloramphenicol. More importantly, in the absence of chloramphenicol, the yield of target was found to have substantially decreased by the 25 h time point. The cause of this decrease is unknown, but it may reflect proteolytic loss of the C-terminal hexahistidine tag. Whatever its origin, this finding confirms the importance of establishing the optimum time of harvest for individual targets/expression conditions when auto-induction is performed using fermenters.
The experiment shown in had shown that for three targets, auto-induction of expression in media containing ‘standard’ nutrient concentrations was more efficient in fermenters with pH and DO2 control than in shake-flasks. To investigate this apparent advantage of fermentation further, the yields of the fermentation cultures of the three targets shown in A–C were compared with those for auto-induction in shake-flasks, cultured using the same, optimized media compositions. shows that for two of the three targets, the transition from shake-flask to fermentation culture produced substantial increases both in target yield and in the target concentration as a fraction of the total cellular protein. Conversely, although culture of target 0294C under fermentation conditions yielded a higher cell concentration, both the overall yield of the target and its concentration as a fraction of total cell protein were significantly reduced ().
Conclusions
Use of auto-induction media provides a convenient means of screening multiple constructs, host cells and media in a microwell plate format, to identify conditions yielding maximum expression levels for membrane proteins. In the present study, we have shown that additional enhancement of expression levels can be achieved by varying the concentrations of glucose, glycerol, lactose and succinate in the auto-induction medium, and that the conditions yielding maximum expression differ between membrane proteins, even when the same parental expression vector is employed. Auto-induction was consistently found to yield higher expression levels than induction with IPTG. Similarly in most, but not all, cases auto-induction in a fermenter in which pH and DO2 was controlled yielded higher levels of target protein expression than when shake-flasks were used. However, this was not always the case, and in addition the time of harvest required to achieve highest expression levels was found to vary between different targets and media employed.
The observations made in the present study show the importance of optimizing the conditions for target expression, both during initial screening of conditions using multiwell plate format assays and during subsequent scale-up to the 750 ml fermenter level. For some targets, the high yields of cell paste and high concentrations of target protein achieved by auto-induction of expression under fermentation conditions render the latter scale sufficient for membrane protein production for structural studies. However, in the MPSI project we more routinely perform auto-induction cultures on a 30 l scale, as illustrated in , in order to minimize batch-to-batch variations in the membrane preparations used as a source of purified protein for crystallization trials. The successful use of such fermentations for protein purification is described in accompanying manuscripts (Postis et al. 2008; Roach et al. 2008) in this special issue of Molecular Membrane Biology. Optimum growth conditions and harvest times established using 750 ml fermentations thus appear to be transferable to the 30 l scale, although a systematic study of the scale-up to 30 l is still underway in our laboratory. We are also exploring the use of HPLC rather than enzymatic assays to measure glucose, glycerol and lactose concentrations in real time during the fermentation process: it may be possible to use such measurements to aid the choice of optimal harvest time for each individual fermentation. We anticipate that such investigations will yield further improvements in the large-scale production of membrane proteins for structural biology.
Acknowledgements
This work was supported principally by the Biotechnology and Biological Sciences Research Council [grant numbers BBS/B/14418 (MPSI), BB/D524832/1, 24/REI18440, BB/E013163/1] and by the University of Leeds. Declaration of interest: The authors report no conflicts of interest. The authors alone are responsible for the content and writing of the paper.
References
- Hopkins AL, Groom CR. The druggable genome. Nat Rev Drug Discov 2002; 1: 727–730
- Boyd D, Schierle C, Beckwith J. How many membrane proteins are there?. Protein Sci 1998; 7: 201–205
- Wallin E, von HG. Genome-wide analysis of integral membrane proteins from eubacterial, archaean and eukaryotic organisms. Protein Sci 1998; 7: 1029–1038
- Alzari PM, Berglund H, Berrow NS, Blagova E, Busso D, Cambillau C, Campanacci V, Christodoulou E, Eiler S, Fogg MJ, Folkers G, Geerlof A, Hart D, Haouz A, Herman MD, Macieira S, Nordlund P, Perrakis A, Quevillon-Cheruel S, Tarandeau F, van TH, Unger T, Luna-Vargas MP, Velarde M, Willmanns M, Owens RJ. Implementation of semi-automated cloning and prokaryotic expression screening: The impact of SPINE. Acta Crystallogr D Biol Crystallogr 2006; 62: 1103–1113
- Sundararaj S, Guo A, Habibi-Nazhad B, Rouani M, Stothard P, Ellison M, Wishart DS. The CyberCell Database (CCDB): A comprehensive, self-updating, relational database to coordinate and facilitate in silico modeling of Escherichia coli. Nucleic Acids Res 2004; 32: D293–295
- Rahman M, Ismat F, McPherson MJ, Baldwin SA. Topology-informed strategies for the overexpression and purification of membrane proteins. Mol Membr Biol 2007; 24: 407–418
- Eshaghi S, Hedren M, Nasser MI, Hammarberg T, Thornell A, Nordlund P. An efficient strategy for high-throughput expression screening of recombinant integral membrane proteins. Protein Sci 2005; 14: 676–683
- Studier FW. Protein production by auto-induction in high density shaking cultures. Protein Expr Purif 2005; 41: 207–234
- Wei Y, Fu D. Binding and transport of metal ions at the dimer interface of the Escherichia coli metal transporter YiiP. J Biol Chem 2006; 281: 23492–23502
- Korepanova A, Moore JD, Nguyen HB, Hua Y, Cross TA, Gao F. Expression of membrane proteins from Mycobacterium tuberculosis in Escherichia coli as fusions with maltose binding protein. Protein Expr Purif 2007; 53: 24–30
- Islam RS, Tisi D, Levy MS, Lye GJ. Scale-up of Escherichia coli growth and recombinant protein expression conditions from microwell to laboratory and pilot scale based on matched kLa. Biotechnol Bioeng 2008; 99: 1128–1139
- Stark MJR. Multicopy expression vectors carrying the lac repressor gene for regulated high-level expression of genes in Escherichia coli. Gene 1987; 51: 255–267
- Lopez PJ, Marchand I, Joyce SA, Dreyfus M. The C-terminal half of RNase E, which organizes the Escherichia coli degradosome, participates in mRNA degradation but not rRNA processing in vivo. Mol Microbiol 1999; 33: 188–199
- Miroux B, Walker JE. Over-production of proteins in Escherichia coli: mutant hosts that allow synthesis of some membrane proteins and globular proteins at high levels. J Mol Biol 1996; 260: 289–298
- Burgess-Brown NA, Sharma S, Sobott F, Loenarz C, Oppermann U, Gileadi O. Codon optimization can improve expression of human genes in Escherichia coli: A multi-gene study. Protein Expr Purif 2008; 59: 94–102
- van den Berg S, Löfdahl PA, Härd T, Berglund H. Improved solubility of TEV protease by directed evolution. J Biotechnol 2006; 121: 291–298
- Saier MH, Jr, Tran CV, Barabote RD. TCDB: The Transporter Classification Database for membrane transport protein analyses and information. Nucleic Acids Res 2006; 34: D181–186