Abstract
Mitochondrial creatine kinase (mtCK) may participate to membrane organization at the mitochondrial level by modulating lipid state and fluidity. The effect of the protein on lipid phase behaviour of different acyl chain length phosphatidylglycerol monolayers was analyzed from pressure – area isotherms and from the compressional modulus variation with respect to the surface pressure. Monolayer morphology was visualized by Brewster angle microscopy. No condensation effect was visible on dimyristoylphosphatidylglycerol (DMPG). For the other PG monolayers tested, dipalmitoylphosphatidylglycerol (DPPG) and distearoylphosphatidylglycerol (DSPG), mtCK facilitated the formation of a liquid condensed phase. The effect depended on the surface pressure at which transition phase occurred. The effect of mtCK was more pronounced for tetramyristoylcardiolipin (TMCL) monolayers, as liquid condensed regions appeared 10 mN/m below the transition phase of the pure TMCL monolayer. The observed domains were circular and rather uniform, indicating a stabilization of the condensed phase. The same effect, namely an overall condensation of the monolayer with formation of circular domains, was observed upon protein injection beneath TMCL monolayers in different condensation states at constant area. MtCK ability to induce and stabilize a LC phase on monolayers could have important consequences in membrane organization and emphasize its structural role at mitochondrial level.
| Abbreviations | ||
| CK | = | creatine kinase |
| mtCK | = | mitochondrial creatine kinase |
| DMPG | = | dimyristoylphosphatidylglycerol |
| DPPG | = | dipalmitoylphosphatidylglycerol |
| DSPG | = | distearoylphosphatidylglycerol |
| TMCL | = | tetramyristoylcardiolipin |
| LE | = | liquid expanded |
| LC | = | liquid condensed |
| SC | = | solid condensed |
| Ks | = | compressional modulus |
| BAM | = | Brewster angle microscopy |
| GL | = | grey level |
| OS | = | obturation speed |
Introduction
Mitochondrial octameric isoform of creatine kinase (mtCK)1 interacting with the outer side of the inner mitochondrial membrane modulates the distribution of energy in cells of excitable tissues Citation[1], Citation[2]. Moreover, accumulating evidence now shows that this enzyme also plays several other roles at mitochondrial level, in contact point formation between the inner and the outer mitochondrial membranes Citation[3], Citation[4], in permeability transition pore regulation Citation[5–7] as well as in maintaining mitochondrial morphology Citation[8]. The structural role of mtCK in mitochondria is linked to its unique ability among the guanidino kinases to bind to the outer face of the inner mitochondrial membrane and seems not related to its catalytic activity, in a manner similar to what has been observed for other, so-called, moonlighting proteins Citation[9]. Membrane binding occurs mainly via electrostatic interactions between cardiolipin (CL) Citation[10] and the positively charged residues of the protein C-terminal end (Lys 380, Lys 379 and Lys 369), however hydrophobic interactions may also be involved Citation[11]. MtCK interacts both with CL and with its precursor PG Citation[10], Citation[12]. When injected beneath DMPG or bovine heart CL monolayers compressed at surface pressures close to that estimated in biological membranes, mtCK concentrates at the monolayer. Decompression and recompression isotherms are modified due to the presence of protein both on DMPG or CL monolayers Citation[13]. Previous fluorescence approaches made with Laurdan, a fluorescent probe, indicate that mtCK binding to CL or PG-containing liposomes changes the phospholipid liquid-crystalline state to a more rigid, gel state, and attenuates the abrupt change of lipid phase transition Citation[14]. Infrared spectra of lipids further strengthen these results: upon mtCK binding, the phospholipid methylene chains have a higher degree of ordering, thus a more rigid conformation, than that observed without mtCK at the same temperature Citation[14]. Thus, mtCK seems to be able to influence lipid phase transition and alter lipid organization in biomimetic structures. To better understand the molecular bases of the mtCK – membrane interaction and the role of acyl chain length we analyzed mtCK effect on lipid phase behaviour at the air-buffer interface. The film structural characteristics were studied from pressure-area (Π–A) isotherms and from the compressional modulus (Ks) variation with respect to the surface pressure. The morphology of the monolayers was visualized by Brewster angle microscopy (BAM). We used synthetic lipids of different chain length, DMPG, DPPG, DSPG and TMCL, to obtain at room temperature liquid expended (LE)-liquid condensed (LC) phase transitions situated in different regions of the isotherm. As TMCL presents a LE-LC phase transition in a pressure range that includes that of the biological membranes (30–35 mN/m) Citation[15], we verified mtCK influence on this lipid in different condensation states and directly followed by BAM the protein effect on lipid organization.
Materials and methods
Materials
Tris, EDTA, DTT, dimyristoylphosphatidylglycerol (DMPG), dipalmitoylphosphatidylglycerol (DPPG), distearoylphosphatidylglycerol (DSPG) were obtained from Sigma (Saint Quentin Fallavier, France). They were of the highest purity available. Tetramyristoylcardiolipin (TMCL) was purchased from Avanti Polar Lipids (Alabaster, USA). Water was purified with a Milli-Q system; its resistivity was greater than 18 Mωcm and its pH approximately 5.6.
Protein expression and purification
Recombinant octameric rabbit heart mtCK (340 kDa) was prepared and purified as previously described Citation[16]. The purified enzyme was obtained in 20 mM TrisHCl, 0.1 mM EDTA, pH 7.4 at a protein concentration of 0.2 g/l. Protein concentration was determined by the Lowry method using bovine serum albumin as standard. The purity of mtCK was established using gel electrophoresis.
Film formation and surface pressure measurements
All experiments were performed at constant temperature (21°C). The film balance was built by Nima (UK) and equipped with a Wilhelmy-type surface-pressure measuring system. For measurements of Π–A isotherms, a rectangular trough with a total area of 90 cm2, a volume of 50 ml and a depth of 5 mm was used. The subphase buffer was 20 mM TrisHCl, 0.1 mM EDTA, pH 7.4. A first compression in the absence of lipids was done at the beginning of the experiment to verify the absence of surfactants. Lipid monolayers were formed on a clean air-buffer interface by spreading known amounts of phospholipid dissolved in chloroform/methanol (4:1). After solvent evaporation (i.e. 20 min after spreading), the monolayer was symmetrically compressed at a velocity of 2 cm2/min. In order to measure Π–A isotherms in the presence of protein, a final concentration of 0.9 nM protein (184 µl) in 0.1 mM EDTA, 0.2 mM DTT, 20 mM TrisHCl buffer, pH 7.4, was injected in the subphase using a Hamilton syringe at a surface pressure of approximately 30 mN/m. This surface pressure was chosen because it is in the range of lateral pressures reported for biological membranes Citation[15]. Moreover, as this surface pressure is above the equilibrium pressure of the protein Citation[17], the unspecific adsorption at the air-buffer interface was undetectable. The film was expanded 3 h after injection and immediately recompressed. Surface compressional moduli were calculated from the pressure-area data obtained from the monolayer compressions, using the following equation:
where A is the molecular area and Π the corresponding surface pressure. This interfacial parameter is expressed in mN/m.
For constant area experiments, a 30 ml Teflon through of 27 cm2 total area and 11 mm depth (Riegler & Kirstein, Potsdam, Germany) was used. TMCL monolayers were formed at the air-buffer interface by spreading known amounts of phospholipid dissolved in chloroform/methanol (4:1) to obtain surface pressures that corresponded to a fully LE state, a mixed LE-LC state or a fully LC state. MtCK was injected beneath the monolayer after pressure stabilization at 4 nM final concentration. The injection volume was of 204 µl.
BAM visualization of monolayers
A commercial Brewster angle microscope manufactured by NFT (Göttingen, Germany) was used. The microscope was equipped with a 532 nm laser, a polarizer, an analyzer, and a CCD camera. The physical principle of BAM was previously described Citation[18], Citation[19]. The spatial resolution of the BAM was of about 2 µm and the image size was of 430×540 µm. The measurements were performed with different obturation speeds (OS) ranging from 1:50 to 1:2000 s, regulating the exposure time to adapt to different illumination levels. The measured intensity parameter was the image grey level (GL), which depended on the OS. To compare the images obtained for different OS, the relative reflectivity (I) was calculated as follows Citation[20], Citation[21]:
where GL is the recorded grey level value, BG, the background value of the camera and F the calibration factor for each shutter speed.
The relative reflectivity depends on both the thickness and refractive index of the monolayer:
where λ is the laser wavelength, d, the film thickness and n, the refractive index of the film. For a measured intensity and at a given refractive index, the BAM software allows modelling the average thickness of the film.
Depending on the physical state of the lipid, refractive indexes of monolayers of phosphatidylcholines with different acyl chains have been determined in the 1.43–1.5 range Citation[22]. For measurements at constant area, the refractive index of the TMCL monolayer was considered to vary in the same range. The average thickness of the monolayer was estimated for the two extreme values, 1.43 and 1.5. The refractive index of the adsorbed protein was considered to be around 1.5. We also considered that, for measurements performed at constant area, the density of lipids at the air-buffer interface only marginally change upon protein adsorption. Therefore, for a mixed mtCK-TMCL monolayer the refractive index was considered to be close to that of the pure lipid. The thickness of the monolayer was also estimated for refractive indexes varying between 1.43 and 1.5.
Results
Interfacial behaviour of PG-head group lipids
Three commercially available phosphatidylglycerols with different chain lengths were used to study the incidence of mtCK on lipid organization: DMPG, DPPG and DSPG. At pH 7.4, in our buffer conditions, the polar headgroups are negatively charged Citation[23], Citation[24]. As shown in , difference in chain length for the PG-headgroup, induces different phase behaviour upon compression.
Figure 1. Compression of a DMPG monolayer: (a) Surface pressure-molecular area isotherm and BAM images recorded during compression; (b) Ks evolution as function of surface pressure. Lateral surface pressure in mN/m, grey level (GL) and obturation speed (OS) are indicated on each image. Subphase: 0.1 mM EDTA, 20 mM Tris HCl buffer, pH 7.4, 21°C.
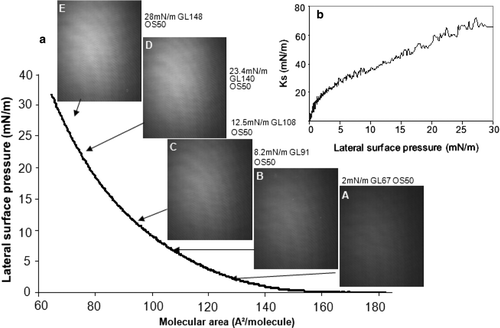
Figure 2. Compression of a DPPG monolayer: (a) Surface pressure-molecular area isotherm and BAM images recorded during compression; (b) Ks evolution as function of surface pressure. Lateral surface pressure in mN/m, grey level (GL) and obturation speed (OS) are indicated on each image. Subphase: 0.1 mM EDTA, 20 mM Tris HCl buffer, pH 7.4, 21°C.
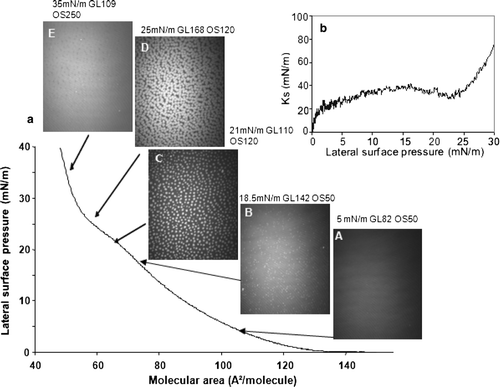
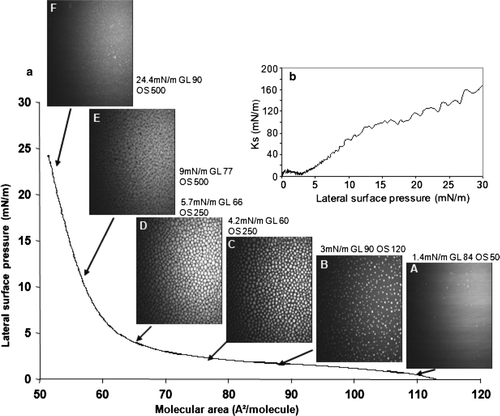
Figure 3. Compression of a DSPG monolayer: (a) Surface pressure-molecular area isotherm and BAM images recorded during compression; (b) Ks evolution as function of surface pressure. Lateral surface pressure in mN/m, grey level (GL) and obturation speed (OS) are indicated on each image. Subphase: 0.1 mM EDTA, 20 mM Tris HCl buffer, pH 7.4, 21°C.
In these particular conditions of buffer and temperature, DMPG, a saturated phospholipid with 14-carbon acyl chains, showed no LE-LC transition phase (a) Citation[13]. This differs from the isotherms obtained on water subphase, where a LE-LC phase transition was observed between 20 and 25 mN/m Citation[24]. In our experimental conditions, DMPG was in a liquid expanded (LE) state between 0 and 30 mN/m. BAM images taken during compression showed an increase in the brightness of the monolayer (a [A–E]). At 30 mN/m, a compact, homogeneous monolayer was formed.
The values of the compressional modulus, Ks, increased rapidly up to 20 mN/m, for a rise in lateral surface pressure from 0–2 mN/m, i.e. when the LE monolayer was formed. At higher surface pressures, Ks raised nearly linearly up to values exceeding 60 mN/m (b), values that characterize a LE monolayer Citation[25].
DPPG, a phospholipid with two 16 carbon-long saturated acyl chains, displayed a different behaviour upon compression. For lateral surface pressures between 0 and 18 mN/m, the lipid monolayer formed at the air-buffer interface was in a LE state (a). The BAM images taken within this pressure range showed a homogeneous film of increasing brightness (a [A and B]). The slope of the isotherm decreased between 18 and 25 mN/m indicating that a LE-LC phase transition occurred. As for DMPG, DPPG behaviour on TrisHCl buffer subphase differed from that observed on water Citation[26]. Indeed, on water the LE-LC transition occurred at surface pressures lower than 10 mN/m. On the contrary, on a 10 mM TrisHCl, 15 mM NaCl buffer, at pH 7.4, a LE-LC phase transition beginning at 15 mN/m was reported by Koppenol et al. (1997) Citation[27]. The 3 mN/m difference could be attributed to the presence of divalent cations, in the absence of chelating agents. Divalent cations have been reported to decrease the LE-LC transition surface pressure Citation[24]. Small bright spots began to appear at the beginning of the plateau (a C) and increased in size and brightness (a D). They corresponded to regions in the monolayer where the lipid was in a LC state.
Upon further compression, the LC domains progressively fused (a E) and, at surface pressures of approximately 30 mN/m, they occupied nearly the total interfacial area. A decrease in the Ks value clearly marked the LE-LC phase transition between 18 and 25 mN/m (b). At higher surface pressures, where the monolayer was in a LC state, the Ks abruptly increased.
The LE-LC phase transition of DSPG, a phospholipid with two 16 carbon-long saturated acyl chains, occurred at a lower lateral surface pressure, between 2 and 5 mN/m, marked by a plateau on the isotherm. This indicated that a fluid and disordered LE phase coexisted with a more ordered LC phase (a). At this point in the compression, bright spots began to appear on the BAM images corresponding to DSPG molecules that passed into a LC state, surrounded by darker regions, where DSPG molecules were in a LE state (a [B–D]). At higher surface pressures, the bright domains fused to form a solid condensed (SC) monolayer of high reflectance (5.2×10⁻⁶ arbitrary units) (a E, F). The Ks value decreased from 15 to 5 mN/M in the 1–3 mN/m pressure range, corresponding to the beginning of the LE-LC transition phase (b) and increased upon further compression, attaining 160 mN/m at 30 mN/m lateral surface pressure. The high reflectance of the monolayer, as well as the high value of Ks, suggest that, at surface pressures of approximately 30 mN/m, DSPG was in a SC state.
MtCK was injected at a final concentration of 0.9 nM beneath monolayers consisting of DMPG, DPPG or DSPG once compressed at 30 mN/m. Three hours after protein injection, the monolayers were expanded, then immediately recompressed.
Recompression of PG monolayers in the presence or absence of protein
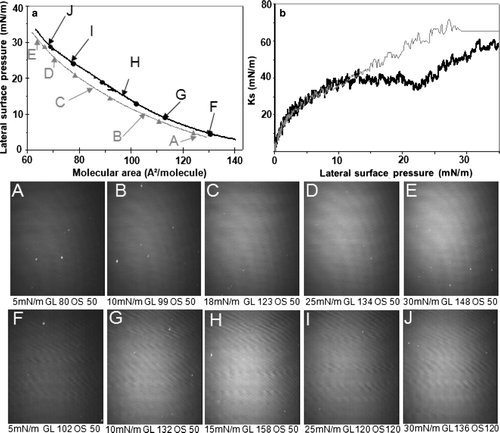
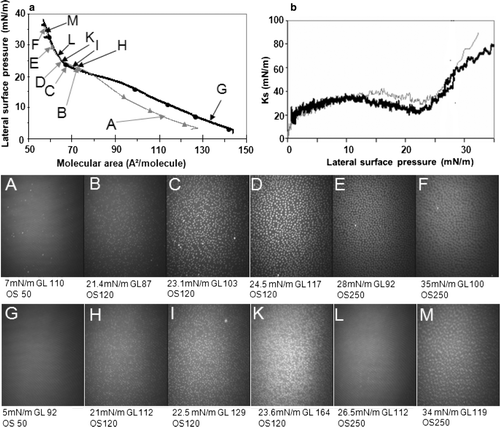
The recompression isotherm of a DMPG monolayer in the presence of mtCK was shifted towards higher molecular areas (a). A shoulder was clearly observed on the isotherm at approximately 21 mN/m. The Ks diminished concomitantly in the 21 mN/m region (b, black curve), and then rose in parallel with the Ks of the pure lipid monolayer. The BAM images recorded during compression showed a homogeneous monolayer ( [F–J]) of higher brightness than that of the pure phospholipid ( [A–E]). The relative reflectivity was of 1.2×10⁻⁶ arbitrary units for the pure lipid at 30 mN/m and of 2.5×10⁻⁶ arbitrary units for the monolayer in the presence of protein at 30 mN/m.
Figure 4. Recompression of a DMPG monolayer in the presence or absence of mtCK (0.9 nM): (a) Pressure-area isotherms in the absence (grey, triangles) or presence (black, circles) of mtCK; (b) Ks variation during compression in the presence (black thick line) or absence (grey thin line) of mtCK. Bottom: BAM images taken during recompression of the monolayer in the absence (A–E) or presence (F–J) of mtCK. Lateral surface pressure in mN/m, grey level (GL) and obturation speed (OS) are indicated below each image. Subphase: 0.1 mM EDTA, 20 mM Tris HCl buffer, pH 7.4, 21°C.
A shift towards higher molecular areas in the presence of mtCK was also recorded for a DPPG monolayer (a). A LE-LC phase transition was observed in the 15–22 mN/m surface pressure range. Between 0 and 12.5 mN/m surface pressure, the Ks curve in the presence of protein was superimposed to the one recorded with the pure lipid. Between 12.5 mN/m and 22 mN/m surface pressure, the Ks value in the presence of protein decreased from 35–20 mN/m (b, black curve). In the absence of protein, Ks decreased from 40–30 mN/m in the 16–22.5 mN/m surface pressure range (b, grey curve). After addition of protein, the decrease was from 35–20 mN/m in the 12.5–22 mN/m surface pressure range (b, black curve). Between 23 and 28 mN/m surface pressure, the Ks curves were similar with or without protein, but diverged above 28 mN/m. BAM images recorded during compression showed a homogeneous monolayer at low surface pressures both in the absence or presence of mtCK. Above 20 mN/m, bright spots began to appear on the monolayer ( H). The image K from showed the existence of bright areas at the interface. Those bright spots are smaller, but form a denser network than in the case of the pure lipid at similar surface pressure.
Figure 5. Recompression of a DPPG monolayer in the absence or presence of mtCK (0.9 nM): (a) Pressure-area isotherms in the absence (grey, triangles) or presence (black, circles) of mtCK; (b) Ks variation during compression in the absence (grey thin line) or presence (black thick line) of mtCK. Bottom: BAM images taken during recompression in the absence (A–F) or presence (G–M) of protein. Lateral surface pressure in mN/m, grey level (GL) and obturation speed (OS) are indicated below each image. Subphase: 0.1 mM EDTA, 20 mM Tris HCl buffer, pH 7.4, 21°C.
At higher surface pressure, the bright areas, which can be attributed to an LC phase, became larger and, eventually, at surface pressures of approximately 26 mN/m, they occupied the entire surface available ( L). Further compression up to 34 mN/m induced the formation of domains of higher reflectivity than the surrounding LC phase.
In the presence of mtCK, the relative reflectivity of the monolayer at a surface pressure of 35 mN/m ( M) was of 3.9×10⁻⁶, higher than the value of 3×10⁻⁶ recorded for the lipid monolayer in the absence of protein at 35 mN/m ( F).
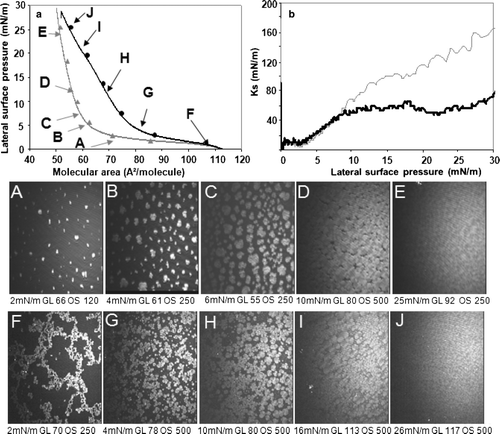
Recompression of the DSPG monolayer in the absence of protein induced the formation of isolated domains of uneven shape and size ( [A–C]) as compared to those observed during the first compression (). Condensed domain fused between 6 and 10 mN/m ( [C and D]). At further compression a SC phase was formed ( E). In the presence of mtCK, the isotherm was shifted towards higher molecular areas (a) and a shoulder was visible at approximately 20 mN/m. In the presence of protein, the Ks values were similar to those obtained without mtCK up to surface pressures of approximately 8 mN/m. Between surface pressures of 8 and 18 mN/m, the Ks increased from 50–110 mN/m, in the absence of protein, but only up to 70 mN/m in its presence. At surface pressures higher than 18 mN/m, in the absence of protein the Ks continued to increase, reaching 160 mN/m for a surface pressure of 30 mN/m. In the presence of protein, the Ks decreased from 70–50 mN/m for surface pressures ranging from 18–22 mN/m. Above 22 mN/m surface pressure, the Ks increased again, but its slope was less than that measured in the absence of mtCK, suggesting a rigidifying effect of the protein. The presence of mtCK at the monolayer modified the phase behaviour and connected lipid domains were visible, even at low surface pressures ( F). Long networks of uneven shape were formed, becoming more compact upon compression ( G). The condensed domains began to fuse at a surface pressure of 10 mN/m ( H) and they became compact at 15 mN/m ( I), while for the pure DSPG the fusion of the domains occurred at surface pressures lower than 10 mN/m. At higher surface pressures, the monolayer resembled to that of the pure phospholipids. We estimated a 7.8×10⁻⁶ relative reflectivity (arbitrary units) ( J) for the monolayer in presence of protein, against 5.6×10⁻⁶ arbitrary units obtained for the pure lipid ( E).
Figure 6. Recompression of a DSPG monolayer in the absence or presence of mtCK (0.9 nM): (a) Pressure-area isotherms in the absence (grey, triangles) or presence (black, circles) of mtCK; (b) Ks variation during compression in the absence (grey thin line) or presence (black thick line) of mtCK. Bottom: BAM images taken during recompression in the absence (A–E) or presence (F–J) of protein. Lateral surface pressure in mN/m, grey level (GL) and obturation speed (OS) are indicated below each image. Subphase: 0.1 mM EDTA, 20 mM Tris HCl buffer, pH 7.4, 21°C.
As a negative control, mtCK was also injected at a surface pressure of 30 mN/m beneath monolayers constituted of PC-head group lipids. The monolayers were decompressed three hours after protein injection and immediately recompressed. Under these experimental conditions, the isotherms of phosphatidylcholines in the presence of mtCK were not changed (Citation[13] and data not shown). This suggested that unspecific adsorption at the interface was limited and that the effect observed during recompression in the presence of mtCK was due to protein interaction with the negatively charged lipids.
Interfacial behaviour of TMCL
In our buffer conditions, TMCL displayed a relatively high LE-LC phase transition, between 28 to 35 mN/m (a), with respect to the isotherm reported on water (2–5 mN/m) Citation[28]. Between 26 and 30 mN/m surface pressure, the Ks diminished drastically from 60–25 mN/m (b).
Figure 7. Compression of a TMCL monolayer: (a) Surface pressure-molecular area isotherm and BAM images recorded during compression; (b) Ks evolution as function of surface pressure. Lateral surface pressure in mN/m, grey level (GL) and obturation speed (OS) are indicated on each image. Subphase: 0.1 mM EDTA, 20 mM Tris HCl buffer, pH 7.4, 21°C.
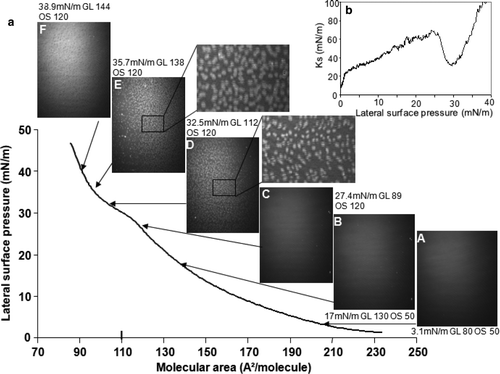
At higher surface pressures, the Ks values increased abruptly. The aspect of the monolayer was homogeneous at surface pressures below 29 mN/m, corresponding to a LE phase ( [A–C]). The LC regions, which appeared at surface pressures above 29 mN/m (a [D and E]), had uneven shapes, compared to the rather circular domains observed with DPPG and DSPG monolayers. Above the transition phase, the LC domains fused ( F).
Recompression of the TMCL monolayer in the presence or absence of protein
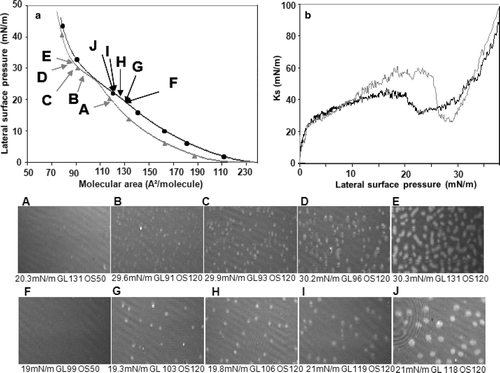
Recompression of the TMCL monolayer in the absence of protein induced only marginal changes in the behaviour of the lipid ( [A–E]) as compared to the first compression (). Oval-shaped LC domains were formed in the LE-LC phase transition region ( [D and E]). In the presence of mtCK the isotherm was shifted towards higher molecular areas (a, black curve). The lateral surface pressure increased regularly with compression up to approximately 19 mN/m. Above this value, the slope of the isotherm decreased. The isotherm of TMCL in the presence of mtCK overlapped that of pure TMCL at approximately 26 mN/m, however, above this surface pressure the two isotherms were slightly shifted. LC domains started to appear at approximately 19 mN/m ( [G–J]), concomitantly with the decrease in the slope of the isotherm, at surface pressures 10 mN/m lower than for the pure lipid ( [B–E]). They were more isolated than those obtained in the absence of protein and adopted round shapes ( J). At this surface pressure, the monolayer relative reflectivity in the presence of the protein was estimated at 1.9×10⁻⁶ arbitrary units, while for the pure lipid monolayer it attained 1.2×10⁻⁶ arbitrary units. In the 0–12 mN/m pressure range, the Ks in the presence of mtCK (b, black curve) increased in a similar manner as for the pure lipid (b, grey curve) up to 40 mN/m. The two Ks curves diverged above 12 mN/m surface pressure. From 12–18 mN/m surface pressure, the Ks increased from 40–58 mN/m in the absence of protein, but only to 42 mN/m in its presence. At surface pressures in the 18–24 mN/m range, the Ks in the presence of protein decreased from 42 to 30 mN/m, while, above 24 mN/m surface pressure, the Ks increased (b, black curve). In the absence of the protein, a drop in the Ks value (from 60–25 mN/m) was observed in the 26–29 mN/m pressure range (b, grey curve).
Figure 8. Recompression of a TMCL monolayer in the absence or presence of mtCK (0.9 nM): (a) Pressure-area isotherms in the absence (grey, triangles) or presence (black, circles) of mtCK; (b) Ks variation during compression in the absence (grey thin line) or presence (black thick line) of mtCK. Bottom: BAM images taken during recompression in the absence (A–E) or presence (F–J) of protein. Lateral surface pressure in mN/m, grey level (GL) and obturation speed (OS) are indicated below each image. Subphase: 0.1 mM EDTA, 20 mM Tris HCl buffer, pH 7.4, 21°C.
MtCK effect on a TMCL monolayer spread at different condensation states
As TMCL presents a phase transition in a region that corresponds to the estimated lateral pressure of the membranes, we used TMCL monolayers at different physical states (LE, LC or LE-LC coexistence) to further investigate the influence of mtCK binding on the LC phase formation. To increase the effect of the protein on monolayer morphology, we used an enzyme concentration of 4 nM.
A TMCL monolayer, spread at the air-buffer interface, at a surface pressure of 26 mN/m showed a LE state, with a homogeneous aspect (a A). MtCK induced a decrease in the surface pressure from 26–18 mN/m. A total of 40 minutes after protein injection, small round spots started to appear on the monolayer (a B). They increased in size with time (a C). Three hours after protein addition well-defined round-shaped domains coexisted with larger LC-areas (a [D–F]). A large increase in the relative reflectivity of the monolayer was recorded from 1.1×10⁻⁶ to 5.2×10⁻⁶ (arbitrary units). This change can be attributed both to an increase in the average thickness and to an increase in monolayer refractive index due to changes in lipid physical state. Refractive indexes for phospholipid monolayers vary, however, in a rather restraint range. For phosphatidylcholines of different acyl chain length, Ducharme et al. (1990) determined refractive index values ranging from 1.43 for the LE state to 1.5 for the SC state Citation[22]. For a refractive index varying in this range we estimated that, in the absence of protein, the average thickness of the interfacial film varied between 1.6 and 1.7 nm. Making the approximation that the presence of protein only marginally modifies the refractive index value, as stated in the Materials and methods section, the average film thickness was estimated between 3.4 and 3.5 nm, 200 min after protein injection (a F).
Figure 9. Evolution of the lateral surface pressure and of the aspect of the interfacial film after injection of 4 nM mtCK (large arrows) beneath TMCL monolayers spread on 0.1 mM EDTA, 20 mM Tris HCl buffer subphase (pH 7.4) in different condensation states: (a) LE; (b) LE-LC mixture; (c) LC. Lateral surface pressure in mN/m, grey level (GL), obturation speed (OS) and average film thickness in nm are indicated below each image. Experiments were performed at 21°C.
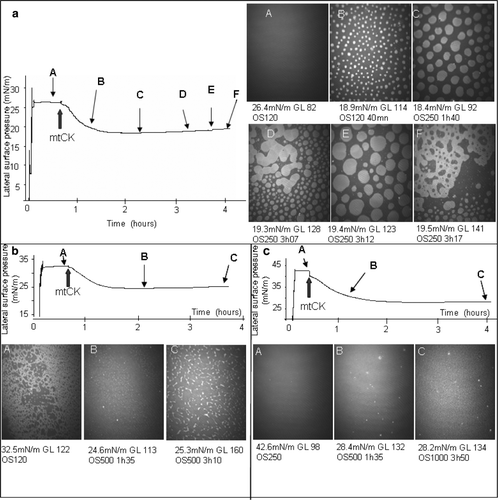
At 32.5 mN/m, surface pressure situated in the LE-LC transition region, the TMCL monolayer showed a heterogeneous composition (b A) with an average thickness estimated between 2.1 and 2.2 nm, using a refractive index ranging from 1.43–1.5. LC and LE areas coexisted within the monolayer. The LC domains observed after lipid spreading at the interface (b A) were not as uniformly distributed as those observed during compression of the TMCL monolayer (). The addition of mtCK beneath this monolayer induced, together with a decrease in the surface pressure from 32.5–24 mN/m, the enlargement of the LC regions and eventually the formation of a bright and rigid monolayer of approximately 4 nm thickness. In this monolayer, the LC regions occupied the entire surface available (b B). Due to the high increase of the image brightness, the obturation speed had to be changed from 120–500 s−1. Consequently, the film observed in b B has in fact a higher reflectivity than the white regions in b A. At longer incubation times (about 3 h after protein injection), even brighter domains appeared on the monolayer (b C). The average thickness increased from 2.1–2.2 nm in the absence of mtCK to 4.9–5.2 nm in its presence.
BAM images of a TMCL monolayer in a LC state showed a smooth and rigid film, of high reflectivity, corresponding to an average thickness estimated between 2.6 and 2.7 nm (c A). The addition of protein induced an overall increase in the image brightness corresponding to a raise of the film thickness up to 4.3–4.5 nm and 6.1–6.4 nm for images 9c B and C, respectively. For long incubation periods, the monolayer showed a more uneven aspect (c C) than the surface observed in image 9c B.
Discussion
Recent studies have shown that mtCK contributes to maintaining mitochondrial morphology Citation[8]. This essential role can be related to membrane interaction and to the previously reported rigidification of the lipid acyl chains that is observed upon mtCK binding Citation[14]. To better understand the molecular basis of such an effect, we examined how the lipid LE-LC phase transition behaviour was modified by mtCK binding. We used synthetic lipids bearing either different acyl chain lengths (DMPG, DPPG, DSPG) or a different headgroup (TMCL) to obtain LE-LC phase transitions at room temperature in different regions of the surface-pressure isotherm. The lipid organization induced by protein binding onto TMCL monolayers at different initial physical states (LE, LE-LC coexistence, LC or SC) was also followed by BAM.
Due to electrostatic repulsion between charged molecules, compression isotherms of PG-head group lipids depend on a number of parameters such as pH, the presence or absence of divalent cations, ionic force, etc. Citation[29]. In our experiments, we used a low ionic force buffer at pH 7.4 in the absence of divalent cations (presence of EDTA). In these particular buffer conditions, at low surface pressures, at the beginning of the compression, all the monolayers tested were in a LE state. In this state, the rise in the lateral surface pressure which is observed corresponds to a change in the lipid orientation with hydrophobic parts oriented more vertically; however, the lipids remain largely disordered and fluid Citation[30], Citation[31]. Further compression up to 35 mN/m induces no LC phase formation with DMPG which remains in a fluid state.
DPPG and DSPG show a transition from a LE to a LC phase, which is evidenced by a plateau on the compression isotherm, at approximately 20 mN/m and 2 mN/m, respectively. The LC phase is characterized by an increased molecular order, and lower compressibility than the LE phase Citation[30], Citation[31]. Interestingly, the Ks values decrease in the phase transition region, while for DMPG, in the absence of LC phase, Ks increases regularly. This parameter is used as a quantitative index of the monolayer resistance to compression Citation[31]. A decrease in Ks indicates that, in this pressure range, compression is facilitated. The transition to a LC phase results in an all-trans conformation of the monolayer lipids whose area is much smaller than that in the LE phase. Compression of the monolayer during this transition to smaller molecular area therefore results only in a slight increase in surface pressure.
The presence of protein at the monolayers induces several modifications on the profile of the isotherms. Small but systematic shifts to higher molecular areas with respect to the lipid were observed on the recompression isotherms, indicating a rather small extent of insertion of protein molecules or parts of them in the monolayer. For DMPG or DSPG, a shoulder was observed on the isotherms at surface pressures of 20–21 mN/m. With DPPG it may be masked by the lipid LE-LC transition. We have previously interpreted this phenomenon as the beginning of protein expulsion from the air-buffer interface Citation[13] in a manner comparable to that of surfactant protein B or C Citation[32–34]. With the increase in the surface pressure, mtCK molecules are progressively expelled from the interface Citation[13] and the isotherms in the presence of protein tend to overlap the isotherms of the pure lipid. However, in the presence of mtCK, the isotherm of TMCL remains shifted at surface pressures over 40 mN/m. Protein expulsion seems thus only partial on this type of monolayer. Protein expulsion from the monolayer, during recompression of the interfacial film, could be responsible for the decrease in the monolayer resistance to compression, as illustrated by the decrease in the slope of the Ks curve measured in this pressure range. However, at surface pressures of approximately 30 mN/m, the monolayer relative reflectivity is systematically higher when the negatively charged monolayers are recompressed in the presence of protein. This suggests that, upon recompression, protein still interacts with the negatively charged headgroup of the lipid monolayer.
The aspect of a LE monolayer (DMPG) remained homogeneous, in the presence of protein, but film reflectivity was higher (2.5×10⁻⁶ arbitrary units) than in the absence of mtCK (1.5×10⁻⁶ arbitrary units). On the contrary, mtCK altered the phase transition of the other phospholipids tested.
In the case of a DPPG monolayer, with or without protein, LC domains become visible at similar surface pressures (approximately 18 mN/m). However, in the presence of protein the monolayer has a higher reflectivity than in its absence. Upon further compression, the morphology of the LC regions was changed in the presence of mtCK (I and K). With compression, these LC regions become larger and, at surface pressures of approximately 26–27 mN/m, they occupy the entire image ( L), while, in the absence of protein, darker (LE) regions were still visible on the images taken during the monolayer recompression ( F). Moreover, between 24 and 34 mN/m, the monolayer becomes increasingly rigid. At 34 mN/m surface pressure, in the presence of protein, even brighter regions appear on the monolayer ( M), which suggest that mtCK is able to force the lipid to adopt a more organized state, possibly a solid condensed state.
For DSPG, below the phase transition, a homogeneous LE phase is observed during recompression in a small pressure range (0–1.5 mN/m). LC domains are formed at rather low surface pressure, 2 mN/m ( A). They are larger and uneven compared to the LC domains observed during the first compression and have polygonal shapes ( B and C). At surface pressures below 10 mN/m, the LC domains fuse and occupy the entire available area. In the presence of protein, decompression of the monolayer to similar molecular areas as for the pure lipid does not permit a complete dissociation of the domains (not shown). Domains associated in long networks, such as those shown in image F from , are present from the very beginning of the recompression. Consequently, mtCK adsorption to DSPG alters lipid behaviour during compression, stabilizing the LC phase. The LC domains observed in the presence of mtCK are not isolated. The presence of protein favours domain association, which form long networks and fuse progressively ( [G–E]). At 16 mN/m they occupy the entire available area. This pressure value is higher than the one observed in the absence of protein (10 mN/m).
TMCL compression isotherm showed a LE-LC phase transition between 28 and 35 mN/m. The LC regions were different from those observed with DPPG and DSPG. In the case of TMCL, they adopted uneven shapes, while for DPPG or DSPG they appeared rather uniform in shape and size ( and ). This particularity could be related to the shape of the TMCL molecule, constituted of four acyl chains and one charged head group. Its small headgroup area compared to the area of its four acyl chains gives a conical shape to the molecule Citation[28], Citation[35] and may affect its packing upon compression.
Interestingly, circular domains are formed when TMCL is compressed in the presence of mtCK. The circular shape of the domains indicates a lower border line tension between the LC phase and the surrounding LE environment Citation[36], leading to the conclusion that mtCK stabilises the LC phase in TMCL monolayers. Moreover, LC domains appear at lower surface pressures, 19 mN/m against 29 mN/m for TMCL in the absence of protein. Thus, the formation of protein-lipid complexes apparently facilitates the formation of a LC phase in the monolayer.
Experiments performed at constant area support this conclusion. The injection of mtCK beneath a TMCL monolayer in a LE state, in the vicinity of the LE-LC phase transition (26 mN/m), induces the formation of round-shaped LC domains, together with an increase of approximately 1.9 nm in the average thickness of the film. In the case of a monolayer in a mixed LE-LC state (b), the LE proportion diminishes upon mtCK interaction and eventually all the surface is occupied by regions with a LC state aspect (b B).With time, brighter regions appear in the LC monolayer (b C). They can be attributed to a more ordered, solid condensed state. Thus, mtCK binding to the monolayer induces a more ordered organization of lipid molecules.
When the monolayer is in a LC state (c), a strong increase in the film thickness is recorded after protein addition, estimated at approximately 3.5–3.7 nm. However the effect on the lipid physical state is less pronounced. A slight change in the aspect of the monolayer is observed, from a smooth surface to a more uneven one, but no bright areas are observed. Interestingly, for all conditions tested, above, below and at the transition phase, mtCK injection induces a strong decrease in the surface pressure. MtCK adsorption onto TMCL may diminish the repulsive forces existent between charged headgroups and may favour a closer contact between lipids. As a consequence, they would occupy smaller molecular areas at the interface. As the area is maintained constant, this would lead to a decrease in the surface pressure. A closer contact between lipids also favours all-trans conformational changes that lead to formation of a LC phase.
In a general manner, mtCK modifies the LE-LC phase transition, favouring the formation of the LC phase. The presence of this enzyme at the mitochondrial inner membrane could induce the formation of more ordered (condensed) microdomains, ensuring membrane microcompartimentation. This may influence the activity of integral proteins, but also membrane binding of peripheral proteins such as cytochrome-c or pro-apoptotic members of the Bcl-2 family. MtCK effect depends on the lipid characteristics (acyl chain length or polar head group) indicating that mtCK-induced lipid organization depends on the overall shape of the lipid and on its packing ability. Mitochondrial deficiencies such as Barth syndrome Citation[37], Citation[38] are characterized by defective remodelling of cardiolipin and phosphatidylglycerol Citation[39]. Different behaviour upon mitochondrial protein, such as mtCK, interaction, according to chain length, could be one of the causes of such pathologies and could explain the reported aberrant morphology of mitochondria.
Acknowledgements
We acknowledge funding from the University Claude Bernard Lyon 1, CNRS and Rhône-Alpes region. Declaration of interest: The authors report no conflicts of interest. The authors alone are responsible for the content and writing of the paper.
References
- Wallimann T, Wyss M, Brdiczka D, Nicolay K, Eppenberger HM. Intracellular compartmentation, structure and function of creatine kinase isoenzymes in tissues with high and fluctuating energy demands – the phosphocreatine circuit for cellular energy homeostasis. Biochem J 1992; 281: 21–40
- Wallimann T, Dolder M, Schlattner U, Eder M, Hornemann T, Kraft T, Stolz M. Creatine kinase: an enzyme with a central role in cellular energy metabolism. Magma 1998; 6: 116–119
- Dolder M, Walzel B, Speer O, Schlattner U, Wallimann T. Inhibition of the mitochondrial permeability transition by creatine kinase substrates. Requirement for microcompartmentation. J Biol Chem 2003; 278: 17760–17766
- Speer O, Back N, Buerklen T, Brdiczka D, Koretsky A, Wallimann T, Eriksson O. Octameric mitochondrial creatine kinase induces and stabilizes contact sites between the inner and outer membrane. Biochem J 2005; 385: 445–450
- Dolder M, Wendt S, Wallimann T. Mitochondrial creatine kinase in contact sites: interaction with porin and adenine nucleotide translocase, role in permeability transition and sensitivity to oxidative damage. Biol Signals Recept 2001; 10: 93–111
- Brdiczka D, Beutner G, Ruck A, Dolder M, Wallimann T. The molecular structure of mitochondrial contact sites. Their role in regulation of energy metabolism and permeability transition. Biofactors 1998; 8: 235–242
- O'Gorman E, Beutner G, Dolder M, Koretsky AP, Brdiczka D, Wallimann T. The role of creatine kinase in inhibition of mitochondrial permeability transition. FEBS Lett 1997; 414: 253–257
- Lenz H, Schmidt M, Welge V, Kueper T, Schlattner U, Wallimann T, Elsasser HP, Wittern KP, Wenck H, Staeb F, Blatt T. Inhibition of cytosolic and mitochondrial creatine kinase by siRNA in HaCaT- and HeLaS3-cells affects cell viability and mitochondrial morphology. Mol Cell Biochem 2007; 306: 153–162
- Copley SD. Enzymes with extra talents: moonlighting functions and catalytic promiscuity. Curr Opin Chem Biol 2003; 7: 265–272
- Schlame M, Augustin W. Association of creatine kinase with rat heart mitochondria: high and low affinity binding sites and the involvement of phospholipids. Biomed Biochim Acta 1985; 44: 1083–1088
- Schlattner U, Gehring F, Vernoux N, Tokarska-Schlattner M, Neumann D, Marcillat O, Vial C, Wallimann T. C-terminal lysines determine phospholipid interaction of sarcomeric mitochondrial creatine kinase. J Biol Chem 2004; 279: 24334–24342
- Vacheron MJ, Clottes E, Chautard C, Vial C. Mitochondrial creatine kinase interaction with phospholipid vesicles. Arch Biochem Biophys 1997; 344: 316–324
- Vernoux N, Maniti O, Besson F, Granjon T, Marcillat O, Vial C. Mitochondrial creatine kinase adsorption to biomimetic membranes: a Langmuir monolayer study. J Colloid Interface Sci 2007; 310: 436–445
- Granjon T, Vacheron MJ, Vial C, Buchet R. Mitochondrial creatine kinase binding to phospholipids decreases fluidity of membranes and promotes new lipid-induced beta structures as monitored by red edge excitation shift, laurdan fluorescence, and FTIR. Biochemistry 2001; 40: 6016–6026
- Marsh D. Lateral pressure in membranes. Biochim Biophys Acta 1996; 1286: 183–223
- Marcillat O, Perraut C, Granjon T, Vial C, Vacheron MJ. Cloning, Escherichia coli expression, and phase-transition chromatography-based purification of recombinant rabbit heart mitochondrial creatine kinase. Prot Expr Purif 1999; 17: 163–168
- Vernoux N, Granjon T, Marcillat O, Besson F, Vial C. Interfacial behavior of cytoplasmic and mitochondrial creatine kinase oligomeric states. Biopolymers 2006; 81: 270–281
- Henon S, Meunier J. Microscope at the Brewster angle: direct observation of first-order phase transitions in monolayers. Rev Sci Instrum 1991; 62: 936–939
- Hönig D, Möbius D. Direct visualization of monolayers at the air-water interface by Brewster angle microscopy. J Phys Chem 1991; 95: 4590–4592
- Rodriguez Patino JM, Sanchez CC, Rodriguez Nino MR. Structural and morphological characteristics of [beta]-casein monolayers at the air-water interface. Food Hydrocolloids 1999; 13: 401–408
- Rodriguez Patino JM, Carrera Sanchez C, Rodriguez Nino MR. Morphological and structural characteristics of monoglyceride monolayers at the air-water interface observed by brewster angle microscopy. Langmuir 1999; 15: 2484–2492
- Ducharme D, Max JJ, Salesse C, Leblanc RM. Ellipsometric study of the physical states of phosphatidylchoilnes at the air-water interface. J Phys Chem 1990; 94: 1925–1932
- Sacre MM, Tocanne JF. Importance of glycerol and fatty acid residues on the ionic properties of phosphatidylglycerols at the air-water interface. Chem Phys Lipids 1977; 18: 334–354
- Garidel P, Blume A. 1,2-Dimyristoyl-sn-glycero-3-phosphoglycerol (DMPG) monolayers: influence of temperature, pH, ionic strength and binding of alkaline earth cations. Chem Phys Lipids 2005; 138: 50–59
- Davies J, Rideal E. Interfacial phenomena2nd ed. Academic Press, New York 1963; 265
- Minones J, Jr, Dynarowicz-Latka P, Minones J, Rodriguez Patino JM, Iribarnegaray E. Orientational changes in dipalmitoyl phosphatidyl glycerol Langmuir monolayers. J Colloid Interface Sci 2003; 265: 380–385
- Koppenol S, Yu H, Zografi G. Mixing of saturated and unsaturated phosphatidylcholines and phosphatidylglycerols in monolayers at the air/water interface. J Colloid Interface Sci 1997; 189: 158–166
- Etienne F, Roche Y, Peretti P, Bernard S. Cardiolipin packing ability studied by grazing incidence X-ray diffraction. Chem Phys Lipids 2008; 152: 13–23
- Vollhardt D, Fainerman VB, Siegel S. Thermodynamic and textural characterization of DPPG phospholipid monolayers. J Phys Chem B 2000; 104: 4115–4121
- Takamoto DY, Lipp MM, von Nahmen A, Lee KY, Waring AJ, Zasadzinski JA. Interaction of lung surfactant proteins with anionic phospholipids. Biophys J 2001; 81: 153–169
- Vollhardt D, Fainerman VB. Progress in characterization of Langmuir monolayers by consideration of compressibility. Adv Colloid Interface Sci 2006; 127: 83–97
- Krol S, Ross M, Sieber M, Kunneke S, Galla HJ, Janshoff A. Formation of three-dimensional protein-lipid aggregates in monolayer films induced by surfactant protein B. Biophys J 2000; 79: 904–918
- Bourdos N, Kollmer F, Benninghoven A, Ross M, Sieber M, Galla HJ. Analysis of lung surfactant model systems with time-of-flight secondary ion mass spectrometry. Biophys J 2000; 79: 357–369
- Kruger P, Schalke M, Wang Z, Notter RH, Dluhy RA, Losche M. Effect of hydrophobic surfactant peptides SP-B and SP-C on binary phospholipid monolayers. I. Fluorescence and dark-field microscopy. Biophys J 1999; 77: 903–914
- Lewis RN, Zweytick D, Pabst G, Lohner K, McElhaney RN. Calorimetric, x-ray diffraction, and spectroscopic studies of the thermotropic phase behavior and organization of tetramyristoyl cardiolipin membranes. Biophys J 2007; 92: 3166–3177
- Bagatolli LA. To see or not to see: lateral organization of biological membranes and fluorescence microscopy. Biochim Biophys Acta 2006; 1758: 1541–1556
- Barth PG, Scholte HR, Berden JA, Van der Klei-Van Moorsel JM, Luyt-Houwen IE, Van ‘t Veer-Korthof ET, Van der Harten JJ, Sobotka-Plojhar MA. An X-linked mitochondrial disease affecting cardiac muscle, skeletal muscle and neutrophil leucocytes. J Neurol Sci 1983; 62: 327–355
- Barth PG, Wanders RJ, Vreken P. X-linked cardioskeletal myopathy and neutropenia (Barth syndrome). J Pediatr 1999; 135: 273–276
- Vreken P, Valianpour F, Nijtmans LG, Grivell LA, Plecko B, Wanders RJ, Barth PG. Defective remodeling of cardiolipin and phosphatidylglycerol in Barth syndrome. Biochem Biophys Res Commun 2000; 279: 378–382